Control access with roles
You can control user access to Kubernetes Monitoring with Role Based Access Control (RBAC). By default, the basic roles grant users broad access. For more advanced access control, you can use Role-Based Access Control (RBAC) or Label-Based Access Control (LBAC).
Precision access with RBAC custom plugin roles
Kubernetes Monitoring provides custom app plugin roles which limit user access to only the permissions needed. This means you can assign a specific role to a user who must view or make changes to Kubernetes Monitoring, instead of granting the user broad administrator access in Grafana Cloud. The use of plugin roles is a security best practice.
There are two fixed roles for Kubernetes Monitoring:
plugins:grafana-k8s-app:adminplugins:grafana-k8s-app:reader
To assign these roles, refer to Assign RBAC roles.
Note
If you have granted a user the None basic role plus plugins.app:access, that user has no access to Kubernetes. To restore access, assign one of these Kubernetes roles.
Access with LBAC using namespace label
LBAC uses labels on resources to define access dynamically. You can use LBAC to limit access in Kubernetes Monitoring to an individual team by using any Prometheus label that exists on the Kubernetes metrics. The following are steps to use the namespace label. In this way, a team’s namespace can access only the metrics and logs they are responsible for, including viewing alerts and performing analysis and troubleshooting.
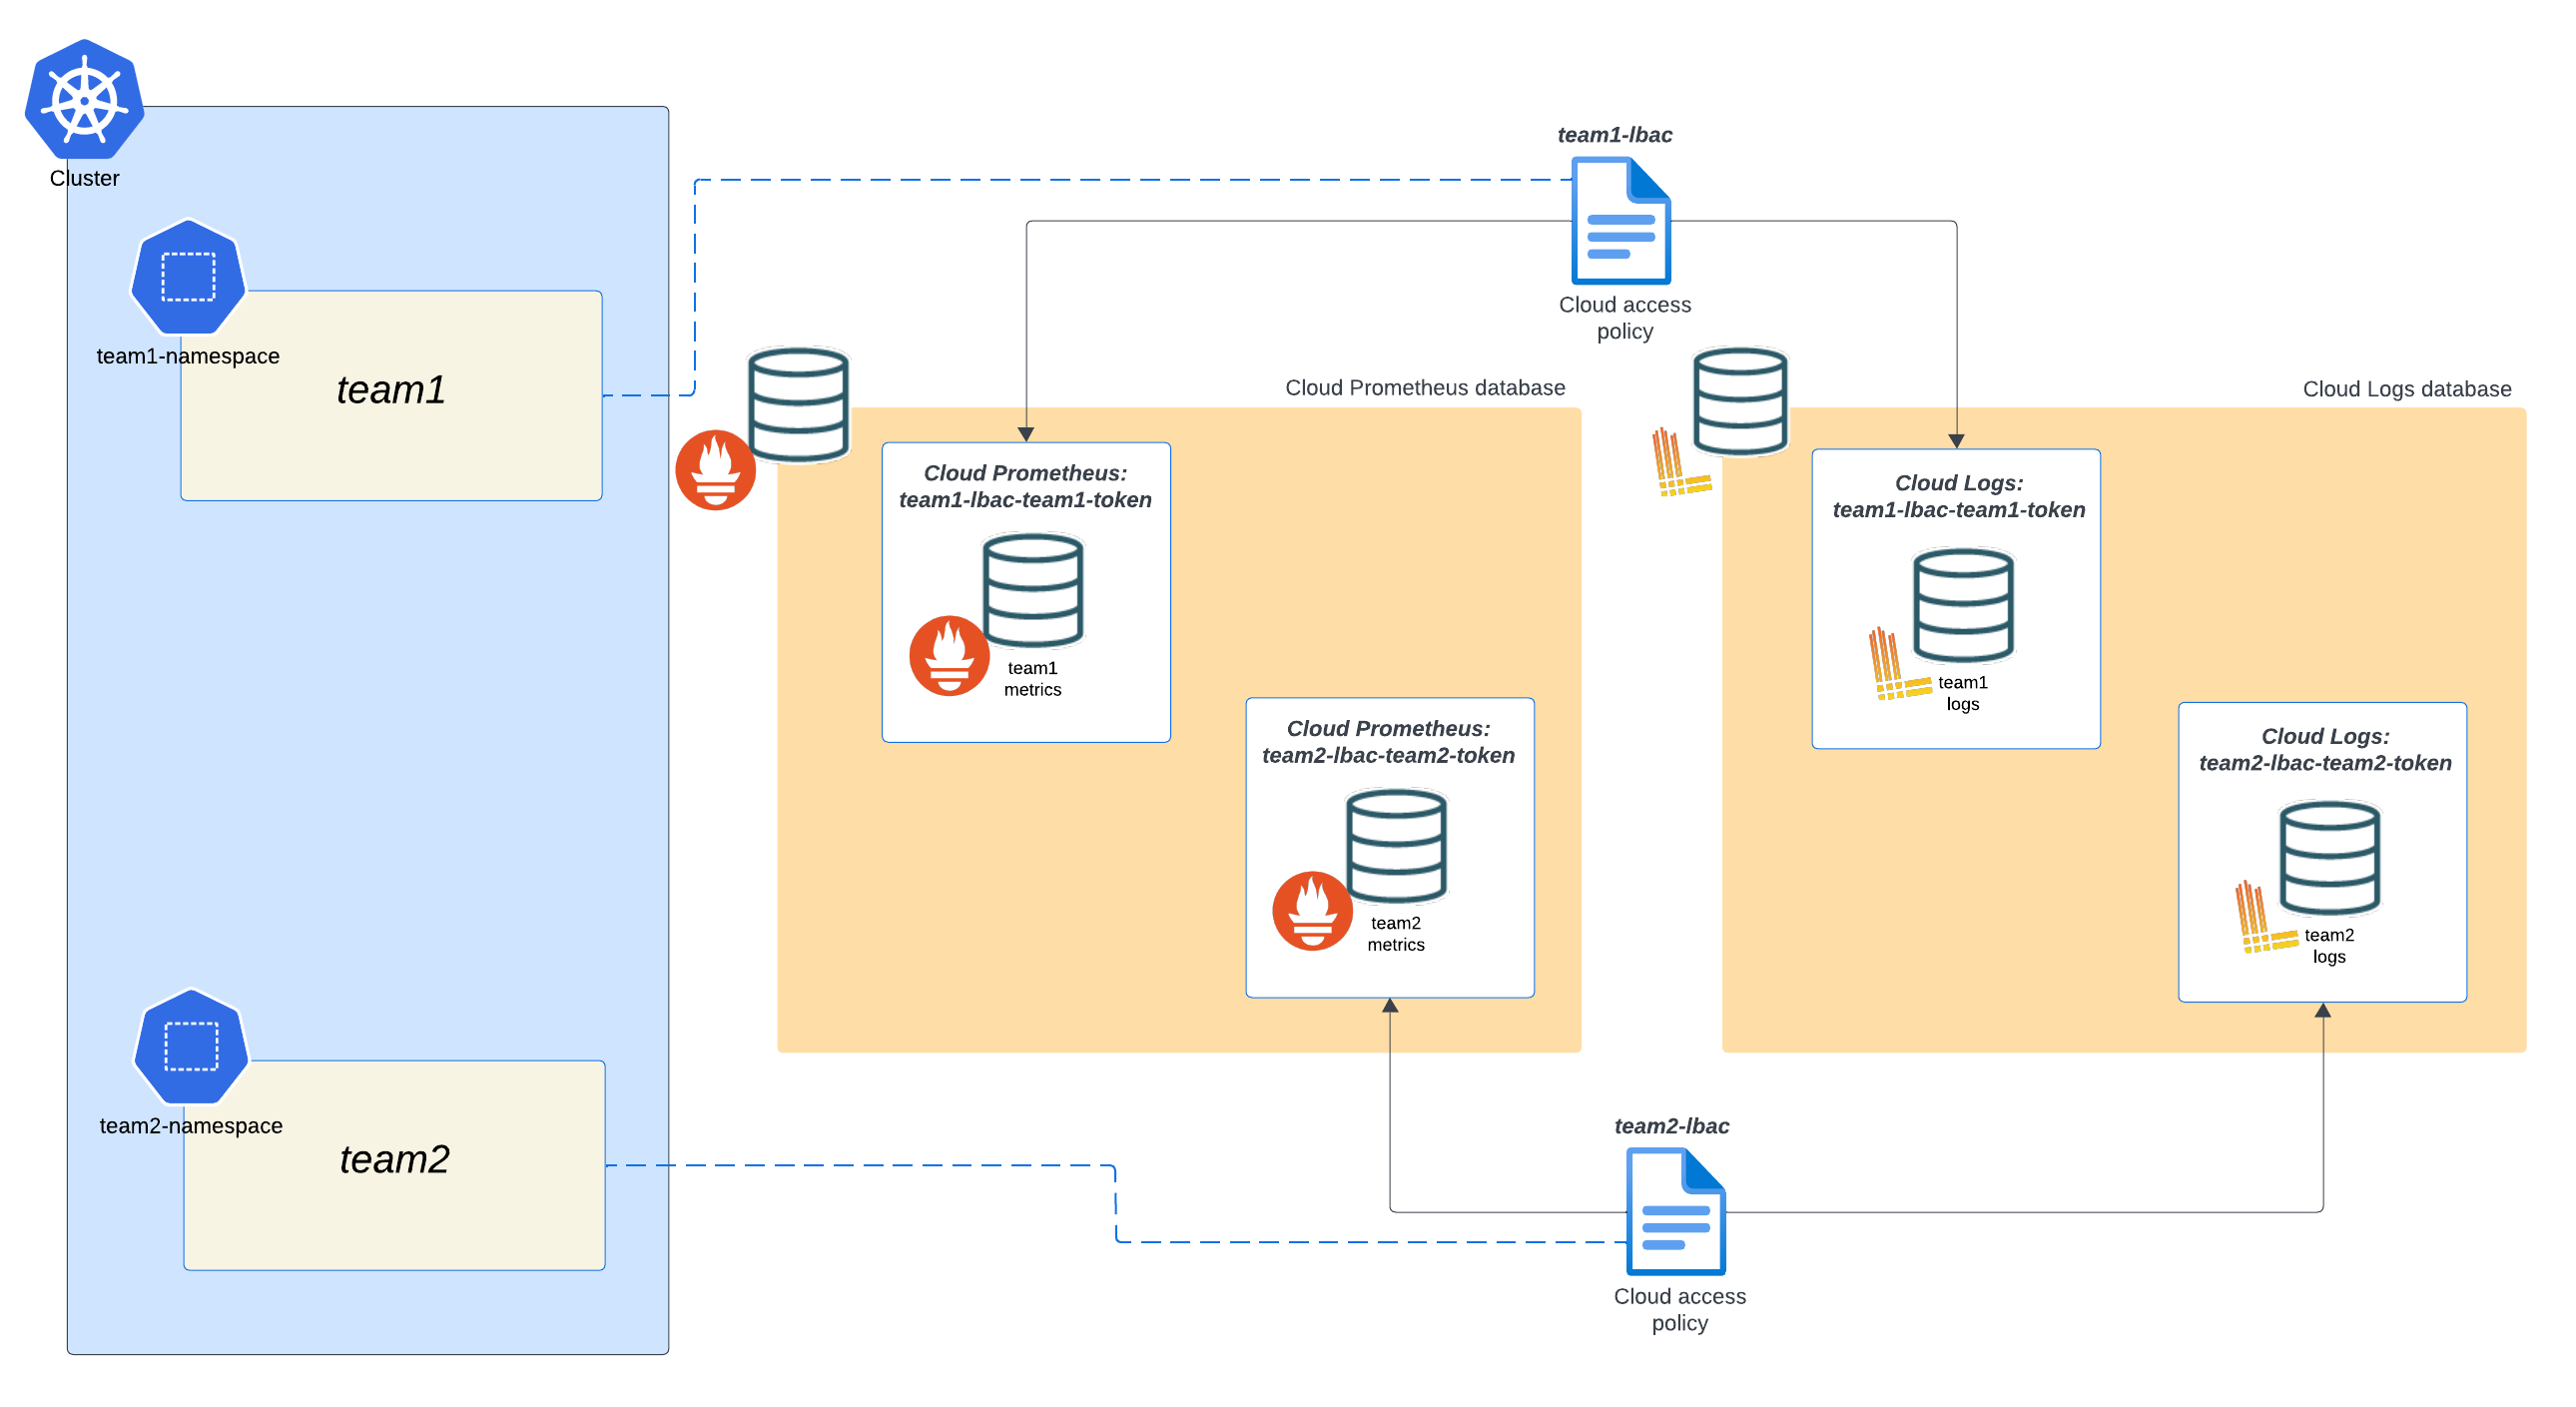
To accomplish LBAC, you create a cloud access policy and token that is assigned to the namespace that needs limited access. When you create the access policy token, Grafana Cloud creates a logical segmentation of logs and metrics in the Cloud Logs and Prometheus databases. Members of the team then have access only to those logs and metrics.
The following diagram shows two access polices with their tokens have been created for two separate teams.

The major steps to create one access policy per namespace are:
- Remove default data source permissions.
- Create a namespace.
- Create or sync the team.
- Create the access policy for the namespace.
- Create the access policy token.
- Assign team to data source.
- Select the data source for the namespace in Kubernetes Monitoring.
Remove default data source permissions
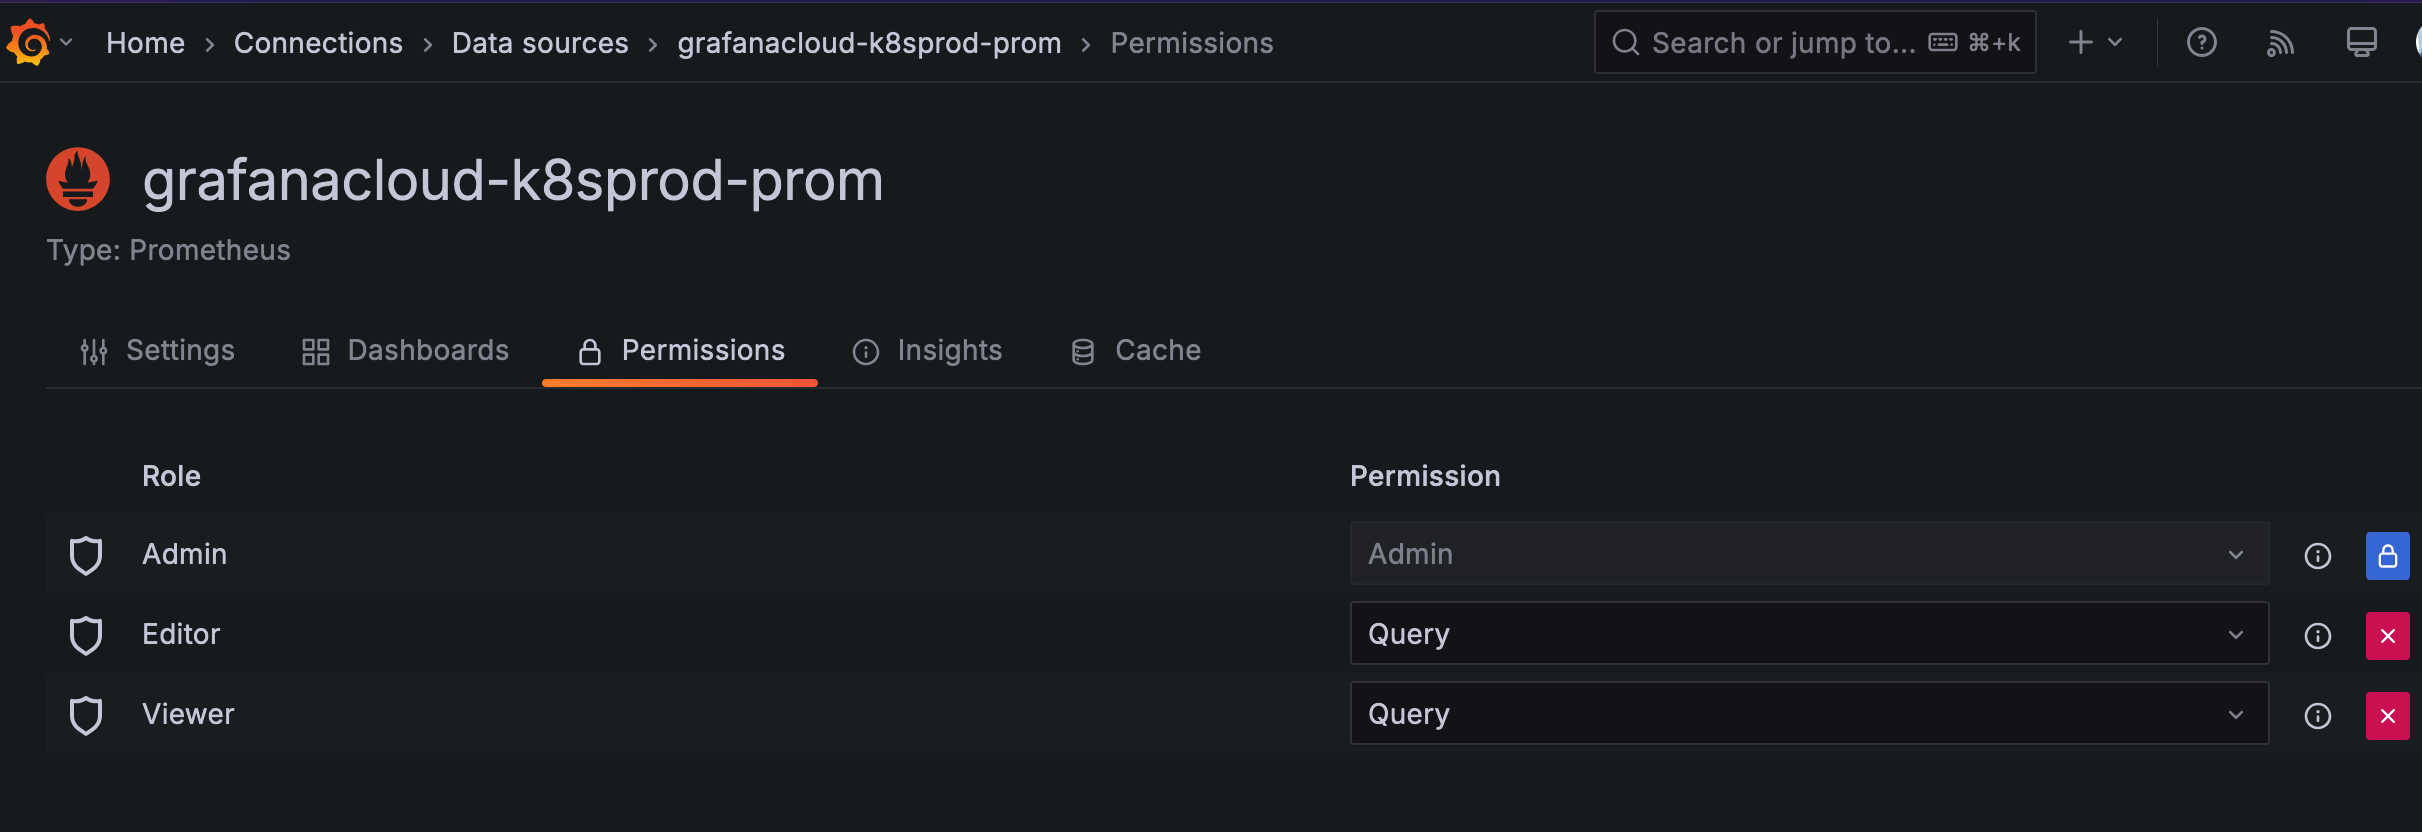
Remove the default Editor and Viewer permissions that apply to the cloud Prometheus and logs data sources. This prevents everyone being able to access all the data.
- In the Grafana Cloud portal of your stack, expand Connections on the main menu.
- Select Data sources
- Select the default data source.
- Click the Permissions tab.
- Delete the Editor role by selecting the X at the end of the row.
- Delete the Viewer role by selecting the X at the end of the row.
![A list of roles and their permissions for the data source A list of roles and their permissions for the data source]()
A list of roles and their permissions for the data source
Create a namespace
Sync or create the team
If you have already created a team using a third party, refer to Configure team sync.
If you have not created a team, create the team in Grafana Cloud, and add the appropriate team members.
Create an access policy for the namespace
Create an access policy for the namespace.
- In the Grafana Cloud portal of your stack, expand Administration in the main menu.
- Select Users and access on the menu.
- At the Users and access page, click Cloud access policies.
- Click Create access policy.
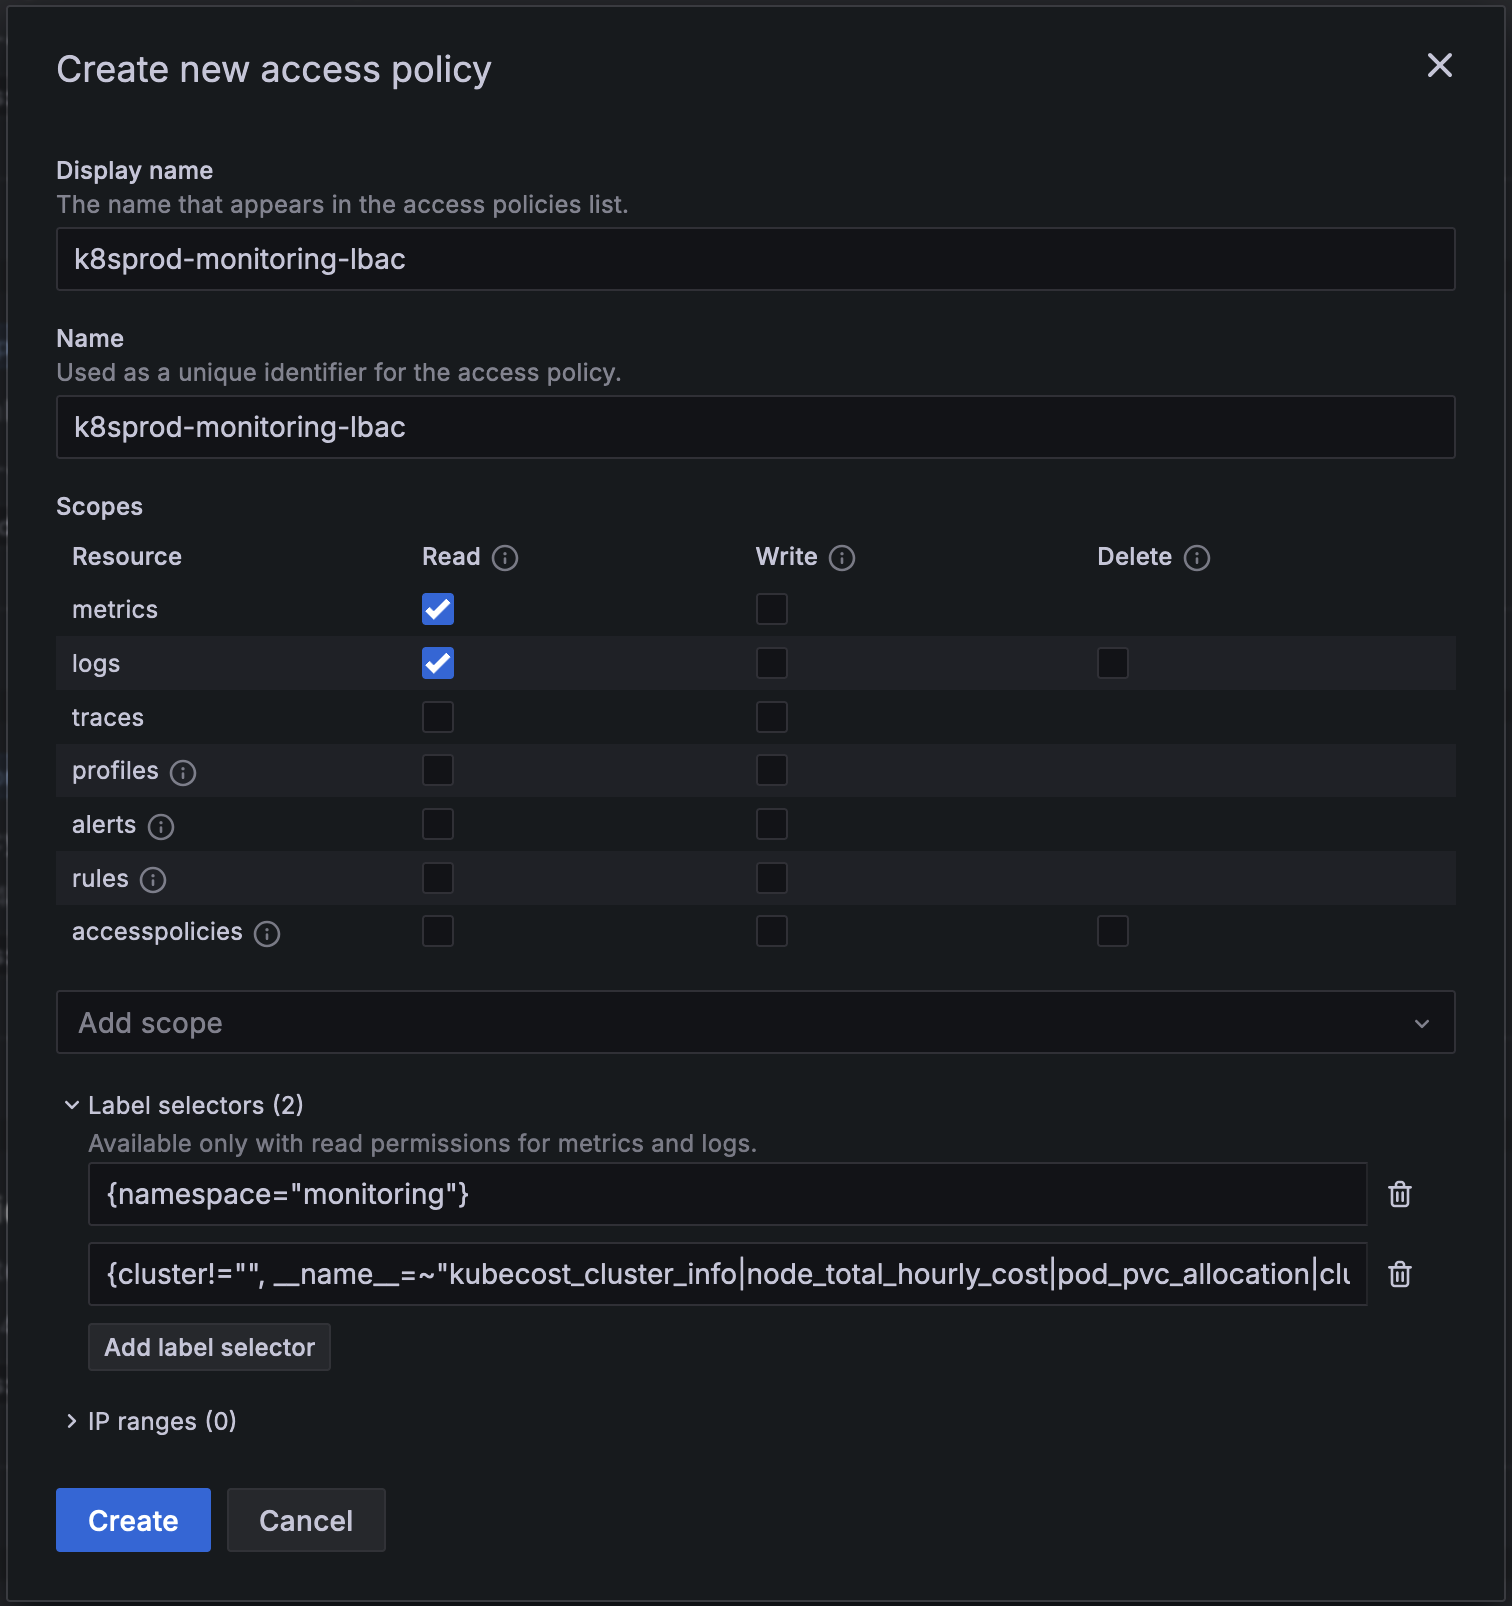
- In the Create new access policy window, enter the following:
- Display name: Enter a name for the policy.
- Scopes: Select Read for metrics and logs.
- Label selectors:
- Click Add label selector and add the following, changing the name of your namespace:
{ namespace = “mynamespace” } - Click Add label selector, then copy and paste the following in the label selector field:
{cluster!="", __name__=~"kubecost_cluster_info|node_total_hourly_cost|pod_pvc_allocation|cluster:namespace:pod_cpu.active:kube_pod_container_resource_requests|node_cpu_hourly_cost|kube_node_.*|machine_.*"}
- Click Add label selector and add the following, changing the name of your namespace:
- Click Create to create the policy.

Create access policy token
Create an access policy token for the access policy. As part of this process, you create data sources within the logs and metrics data sources that are available in Grafana Cloud. These custom data sources segmented areas of the two underlying databases, and they are specifically for the team associated with the namespace.
- In the Cloud access policies page, find the access policy you created.
- Click Add token.
- In the Create new token window, enter the name of the token, and click Create.
- In the Token successfully added window:
- Click Create data source for both the Prometheus and Logs data sources. Grafana generates each data source that will be available only with this access policy token.
- Click Copy to clipboard to copy the token.
- Paste the token into a file in a safe place.
Assign the team to the custom data sources
Change the permissions of the custom data sources that Grafana generated for the access policy token, and add the team to the new data sources.
In the Token successfully added window, complete the following steps for the Cloud Prometheus and Cloud Logs data sources.
- Click the Data source settings link next to the data source to open its settings.
- Select the Permissions tab.
- Delete the Viewer and Editor roles.
- Click Add a permission.
- In the drop-down menu, select Team.
- Select the team.
- Leave the Query permission selected.
- Click Save.
Choose the data source in Kubernetes Monitoring
Now team members can use the data source picker to view the data source for their namespace and view the data available to them.


