Send Kubernetes metrics, logs, and events to Grafana Cloud with Helm and Argo CD
You can use Argo CD to configure Kubernetes Monitoring, and use:
- The Kubernetes Monitoring GUI
- Preconfigured alerts and recording rules
Before you begin
Make sure you have the following available:
- Argo CD installed in your system
- Access to a Kubernetes Cluster
- The Admin role to install preconfigured components
Configuration steps
The steps to configure Kubernetes Monitoring with Terraform are:
- Use a Grafana Cloud Access Policy token.
- Install the preconfigured components.
- Install the Helm chart.
Create or gather Grafana Cloud Access Policy token
You can create a new access policy token or look up an existing token. See Grafana Cloud Access Policies for more information.
You’ll use this token in a future step.
Install preconfigured alerts and recording rules
To install preconfigured alerts and recording rules, complete the following steps:
- Navigate to your Grafana Cloud account.
- Click the upper-left menu icon to open the main menu.
- Click Observability.
- Click the Kubernetes tile. The Configuration page appears.
- Under the Backend installation section, click Install to install the alerts and recording rules.
Install the Helm chart using ArgoCD
To install the Kubernetes Monitoring components, complete the following steps.
Copy and paste the following configuration into a terminal:
cat >> grafana-k8s-monitoring.yaml <<'EOF'
apiVersion: argoproj.io/v1alpha1
kind: Application
metadata:
  name: grafana-k8s-monitoring
  namespace: "{argocd-namespace}"
finalizers:
  - resources-finalizer.argocd.argoproj.io
spec:
destination:
  name: ''
  namespace: "{namespace}"
  server: 'https://kubernetes.default.svc'
source:
  path: ''
  repoURL: 'https://grafana.github.io/helm-charts'
  targetRevision: ''
  chart: k8s-monitoring
  helm:
    valuesObject:
      cluster:
        name: "{cluster-name}"
      destinations:
        - name: grafana-cloud-metrics
          type: prometheus
          host: "{prometheus-url}/api/prom/push"
          auth:
            type: basic
            username: "{prometheus-username}"
            password: "{cloud-access-token}"
        - name: grafana-cloud-logs
          type: loki
          host: "{loki-url}"
            auth:
              type: basic
              username: "{loki-username}"
              password: "{cloud-access-token}"

      clusterMetrics:
        enabled: true
        kepler:
          enabled: true
        opencost:
          enabled: true
          metricsSource: grafana-cloud-metrics
          opencost:
            exporter:
              defaultClusterId: "{cluster-name}"
            prometheus:
              existingSecretName: grafana-cloud-metrics-grafana-k8s-monitoring
              external:
                url: "{prometheus-url}/api/prom"
      clusterEvents:
        enabled: true
      podLogs:
        enabled: true
      alloy-metrics:
        enabled: true
      alloy-singleton:
        enabled: true
      alloy-logs:
        enabled: true
EOF
Replace the following in the code:
{argocd-namespace}with your namespace in which Argo CD is deployed{namespace}with the namespace where you want to deploy Kubernetes Monitoring resources{cluster-name}with the name of your cluster{prometheus-url}with the URL of your Prometheus instance{prometheus-username}with the username of your Prometheus instance{loki-url}with the URL of your Loki instance{loki-username}with the username of your Loki instance{cloud-access-token}with your Grafana Cloud Access token
Run the following command:
shellkubectl apply -f grafana-k8s-monitoring.yaml
Next steps
Navigate to Kubernetes Monitoring, and click Configuration on the main menu.
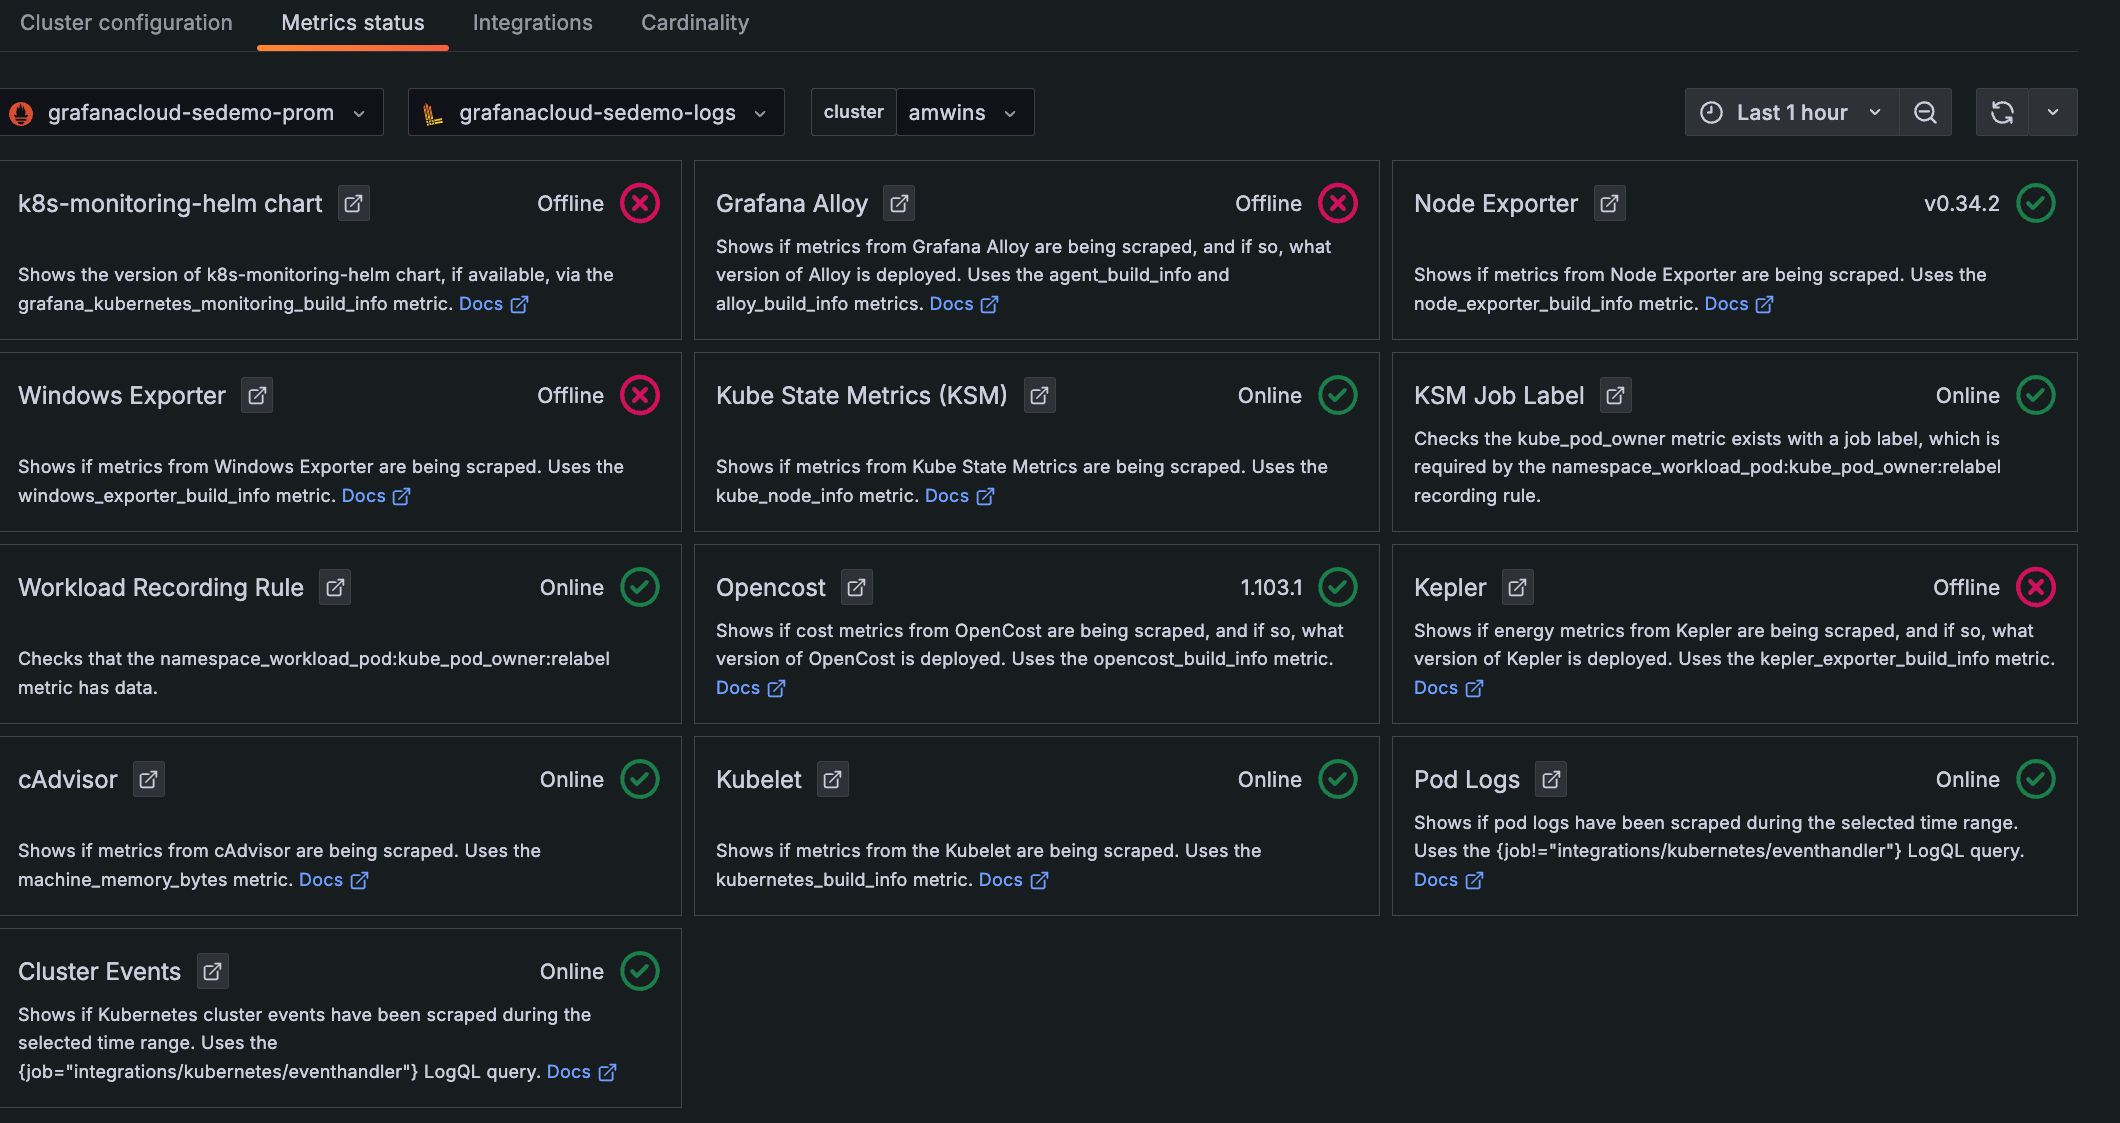
Click the Metrics status tab to view the data status. Your data begins populating in the view as the system components begin scraping and sending data to Grafana Cloud.
![**Metrics status** tab with status indicators for one Cluster Descriptions and statuses for each item chosen to be configured and whether they are online]()
Metrics status tab with status indicators for one Cluster
Was this page helpful?
Related resources from Grafana Labs


