Send Kubernetes metrics, logs, and events to Grafana Cloud with Helm and Ansible
You can use Helm and Ansible to configure Kubernetes Monitoring, and use:
- The Kubernetes Monitoring GUI
- Preconfigured alerts and recording rules
Before you begin
Make sure you have the following available:
- Ansible CLI installed in your system
- Access to a Kubernetes Cluster
- The Admin role to install preconfigured components
Configuration steps
The steps to configure Kubernetes Monitoring with Ansible are:
- Use a Grafana Cloud Access Policy token.
- Install the preconfigured components.
- Set up the Ansible Playbook
- Run the Ansible Playbook.
Create or gather Grafana Cloud Access Policy token
You can create a new access policy token or look up an existing token. See Grafana Cloud Access Policies for more information.
You’ll use this token in a future step.
Install preconfigured alerts and recording rules
To install preconfigured alerts and recording rules, complete the following steps:
- Navigate to your Grafana Cloud account.
- Click the upper-left menu icon to open the main menu.
- Click Observability.
- Click the Kubernetes tile. The Configuration page appears.
- Under the Backend installation section, click Install to install the alerts and recording rules.
Configure the Ansible Playbook
Note
Before you being configuration, find the latest version number of the Helm chart, then enter that version as part of your code.
To install the Kubernetes Monitoring components, complete the following steps.
- Copy and paste the following configuration into a terminal:
cat >> grafana-k8s-monitoring.yaml <<'EOF'
- name: Grafana Kubernetes Monitoring
  hosts: localhost

  # Declare variables
  vars:
    namespace: <NAMESPACE>
    cluster_name: <CLUSTER_NAME>
    metrics_username: <METRICS_USERNAME>
    prometheus_url: <PROMETHEUS_URL>
    logs_username: <LOGS_USERNAME>
    loki_url: <LOKI_URL>
    traces_username: <TRACES_USERNAME>
    tempo_url: <TRACES_URL>
    grafana_cloud_token: <GRAFANA_CLOUD_ACCESS_TOKEN>

  tasks:

    - name: Deploy Grafana Kubernetes Monitoring Helm Chart
      kubernetes.core.helm:
        name: grafana-k8s-monitoring
        chart_ref: grafana/k8s-monitoring
        release_namespace: "{{ namespace }}"
        chart_version: 0.2.5
        values:
          cluster:
            name: "{{ cluster_name }}"
          externalServices:
            prometheus:
              host: "{{ prometheus_url }}"
              basicAuth:
                username: "{{ metrics_username }}"
                password: "{{ grafana_cloud_token }}"
            loki:
              host: "{{ loki_url }}"
              basicAuth:
                username: "{{ logs_username }}"
                password: "{{ grafana_cloud_token }}"
            tempo:
              host: "{{ tempo_url }}"
              basicAuth:
                username: "{{ traces_username }}"
                password: "{{ grafana_cloud_token }}"
          opencost:
            opencost:
              exporter:
                defaultClusterId: "{{ cluster_name }}"
              prometheus:
                external:
                  url: "{{ prometheus_url }}/api/prom"
          traces:
            enabled: true
          grafana-agent:
            agent:
              extraPorts:
                - name: otlp-traces
                  port: 4317
                  targetPort: 4317
                  protocol: TCP
EOF- Replace the following in the code:
NAMESPACEwith your namespace where you want to deploy Kubernetes Monitoring resourcesCLUSTER_NAMEwith your Cluster nameMETRICS_USERNAMEwith the Prometheus instance IDPROMETHEUS_URLwith the push endpoint URL of the Prometheus instanceLOGS_USERNAMEwith Loki UsernameLOKI_URLwith the push endpoint URL of the Loki instanceTRACES_USERNAMEwith Tempo UsernameTEMPO_URLwith the push endpoint URL of the Tempo instanceGRAFANA_CLOUD_ACCESS_TOKENwith your Grafana Cloud Access token
Run the Ansible Playbook
Complete the following steps to run the Ansible Playbook and deploy the resources.
Open a terminal or shell.
Navigate to the directory where the Ansible Playbook is located.
Run the following command to run the Ansible Playbook:
shellansible-playbook grafana-k8s-monitoring.yamlThis command will run the Ansible Playbook, Installing the Kubernetes Monitoring components in your cluster.
Next steps
Navigate to Kubernetes Monitoring, and click Configuration on the main menu.
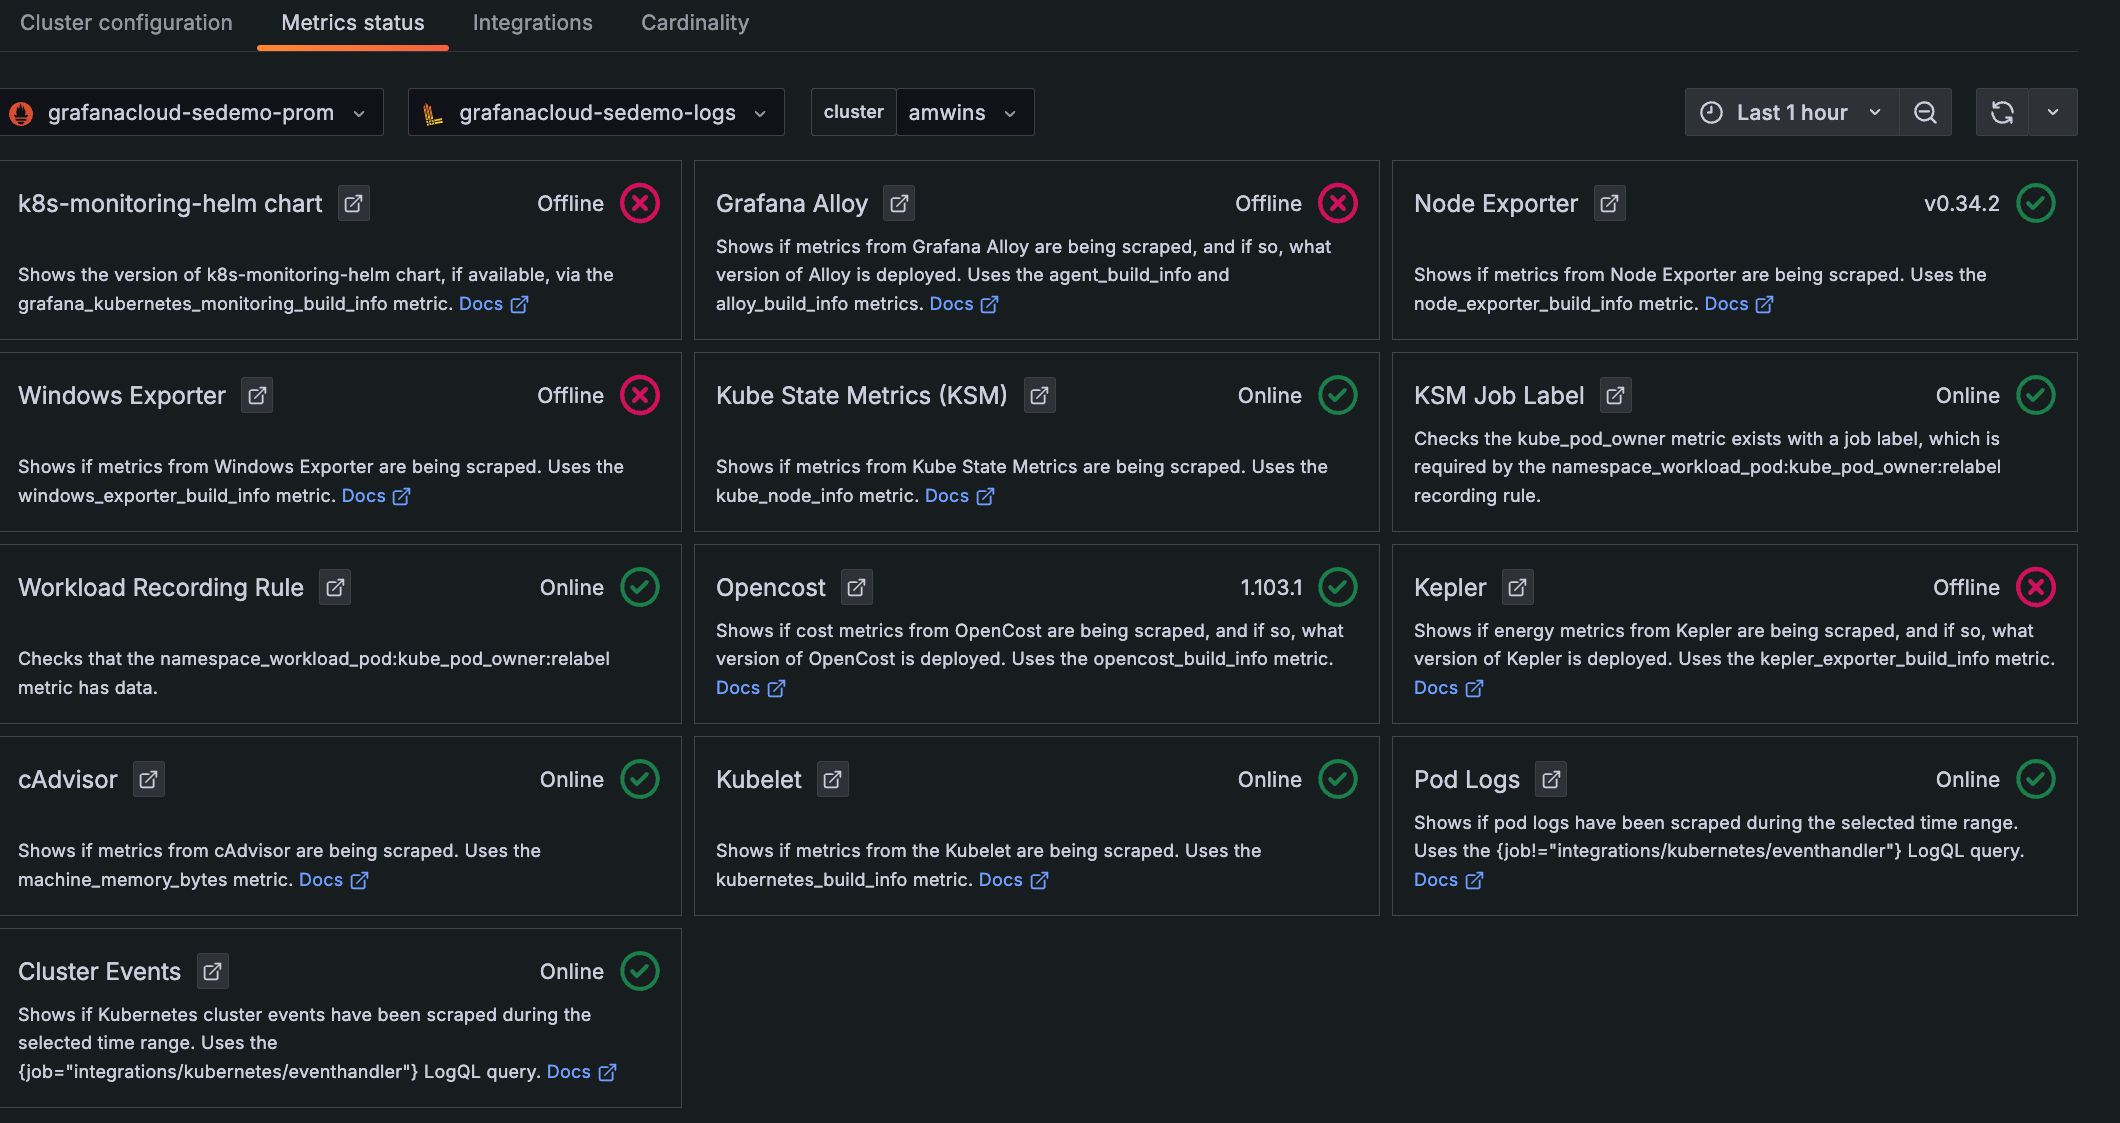
Click the Metrics status tab to view the data status. Your data begins populating in the view as the system components begin scraping and sending data to Grafana Cloud.
![**Metrics status** tab with status indicators for one Cluster Descriptions and statuses for each item chosen to be configured and whether they are online]()
Metrics status tab with status indicators for one Cluster
Was this page helpful?
Related resources from Grafana Labs


