
SNMP integration for Grafana Cloud
The SNMP integration lets you monitor any generic SNMP (Simple Network Management Protocol) networking device, while providing additional MIBs support for Cisco, Juniper, and Mikrotik devices.
This integration includes 14 useful alerts and 3 pre-built dashboards to help monitor and visualize SNMP metrics and logs.
Before you begin
The device you want to monitor must support reporting device data through SNMP protocol. For logs collection, it must support sending messages via Syslog (RFC3164 or RFC5424).
The instructions for enabling SNMP vary for each device, but in general, you should:
- Enable SNMP v2c or v3 on your device (v3 is recommended for security reasons).
- For logs collection:
- Configure syslog on your network devices to send logs to your Alloy agent:
- UDP/10514: for RFC3164 format
- UDP/10515: for RFC5424 format
- UDP/10516: for Cisco IOS (with origin)
- UDP/10517: for Cisco IOS (without origin).
- Configure syslog on your network devices to send logs to your Alloy agent:
- Ensure the Alloy agent:
- Can access the devices’ SNMP port UDP/161 for metrics collection
- Can receive syslog messages on UDP/10514-10517 ports (or as configured) for logs.
Follow the vendor-specific instructions to complete the setup.
Install SNMP integration for Grafana Cloud
- In your Grafana Cloud stack, click Connections in the left-hand menu.
- Find SNMP and click its tile to open the integration.
- Review the prerequisites in the Configuration Details tab and set up Grafana Alloy to send SNMP metrics and logs to your Grafana Cloud instance.
- Click Install to add this integration’s pre-built dashboards and alerts to your Grafana Cloud instance, and you can start monitoring your SNMP setup.
Configuration snippets for Grafana Alloy
Simple mode
To instruct Grafana Alloy to scrape your SNMP target, follow these instructions.
Note: Simple mode instructions provide snippets useful for a small number of static targets. For dynamic targets and syslog collection with log enrichment, refer to the advanced mode instructions.
First, manually copy and append the following snippets into your Grafana Alloy configuration file.
Then, follow the instructions below to modify the necessary variables.
Integrations snippets
Advanced mode
The advanced mode instructions provide snippets useful for dynamic targets and syslog collection with logs enrichment.
First, manually copy and append the following snippets into your Grafana Alloy configuration file.
Then, follow the instructions below to modify the necessary variables.
Advanced integrations snippets
Add prometheus.exporter.snmp, prometheus.scrape, and prometheus.relabel to your Grafana Alloy configuration to monitor an SNMP device.
Add any Prometheus SD discovery source to discover SNMP devices we need to monitor. For networking, useful sources could be discover.file, discovery.http (as implemented in DCIM apps like Netbox), or discovery.dns.
An example yaml file with devices listed:
- targets:
    - 192.168.1.2:161
  labels:
    module: system,if_mib,cisco_device
    name: net.cisco.c2911
    auth: public_v2
    __rack: rack1
    datacenter: dc1
- targets:
    - 192.168.1.3:161
  labels:
    module: system,if_mib,juniper
    name: net.juniper.ex4200-24f
    auth: custom_auth_v3
    __rack: rack2
    datacenter: dc1
To provide custom SNMP auths, create new file auths.yml:
auths:
    custom_auth_v3:
        security_level: authPriv
        username: snmpuser1
        password: <password>
        auth_protocol: SHA
        priv_protocol: AES
        priv_password: <priv_password>
        version: 3
And uncomment the following in the prometheus.exporter.snmp "integrations_snmp" component:
    config_file = "/etc/alloy/auths.yml"
    config_merge_strategy = "merge"
Refer to prometheus.exporter.snmp in Grafana Alloy reference documentation for a complete description of the configuration options. Also check SNMP auths format.
Advanced logs snippets
all
The SNMP integration includes a loki.source.syslog components that collect logs from your SNMP devices. The configuration sets up a UDP listeners on ports 10514 expecting RFC3164, and 10514 for RFC5424.
Note: To enable loki.enrich, set --stability.level=experimental.
Additionally, the logs are enriched with device metadata from your discovery configured in the integrations section. The enrichment matches logs to devices based on the hostname label and copies additional labels from discovery for better correlation between SNMP device logs and metrics.
To configure the syslog receiver:
- Ensure your SNMP devices are configured to send syslog messages to the Alloy agent’s port 10514 or port 10515.
- Verify that the
hostnamein your syslog messages matches the device names in your discovery configuration for proper enrichment. Alternatively, you can use IP addresses for matching.
For more information about syslog configuration in Alloy, refer to the loki.source.syslog and loki.source.enrich documentation.
About Cisco logs
Cisco network logs have their own format not compatible with RFC3164/RFC5424. To collect Cisco IOS logs, you can setup rsyslog on the same host with the following snippet in /etc/rsyslog.d/100-ciscolog.conf:
On Cisco device, set logging origin-id hostname to better identify log sources.
Then setup Cisco devices to send logs to UDP/10516 port.
Grafana Agent static configuration (deprecated)
The following section shows configuration for running Grafana Agent in static mode which is deprecated. You should use Grafana Alloy for all new deployments.
Before you begin with Grafana Agent static
The device you are monitoring must support reporting device data through SNMP protocol.
The instructions for enabling SNMP vary for each device. The SNMP daemon can also be installed on any linux device. Once SNMP is enabled for the device, install the Grafana agent where it can access the SNMP device on SNMP ports UDP/TCP 161 and 162 using the instructions given below.
Install SNMP integration
- In your Grafana Cloud stack, click Connections in the left-hand menu.
- Find SNMP and click its tile to open the integration.
- Review the prerequisites in the Configuration Details tab and set up Grafana Agent to send SNMP metrics and logs to your Grafana Cloud instance.
- Click Install to add this integration’s pre-built dashboards and alerts to your Grafana Cloud instance, and you can start monitoring your SNMP setup.
Post-install configuration for the SNMP integration
This integration is configured to work with the snmp_exporter, which is embedded in Grafana Agent.
Enable the integration by adding the provided snippets to your agent configuration file.
Replace the <host_address_*> tags with the addresses of the relevant SNMP devices. Also configure the walk params according to your configuration.
For a full description of configuration options see how to configure the snmp block in the agent documentation.
Configuration snippets for Grafana Agent
Below integrations, insert the following lines and change the URLs according to your environment:
  snmp:
    enabled: true
    relabel_configs:
      - action: replace
        source_labels: [job]
        regex: (^.*snmp)\/(.*)
        target_label: job_snmp
        replacement: $1
      - action: replace
        source_labels: [job]
        regex: (^.*snmp)\/(.*)
        target_label: snmp_target
        replacement: $2
      - action: replace
        source_labels: [job]
        regex: (^.*snmp)\/(.*)
        target_label: instance
        replacement: $2
    snmp_targets:
      - name: network_switch_1
        address: '<host_address_1>'
        module: if_mib
        auth: public_v2
      - name: network_switch_2
        address: '<host_address_2>'
        module: if_mib
        auth: public_v2
Below logs.configs.scrape_configs, insert the following lines according to your environment.
    - job_name: integrations/syslog
      syslog:
        listen_address: "0.0.0.0:10515"
        listen_protocol: udp
        labels:
          job: syslog
          instance: '<your-instance-name>'
      relabel_configs:
        - source_labels: [__syslog_message_hostname]
          target_label: hostname
        - source_labels: [__syslog_message_severity]
          target_label: level
        - source_labels: [__syslog_message_facility]
          target_label: facility
        - source_labels: [__syslog_message_app_name]
          target_label: syslog_app_name
        - source_labels: [__syslog_message_msg_id]
          target_label: syslog_msg_id
        - action: replace
          source_labels: [hostname]
          target_label: job_snmp
          replacement: integrations/snmp/$1
        - source_labels: [__syslog_message_hostname]
          target_label: snmp_target
Full example configuration for Grafana Agent
Refer to the following Grafana Agent configuration for a complete example that contains all the snippets used for the SNMP integration. This example also includes metrics that are sent to monitor your Grafana Agent instance.
Dashboards
The SNMP integration installs the following dashboards in your Grafana Cloud instance to help monitor your system.
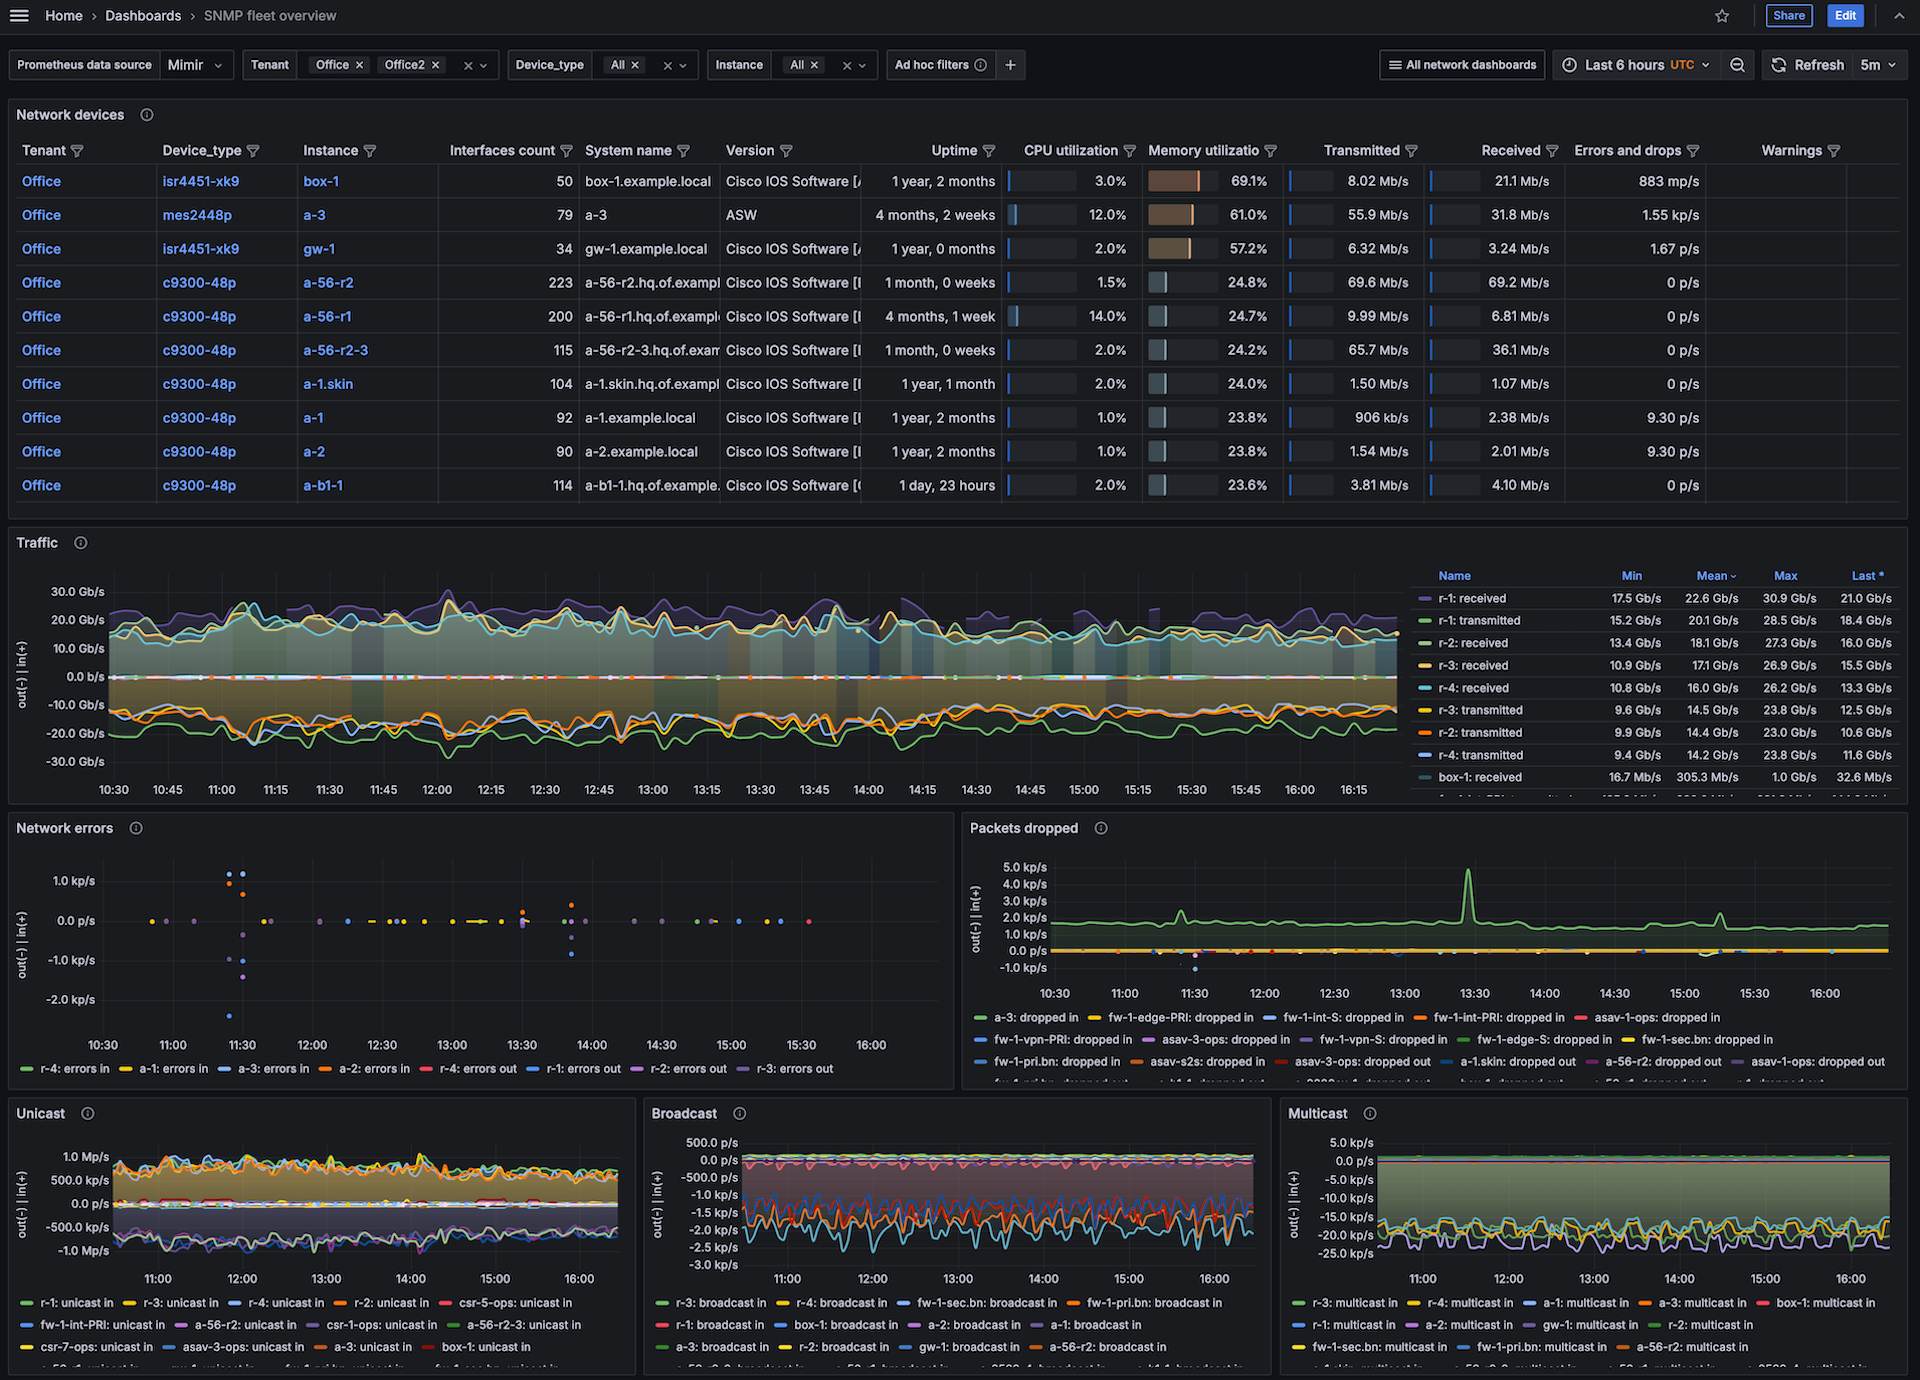
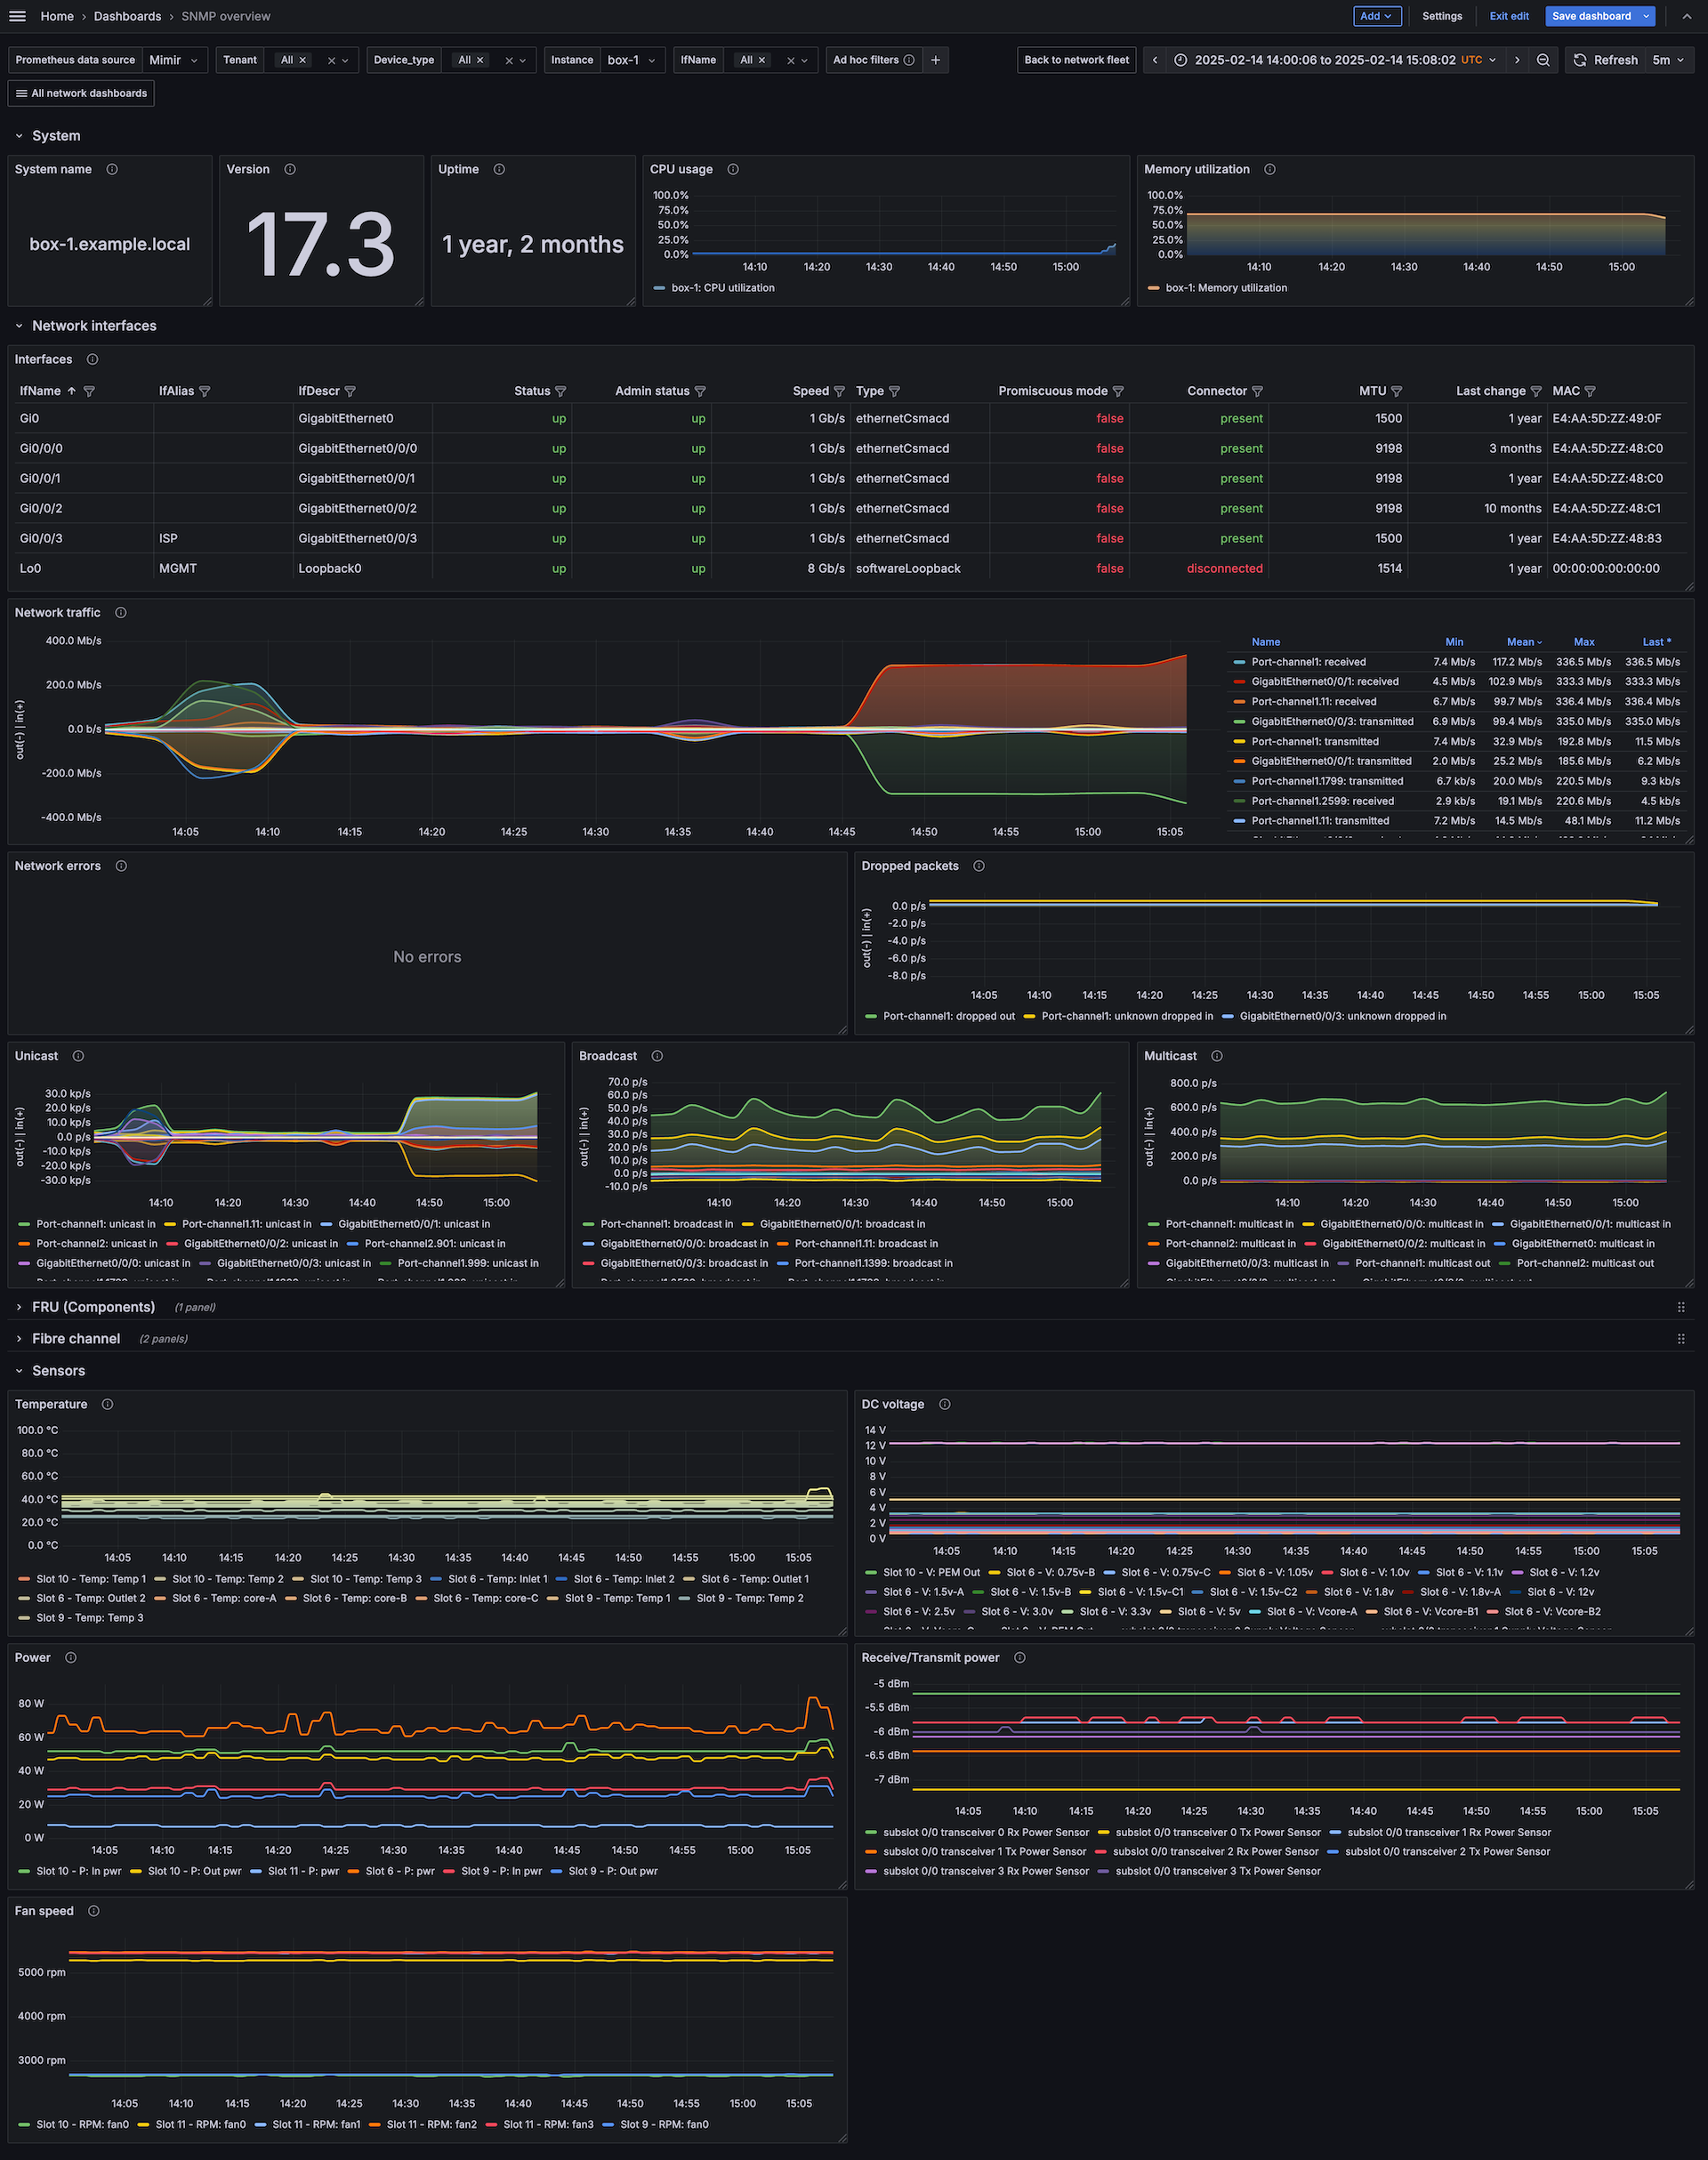
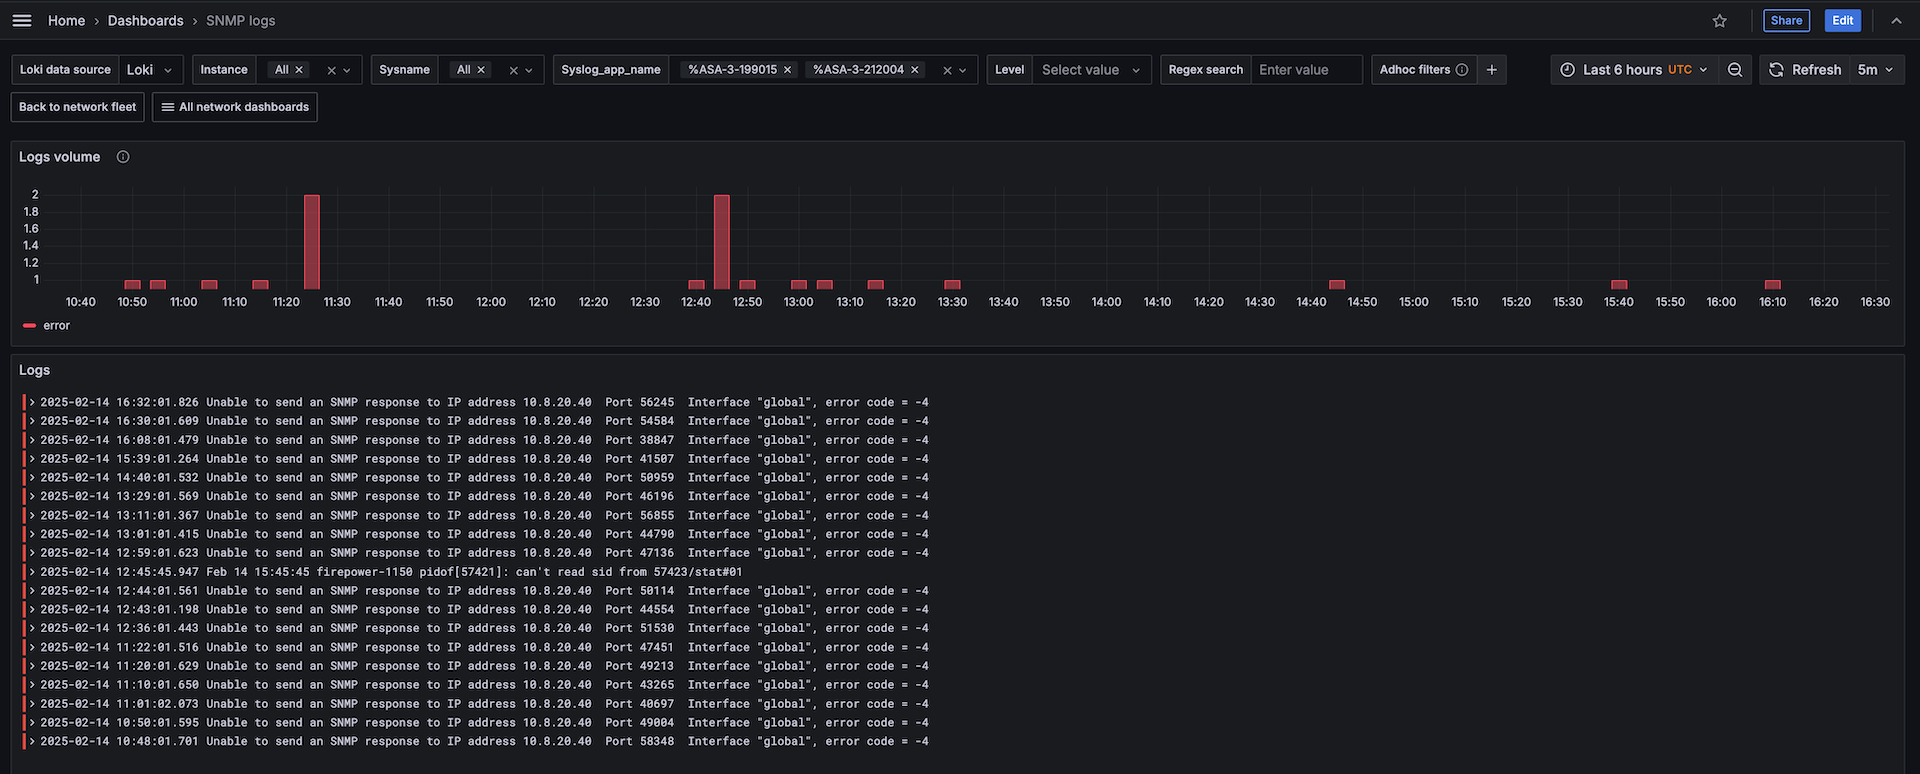
- SNMP fleet overview
- SNMP logs
- SNMP overview
SNMP fleet
SNMP overview
SNMP logs
Alerts
The SNMP integration includes the following useful alerts:
integration-snmp-fc-alerts
integration-snmp-alerts
integration-snmp-exporter-alerts
Metrics
The most important metrics provided by the SNMP integration, which are used on the pre-built dashboards and Prometheus alerts, are as follows:
- cefcFRUPowerOperStatus
- cempMemPoolFree
- cempMemPoolType
- cempMemPoolUsed
- ciscoImageString
- ciscoMemoryPoolFree
- ciscoMemoryPoolUsed
- cpmCPUMemoryFree
- cpmCPUMemoryUsed
- cpmCPUTotal1minRev
- entSensorPrecision
- entSensorValue
- fcHCIfBBCreditTransistionFromZero
- fcHCIfBBCreditTransistionToZero
- fcIfCurrRxBbCredit
- fcIfCurrTxBbCredit
- fcIfFramesDiscard
- fcIfInvalidCrcs
- fcIfInvalidTxWords
- fcIfTxWaitCount
- fcIfTxWtAvgBBCreditTransitionToZero
- hrProcessorLoad
- hrStorageSize
- hrStorageUsed
- ifAdminStatus
- ifConnectorPresent
- ifHCInBroadcastPkts
- ifHCInMulticastPkts
- ifHCInOctets
- ifHCInUcastPkts
- ifHCOutBroadcastPkts
- ifHCOutMulticastPkts
- ifHCOutOctets
- ifHCOutUcastPkts
- ifHighSpeed
- ifInDiscards
- ifInErrors
- ifInUnknownProtos
- ifLastChange
- ifMtu
- ifOperStatus
- ifOutDiscards
- ifOutErrors
- ifPhysAddress
- ifPromiscuousMode
- ifType_info
- jnxOperatingBuffer
- jnxOperatingCPU
- jnxOperatingTemp
- mtxrHlPower
- mtxrHlTemperature
- mtxrHlVoltage
- snmp_scrape_duration_seconds
- snmp_scrape_pdus_returned
- sysDescr
- sysName
- sysUpTime
- up
Changelog
Cost
By connecting your SNMP instance to Grafana Cloud, you might incur charges. To view information on the number of active series that your Grafana Cloud account uses for metrics included in each Cloud tier, see Active series and dpm usage and Cloud tier pricing.
Was this page helpful?
Related resources from Grafana Labs


