
Azure Event Hubs integration for Grafana Cloud
Move your messages from the Azure Event Hubs to Grafana Cloud.
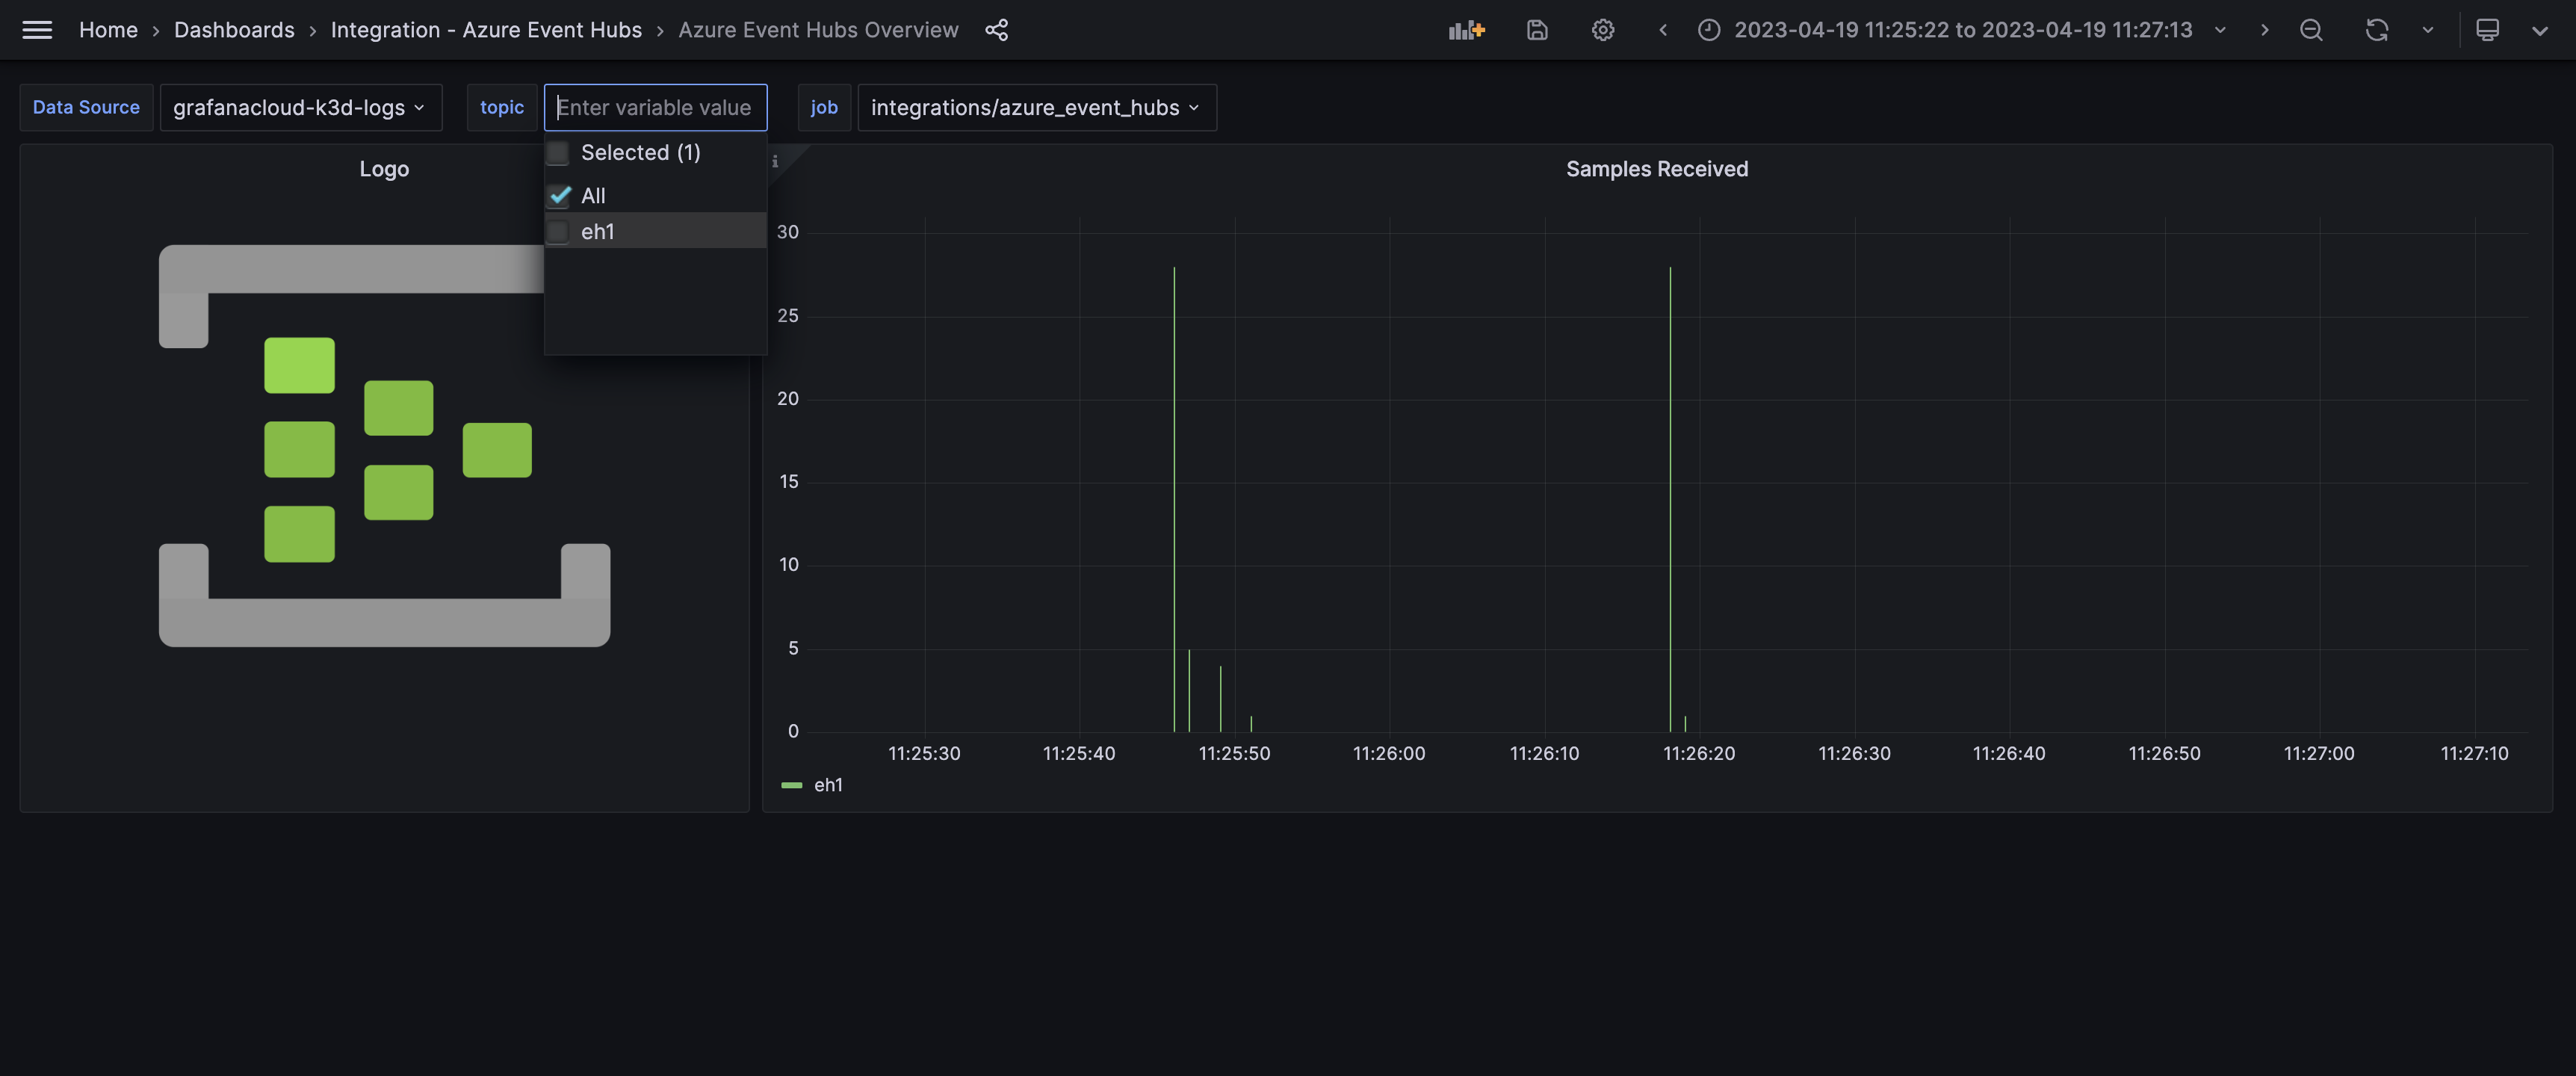
This integration includes 1 pre-built dashboard to help monitor and visualize Azure Event Hubs metrics and logs.
Before you begin
The Azure Event Hubs integration is based on configuring Grafana Alloy to consume events from Azure Event Hub.
This integration uses Apache Kafka endpoint provided by Azure Event Hubs.
This endpoint is available for all Azure Event Hubs pricing plans except Basic. Pricing plans are described on the Microsoft website.
Example of how to set up Azure Event Hubs and send logs from Function App
This is an example of how to start Event Hubs and route the logs from the Function App.
Event Hubs
- Creating an Azure Event Hubs namespace with an enabled Kafka endpoint and creating a policy for listening using the Azure CLI:
Log in to your Azure account using the following command:Follow the instructions to complete the login process.
az login - List your available subscriptions by running the following command:This will show a list of your available subscriptions and their details.
az account list --output table - Select the subscription that you want to use by running the following command:Replace
az account set --subscription <subscription-id>with the ID of the subscription that you want to use. - Create an Azure Event Hubs namespace using the following command:Replace
az eventhubs namespace create --resource-group <resource-group-name> --name <namespace-name> --location <location> --sku <sku> --enable-kafka true, , , with your own values. The parameter should be set to either “Standard” or “Premium” if you want to enable Kafka. - Create an Event Hub within your namespace using the following command:Replace
az eventhubs eventhub create --resource-group <resource-group-name> --namespace-name <namespace-name> --name <eventhub-name>, , and with your own values. - Create a shared access policy for listening to events using the following command:Replace <rule_name>,
az eventhubs namespace authorization-rule create --name <rule_name> --resource-group <resource-group-name> --namespace-name <namespace-name> --rights Listen, , and with your own values. This command creates a policy with the “Listen” permission. - Get the connection string value for your Event Hub using the following command:Replace
az eventhubs namespace authorization-rule keys list --resource-group <resource-group-name> --namespace-name <namespace-name> --name <policy-name> --query primaryConnectionString --output tsv, , and with your own values. This command will output the connection string for your Event Hubs Namespace, which is needed to configure the integration to receive your logs. Note: Make sure to save the connection string value in a secure location, as it contains sensitive information and can be used to access all your event hubs within a namespace.
Configure diagnostic settings for Function App
To set up diagnostic settings for your Function App to send logs to an event hub, you need to follow these steps:
- Navigate to your Function App in the Azure portal.
- Under “Monitoring”, click on “Diagnostic settings”.
- Click on “+ Add diagnostic setting” to add a new diagnostic setting.
- Give your diagnostic setting a name.
- Under “Categories”, select the category of logs that you want to send to the event hub. For example, you may choose “Function Application Logs”.
- Under “Destination details”, select “Stream to an event hub” as the destination and choose the appropriate options.
- Configure any advanced settings if needed.
- Click “Save” to save your diagnostic setting.
- Once your diagnostic setting is saved, your Function App will start sending logs to the specified event hub.
Install Azure Event Hubs integration for Grafana Cloud
- In your Grafana Cloud stack, click Connections in the left-hand menu.
- Find Azure Event Hubs and click its tile to open the integration.
- Review the prerequisites in the Configuration Details tab and set up Grafana Agent to send Azure Event Hubs metrics and logs to your Grafana Cloud instance.
- Click Install to add this integration’s pre-built dashboard to your Grafana Cloud instance, and you can start monitoring your Azure Event Hubs setup.
Configuration snippets for Grafana Alloy
Advanced mode
The following snippets provide examples to guide you through the configuration process.
To instruct Grafana Alloy to scrape your Azure Event Hubs instances, manually copy and append the snippets to your alloy configuration file, then follow subsequent instructions.
Advanced logs snippets
darwin
discovery.relabel "logs_integrations_integrations_azure_event_hubs" {
	targets = []

	rule {
		source_labels = ["__meta_kafka_topic"]
		target_label  = "topic"
	}
}

loki.source.azure_event_hubs "logs_integrations_integrations_azure_event_hubs" {
	fully_qualified_namespace = "<fully_qualified_namespace>"
	event_hubs                = ["<event_hub_name>"]

	authentication {
		mechanism         = "connection_string"
		connection_string = "<connection_string>"
	}
	use_incoming_timestamp = true
	relabel_rules          = discovery.relabel.logs_integrations_integrations_azure_event_hubs.rules
	labels                 = {
		job = "integrations/azure_event_hubs",
	}
	forward_to = [loki.write.grafana_cloud_loki.receiver]
}
To monitor your Azure Event Hubs, you will use a combination of the following components:
- discovery.relabel defines any relabeling needed before sending logs to Loki.
- loki.source.azure_event_hubs receives Azure Event Hubs messages by making use of an Apache Kafka endpoint on Event Hubs.
Find the placeholders and replace them with your values:
<fully_qualified_namespace>- Event hub namespace. Thefully_qualified_namespaceargument must refer to a fullHOST:PORTthat points to your event hub, such as<namespace>.servicebus.windows.net:9093.<namespace>is the name of your Event Hubs Namespace, and it is specified when you create the namespace. Later it can be found in the Azure portal on the Event Hubs Namespace dashboard.<connection_string>- Event Hubs ConnectionString for authentication on Azure Cloud. To find or create a connection string for Event Hubs in Azure, follow these steps:- Navigate to your Event Hubs in the Azure portal.
- Under “Settings”, click on “Shared access policies” to see existing policies.
- Click on the “+” button to create a new shared access policy.
- Give your policy a name and select the appropriate permissions (at least “Listen”).
- Click “Create” to create the policy.
- Click on your newly created policy to view its properties.
- Under “Shared access keys”, you can view the primary and secondary connection strings for your policy.
- Copy the connection string that you want to use and use it in your code or configuration.
<event_hub_name>- Event Hub to consume, you can specify multiple.
linux
discovery.relabel "logs_integrations_integrations_azure_event_hubs" {
	targets = []

	rule {
		source_labels = ["__meta_kafka_topic"]
		target_label  = "topic"
	}
}

loki.source.azure_event_hubs "logs_integrations_integrations_azure_event_hubs" {
	fully_qualified_namespace = "<fully_qualified_namespace>"
	event_hubs                = ["<event_hub_name>"]

	authentication {
		mechanism         = "connection_string"
		connection_string = "<connection_string>"
	}
	use_incoming_timestamp = true
	relabel_rules          = discovery.relabel.logs_integrations_integrations_azure_event_hubs.rules
	labels                 = {
		job = "integrations/azure_event_hubs",
	}
	forward_to = [loki.write.grafana_cloud_loki.receiver]
}
To monitor your Azure Event Hubs, you will use a combination of the following components:
- discovery.relabel defines any relabeling needed before sending logs to Loki.
- loki.source.azure_event_hubs receives Azure Event Hubs messages by making use of an Apache Kafka endpoint on Event Hubs.
Find the placeholders and replace them with your values:
<fully_qualified_namespace>- Event hub namespace. Thefully_qualified_namespaceargument must refer to a fullHOST:PORTthat points to your event hub, such as<namespace>.servicebus.windows.net:9093.<namespace>is the name of your Event Hubs Namespace, and it is specified when you create the namespace. Later it can be found in the Azure portal on the Event Hubs Namespace dashboard.<connection_string>- Event Hubs ConnectionString for authentication on Azure Cloud. To find or create a connection string for Event Hubs in Azure, follow these steps:- Navigate to your Event Hubs in the Azure portal.
- Under “Settings”, click on “Shared access policies” to see existing policies.
- Click on the “+” button to create a new shared access policy.
- Give your policy a name and select the appropriate permissions (at least “Listen”).
- Click “Create” to create the policy.
- Click on your newly created policy to view its properties.
- Under “Shared access keys”, you can view the primary and secondary connection strings for your policy.
- Copy the connection string that you want to use and use it in your code or configuration.
<event_hub_name>- Event Hub to consume, you can specify multiple.
windows
discovery.relabel "logs_integrations_integrations_azure_event_hubs" {
	targets = []

	rule {
		source_labels = ["__meta_kafka_topic"]
		target_label  = "topic"
	}
}

loki.source.azure_event_hubs "logs_integrations_integrations_azure_event_hubs" {
	fully_qualified_namespace = "<fully_qualified_namespace>"
	event_hubs                = ["<event_hub_name>"]

	authentication {
		mechanism         = "connection_string"
		connection_string = "<connection_string>"
	}
	use_incoming_timestamp = true
	relabel_rules          = discovery.relabel.logs_integrations_integrations_azure_event_hubs.rules
	labels                 = {
		job = "integrations/azure_event_hubs",
	}
	forward_to = [loki.write.grafana_cloud_loki.receiver]
}
To monitor your Azure Event Hubs, you will use a combination of the following components:
- discovery.relabel defines any relabeling needed before sending logs to Loki.
- loki.source.azure_event_hubs receives Azure Event Hubs messages by making use of an Apache Kafka endpoint on Event Hubs.
Find the placeholders and replace them with your values:
<fully_qualified_namespace>- Event hub namespace. Thefully_qualified_namespaceargument must refer to a fullHOST:PORTthat points to your event hub, such as<namespace>.servicebus.windows.net:9093.<namespace>is the name of your Event Hubs Namespace, and it is specified when you create the namespace. Later it can be found in the Azure portal on the Event Hubs Namespace dashboard.<connection_string>- Event Hubs ConnectionString for authentication on Azure Cloud. To find or create a connection string for Event Hubs in Azure, follow these steps:- Navigate to your Event Hubs in the Azure portal.
- Under “Settings”, click on “Shared access policies” to see existing policies.
- Click on the “+” button to create a new shared access policy.
- Give your policy a name and select the appropriate permissions (at least “Listen”).
- Click “Create” to create the policy.
- Click on your newly created policy to view its properties.
- Under “Shared access keys”, you can view the primary and secondary connection strings for your policy.
- Copy the connection string that you want to use and use it in your code or configuration.
<event_hub_name>- Event Hub to consume, you can specify multiple.
Grafana Agent static configuration (deprecated)
The following section shows configuration for running Grafana Agent in static mode which is deprecated. You should use Grafana Alloy for all new deployments.
Before you begin
The Azure Event Hubs integration is based on configuring the Grafana Agent to consume events from Azure Event Hub.
This integration uses Apache Kafka endpoint provided by Azure Event Hubs.
This endpoint is available for all Azure Event Hubs pricing plans except Basic. Pricing plans are described on the Microsoft website.
Example of how to set up Azure Event Hubs and send logs from Function App
This is an example of how to start Event Hubs and route the logs from the Function App.
Event Hubs
- Creating an Azure Event Hubs namespace with an enabled Kafka endpoint and creating a policy for listening using the Azure CLI:
Log in to your Azure account using the following command:Follow the instructions to complete the login process.
az login - List your available subscriptions by running the following command:This will show a list of your available subscriptions and their details.
az account list --output table - Select the subscription that you want to use by running the following command:Replace
az account set --subscription <subscription-id>with the ID of the subscription that you want to use. - Create an Azure Event Hubs namespace using the following command:Replace
az eventhubs namespace create --resource-group <resource-group-name> --name <namespace-name> --location <location> --sku <sku> --enable-kafka true, , , with your own values. The parameter should be set to either “Standard” or “Premium” if you want to enable Kafka. - Create an Event Hub within your namespace using the following command:Replace
az eventhubs eventhub create --resource-group <resource-group-name> --namespace-name <namespace-name> --name <eventhub-name>, , and with your own values. - Create a shared access policy for listening to events using the following command:Replace <rule_name>,
az eventhubs namespace authorization-rule create --name <rule_name> --resource-group <resource-group-name> --namespace-name <namespace-name> --rights Listen, , and with your own values. This command creates a policy with the “Listen” permission. - Get the connection string value for your Event Hub using the following command:Replace
az eventhubs namespace authorization-rule keys list --resource-group <resource-group-name> --namespace-name <namespace-name> --name <policy-name> --query primaryConnectionString --output tsv, , and with your own values. This command will output the connection string for your Event Hubs Namespace, which is needed to configure the integration to receive your logs. Note: Make sure to save the connection string value in a secure location, as it contains sensitive information and can be used to access all your event hubs within a namespace.
Configure diagnostic settings for Function App
To set up diagnostic settings for your Function App to send logs to an event hub, you need to follow these steps:
- Navigate to your Function App in the Azure portal.
- Under “Monitoring”, click on “Diagnostic settings”.
- Click on “+ Add diagnostic setting” to add a new diagnostic setting.
- Give your diagnostic setting a name.
- Under “Categories”, select the category of logs that you want to send to the event hub. For example, you may choose “Function Application Logs”.
- Under “Destination details”, select “Stream to an event hub” as the destination and choose the appropriate options.
- Configure any advanced settings if needed.
- Click “Save” to save your diagnostic setting.
- Once your diagnostic setting is saved, your Function App will start sending logs to the specified event hub.
Install Azure Event Hubs integration for Grafana Cloud
- In your Grafana Cloud stack, click Connections in the left-hand menu.
- Find Azure Event Hubs and click its tile to open the integration.
- Review the prerequisites in the Configuration Details tab and set up Grafana Agent to send Azure Event Hubs metrics and logs to your Grafana Cloud instance.
- Click Install to add this integration’s pre-built dashboard to your Grafana Cloud instance, and you can start monitoring your Azure Event Hubs setup.
Post-install configuration for the Azure Event Hubs integration
In the agent configuration file, find the placeholders and replace them with your values:
<fully_qualified_namespace>- Event hub namespace. Thefully_qualified_namespaceargument must refer to a fullHOST:PORTthat points to your event hub, such as<namespace>.servicebus.windows.net:9093.<namespace>is the name of your Event Hubs Namespace, and it is specified when you create the namespace. Later it can be found in the Azure portal on the Event Hubs Namespace dashboard.<connection_string>- Event Hubs ConnectionString for authentication on Azure Cloud. To find or create a connection string for Event Hubs in Azure, follow these steps:
- Navigate to your Event Hubs in the Azure portal.
- Under “Settings”, click on “Shared access policies” to see existing policies.
- Click on the “+” button to create a new shared access policy.
- Give your policy a name and select the appropriate permissions (at least “Listen”).
- Click “Create” to create the policy.
- Click on your newly created policy to view its properties.
- Under “Shared access keys”, you can view the primary and secondary connection strings for your policy.
- Copy the connection string that you want to use and use it in your code or configuration.
<event_hub_name>- Event Hub to consume, you can specify multiple.
Configuration snippets for Grafana Agent
Below logs.configs.scrape_configs, insert the following lines according to your environment.
    - azure_event_hubs:
        use_incoming_timestamp: true
        fully_qualified_namespace: '<fully_qualified_namespace>'
        connection_string: '<connection_string>'
        event_hubs:
          - '<event_hub_name>'
        labels:
          job: integrations/azure_event_hubs
      job_name: integrations/azure_event_hubs
      relabel_configs:
        - action: replace # `topic` label is used by the azure event hubs integration to filter values that belong to the particular event hub
          source_labels:
            - __meta_kafka_topic
          target_label: topic
Full example configuration for Grafana Agent
Refer to the following Grafana Agent configuration for a complete example that contains all the snippets used for the Azure Event Hubs integration. This example also includes metrics that are sent to monitor your Grafana Agent instance.
integrations:
  prometheus_remote_write:
  - basic_auth:
      password: <your_prom_pass>
      username: <your_prom_user>
    url: <your_prom_url>
  agent:
    enabled: true
    relabel_configs:
    - action: replace
      source_labels:
      - agent_hostname
      target_label: instance
    - action: replace
      target_label: job
      replacement: "integrations/agent-check"
    metric_relabel_configs:
    - action: keep
      regex: (prometheus_target_sync_length_seconds_sum|prometheus_target_scrapes_.*|prometheus_target_interval.*|prometheus_sd_discovered_targets|agent_build.*|agent_wal_samples_appended_total|process_start_time_seconds)
      source_labels:
      - __name__
  # Add here any snippet that belongs to the `integrations` section.
  # For a correct indentation, paste snippets copied from Grafana Cloud at the beginning of the line.
logs:
  configs:
  - clients:
    - basic_auth:
        password: <your_loki_pass>
        username: <your_loki_user>
      url: <your_loki_url>
    name: integrations
    positions:
      filename: /tmp/positions.yaml
    scrape_configs:
      # Add here any snippet that belongs to the `logs.configs.scrape_configs` section.
      # For a correct indentation, paste snippets copied from Grafana Cloud at the beginning of the line.
    - azure_event_hubs:
        use_incoming_timestamp: true
        fully_qualified_namespace: '<fully_qualified_namespace>'
        connection_string: '<connection_string>'
        event_hubs:
          - '<event_hub_name>'
        labels:
          job: integrations/azure_event_hubs
      job_name: integrations/azure_event_hubs
      relabel_configs:
        - action: replace # `topic` label is used by the azure event hubs integration to filter values that belong to the particular event hub
          source_labels:
            - __meta_kafka_topic
          target_label: topic
metrics:
  configs:
  - name: integrations
    remote_write:
    - basic_auth:
        password: <your_prom_pass>
        username: <your_prom_user>
      url: <your_prom_url>
    scrape_configs:
      # Add here any snippet that belongs to the `metrics.configs.scrape_configs` section.
      # For a correct indentation, paste snippets copied from Grafana Cloud at the beginning of the line.
  global:
    scrape_interval: 60s
  wal_directory: /tmp/grafana-agent-wal
Dashboards
The Azure Event Hubs integration installs the following dashboards in your Grafana Cloud instance to help monitor your system.
- Azure Event Hubs Overview
Overview
Changelog
# 0.0.2 - August 2023

* Add regex filter for logs datasource

# 0.0.1 - April 2023

* Initial Release
Cost
By connecting your Azure Event Hubs instance to Grafana Cloud, you might incur charges. To view information on the number of active series that your Grafana Cloud account uses for metrics included in each Cloud tier, see Active series and dpm usage and Cloud tier pricing.
Was this page helpful?
Related resources from Grafana Labs


