Amazon Relational Database Service
Monitor your RDS instances within AWS Observability, and troubleshoot common issues like CPU and memory provisioning.
Navigate to RDS dashboard
- To see RDS data, configure CloudWatch metrics and create your scrape job. You’ll see the job in the list of scrape jobs on the Configuration Details tab.
- To see the RDS dashboard, there are two methods to view it:
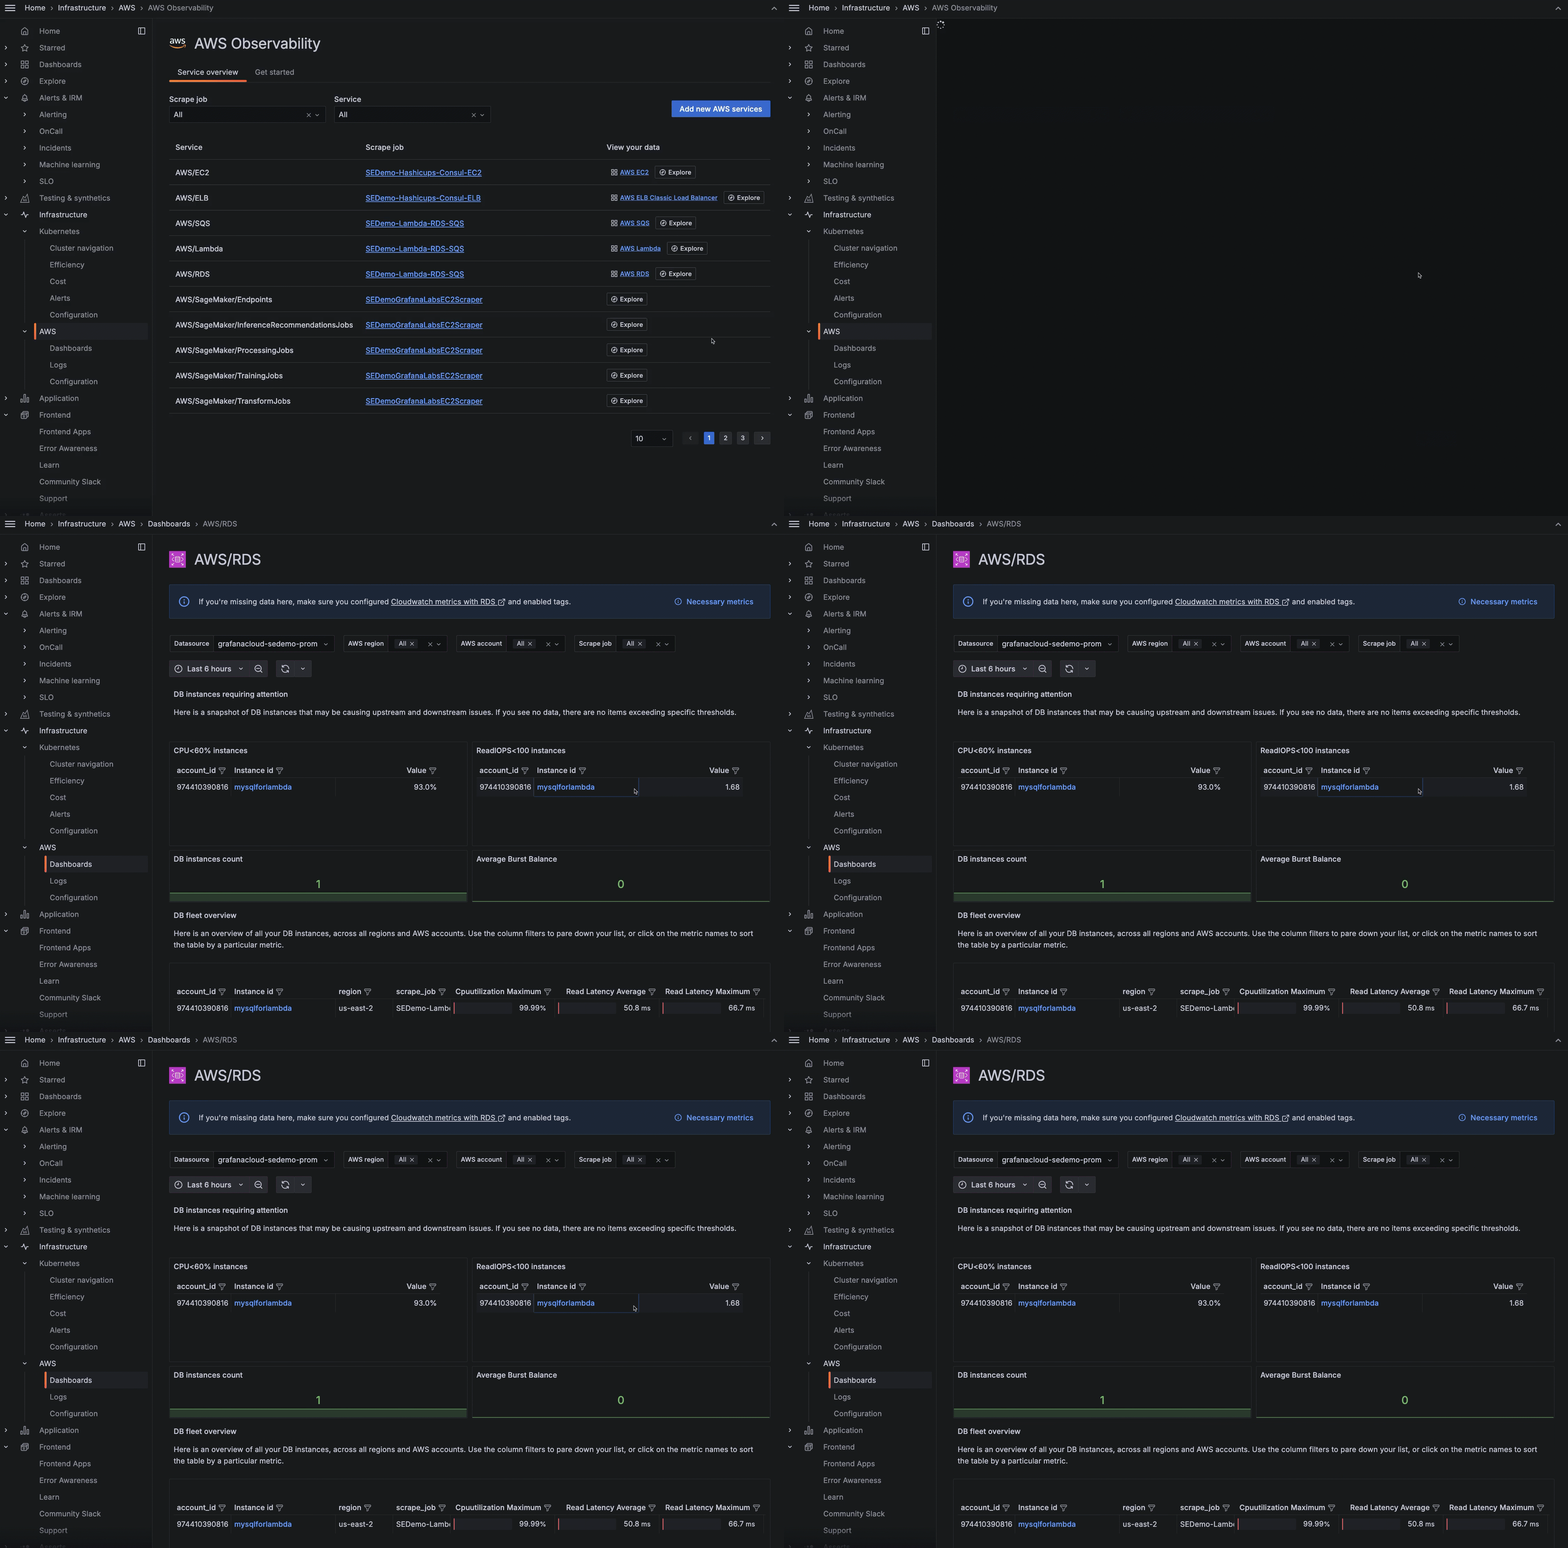
- In the main menu, click AWS to open the Service overview tab. Locate the RDS service in the list, and click AWS RDS in the last column of the table to open the RDS dashboard page in the Overview tab.
![Viewing RDS dashboard from the scrape jobs list Viewing RDS dashboard from the scrape jobs list]()
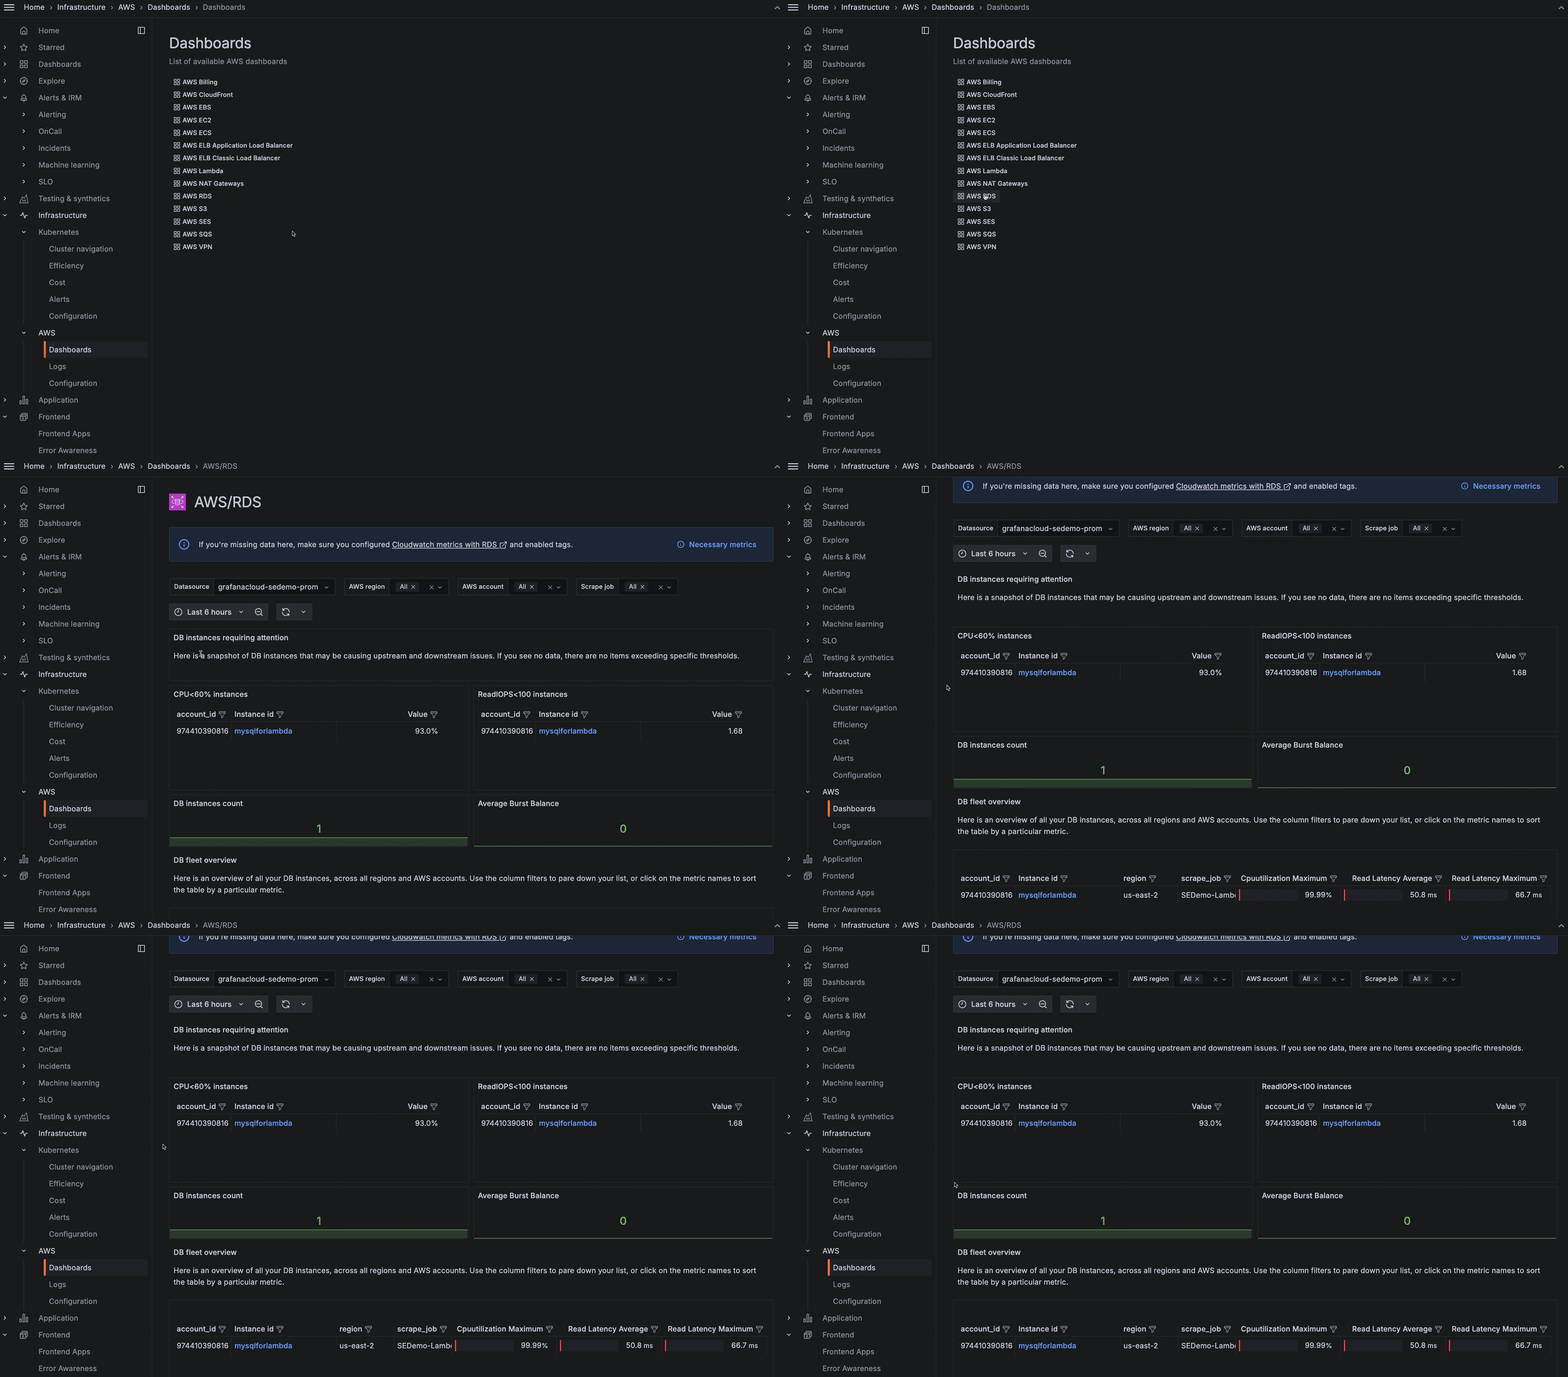
Viewing RDS dashboard from the scrape jobs list - On the main menu, click Dashboards, then click AWS RDS.
![Viewing RDS dashboard from dashboard list Viewing RDS dashboard from dashboard list]()
Viewing RDS dashboard from dashboard list
- In the main menu, click AWS to open the Service overview tab. Locate the RDS service in the list, and click AWS RDS in the last column of the table to open the RDS dashboard page in the Overview tab.
Analyze RDS instances
At the AWS/RDS page, you can:
- Change the time range selector
- Filter by region, account, and scrape job
- Sort and filter any column for these metrics in the list of instances:
- CPU utilization maximum
- Read and write latency average
- Read IOPS and Write IOPS average
- Swap usage average
- Aurora replica lag average
- Filter the list of instances by clicking the instance counts for CPU<60% and ReadIOPS<100.
- Click an instance in the list to view graphs for that instance.
![Viewing the graphs for an instance Viewing the graphs for an instance]()
Viewing the graphs for an instance


