
Configure Logs with Firehose
Logs with Firehose leverages Amazon Kinesis Data Firehose and a minimal infrastructure to deliver logs to the ingestion pipeline within Grafana Cloud.
Note
Logs with Firehose is currently in public preview. Grafana Labs offers limited support, and breaking changes might occur prior to the feature being made generally available.
Before you begin
You need the following information to complete configuration successfully:
- Target endpoint URL: The correct endpoint for your Grafana Cloud instance
- Loki User: The numeric value of the User
To obtain these items, perform the following steps.
- Navigate to your Grafana Cloud portal.
- Select your Grafana Cloud stack.
- Locate the Loki tile, and click Details.
![]()
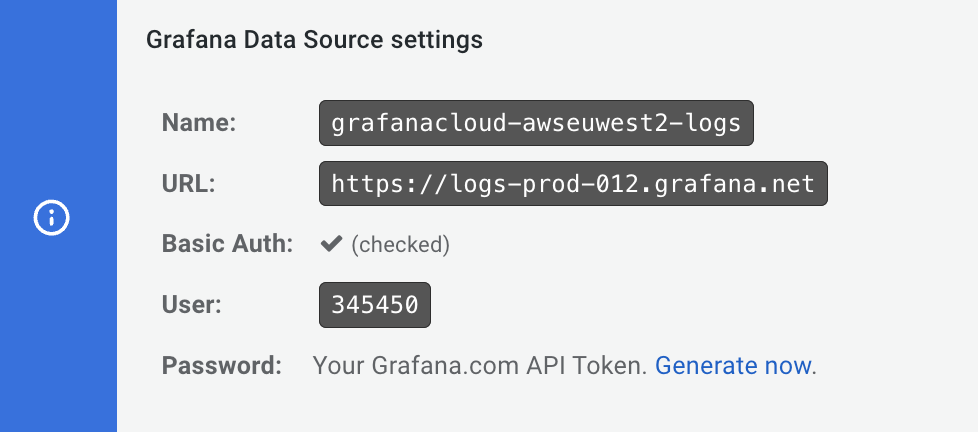
- Copy and save the values in the URL field (which is the target endpoint) and in the User field for use in future steps.
![]()
Set up required authentication
When Grafana Cloud receives logs from AWS, the access policy and its associated authentication token enables Grafana to:
- Authenticate the request.
- Determine which customer the data is coming from so Grafana can store it appropriately in Loki.
Complete the following to create an access policy:
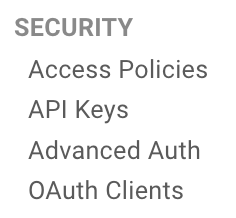
- At your Grafana Cloud stack, from the main menu under SECURITY, click Access Policies.
![]()
- Click Create access policy.
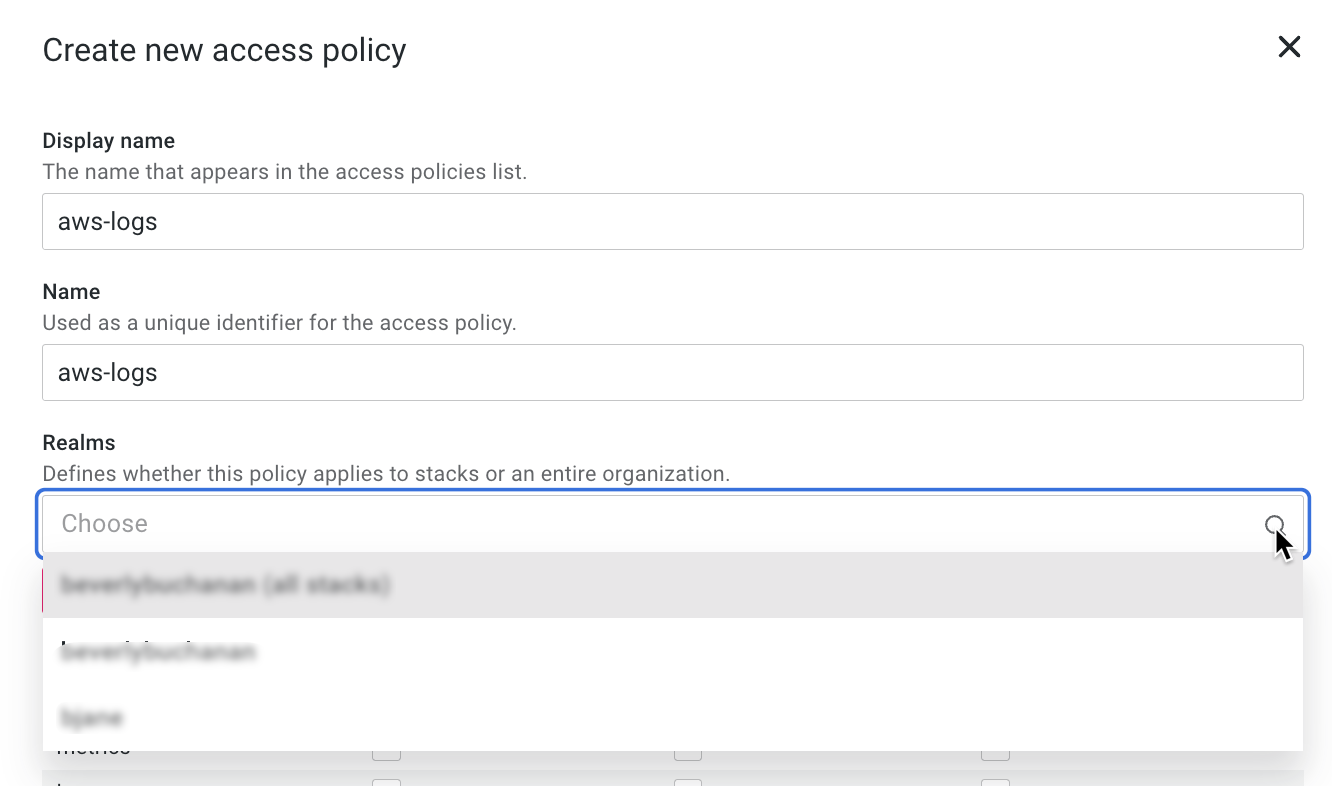
- In the Display name box, create a display name to appear in the access policies list.
![]()
- In the Realms box, select the first option, “your_org_name (all stacks)”.
- In the Scopes section, for logs select Write to allow logs to write to your account.
![]()
- Click Create to create the access policy.
- In the access policy you just created, click Add token to create a token for Kinesis Data Firehose.
![]()
- Enter a name for the token, and click Create.
- Click Copy to clipboard and save the new token. In a future step, you replace LOGS_WRITE_TOKEN with this token.


Set up on AWS account
You must create some infrastructure in your AWS account for sending the logs to Grafana Cloud:
- Authentication components
- A component to route logs into the delivery stream
- The Kinesis Data Firehose delivery stream

You can accomplish this with Terraform or CloudFormation.
Set up with Terraform
Download the Terraform snippet file.
Open the snippet file, and complete the sections labeled with
FILLMEas shown in the following example:provider "aws" { // FILLME: AWS region region = "us-east-2" // FILLME: local AWS profile to use profile = "test-profile" }Run
terraform apply, including the required variables as shown in the following example:terraform apply \ -var="fallback_bucket_name=<Name for an s3 bucket, to save data in case of failures>" \ -var="firehose_stream_name=<Kinesis stream name>" \ -var="target_endpoint=<Target AWS Logs endpoint provided by Grafana>" \ -var="logs_instance_id=<Loki User>" \ -var="logs_wfallback_bucket_name: The name of an S3 bucket where logs can be stored in case the delivery failsfirehose_stream_name: Enter a meaningful name for the Kinesis Data Firehose streamtarget_endpoint: The target endpoint URL for your Grafana Cloud instance. Add the prefixaws-. For example, if your Loki URL ishttps://logs-prod3.grafana.net, then your Logs with Firehose URL will behttps://aws-logs-prod3.grafana.net/aws-logs/api/v1/push.logs_instance_id: The numeric value for User field of the Loki data sourcelogs_write_token: The token you created for Kinesis Data Firehose
Set up with CloudFormation
Download the CloudFormation snippet file.
Run the following
aws cloudformation create-stack, including the required variables:aws cloudformation create-stack --stack-name grafana-aws-logs-firehose --template-body file://./aws-logs-firehose.yaml --capabilities CAPABILITY_NAMED_IAM \ --parameters \ ParameterKey=FallbackS3BucketName,ParameterValue=aws-logs-fallback \ ParameterKey=FirehoseStreamName,ParameterValue=grafana-aws-logs \ ParameterKey=TargetEndpoint,ParameterValue=TARGET_ENDPOINT \ ParameterKey=LogsInstanceID,ParameterValue=LOKI_USER \ ParameterKey=LogsWriteToken,ParameterValue=LOGS_WRITE_TOKENFallbackS3BucketName: The name of an S3 bucket where logs can be stored in case the delivery failsFirehoseStreamName: Enter a meaningful name for the Kinesis Data Firehose streamTargetEndpoint: The target endpoint URL for your Grafana Cloud instance. Add the prefixaws-. For example, if your Loki URL ishttps://logs-prod3.grafana.net, then your Logs with Firehose URL will behttps://aws-logs-prod3.grafana.net/aws-logs/api/v1/push.LogsInstanceID: The numeric value for User field of the Loki data sourceLogsWriteToken: The token you created for Kinesis Data Firehose
Set up CloudWatch subscription filter
The CloudWatch subscription filter:
- Reads logs from a select CloudWatch log group.
- Optionally filters the logs.
- Sends the logs to the Kinesis Data Firehose stream.
Configure with AWS CLI
Use the following example to create a subscription filter with the AWS CLI:
aws logs put-subscription-filter \
  --log-group-name "<log group name to send logs from>" \
  --filter-name "<Name of the subscription filters>" \
  --filter-pattern "<Optional filter expression>" \
  --destination-arn "<ARN of the Kinesis firehose stream created above>" \
  --role-arn "<ARN of the IAM role created for sending logs above>"
Configure with Terraform
Use the following example to configure with Terraform, and include the required variables:
resource "aws_cloudwatch_log_subscription_filter" "filter" {
  name            = "filter_name"
  role_arn        = aws_iam_role.logs.arn
  log_group_name  = "/aws/lambda/example_lambda_name"
  filter_pattern  = "" // Optional: Filter expression
  destination_arn = aws_kinesis_firehose_delivery_stream.main.arn
  distribution    = "ByLogStream"
}name: Enter a meaningful name for the ARNrole_arn: ARN of the IAM role created in previous step for sending logslog_group_name: The log group where the logs should be sent fromfilter_pattern: An optional filter expressiondestination_arn: Using ARN of Firehose delivery stream created in previous snippet
Configure with CloudFormation
Use the following example to configure with CloudFormation, and include the required variables:
SubscriptionFilter:
  Type: AWS::Logs::SubscriptionFilter
  Properties:
    DestinationArn: "<Firehose delivery stream ARN>"
    FilterPattern: ""
    LogGroupName: "/aws/lambda/test-lambda"
RoleArn: "<IAM Role for sending logs ARN, created in the steps above>"FilterPattern: An optional filter expressionLogGroupName: The log group the logs should be sent fromDestinationArn: ARN of the Kinesis Data Firehose delivery stream, created in the previous stepsRoleArn: ARN of the IAM role for sending logs, created in the previous steps
Next steps
To verify that AWS is sending logs to your Grafana instance, log in to your instance and use query this LogQL query:
{job="cloud/aws"}Was this page helpful?
Related resources from Grafana Labs


