Preconfigured dashboards
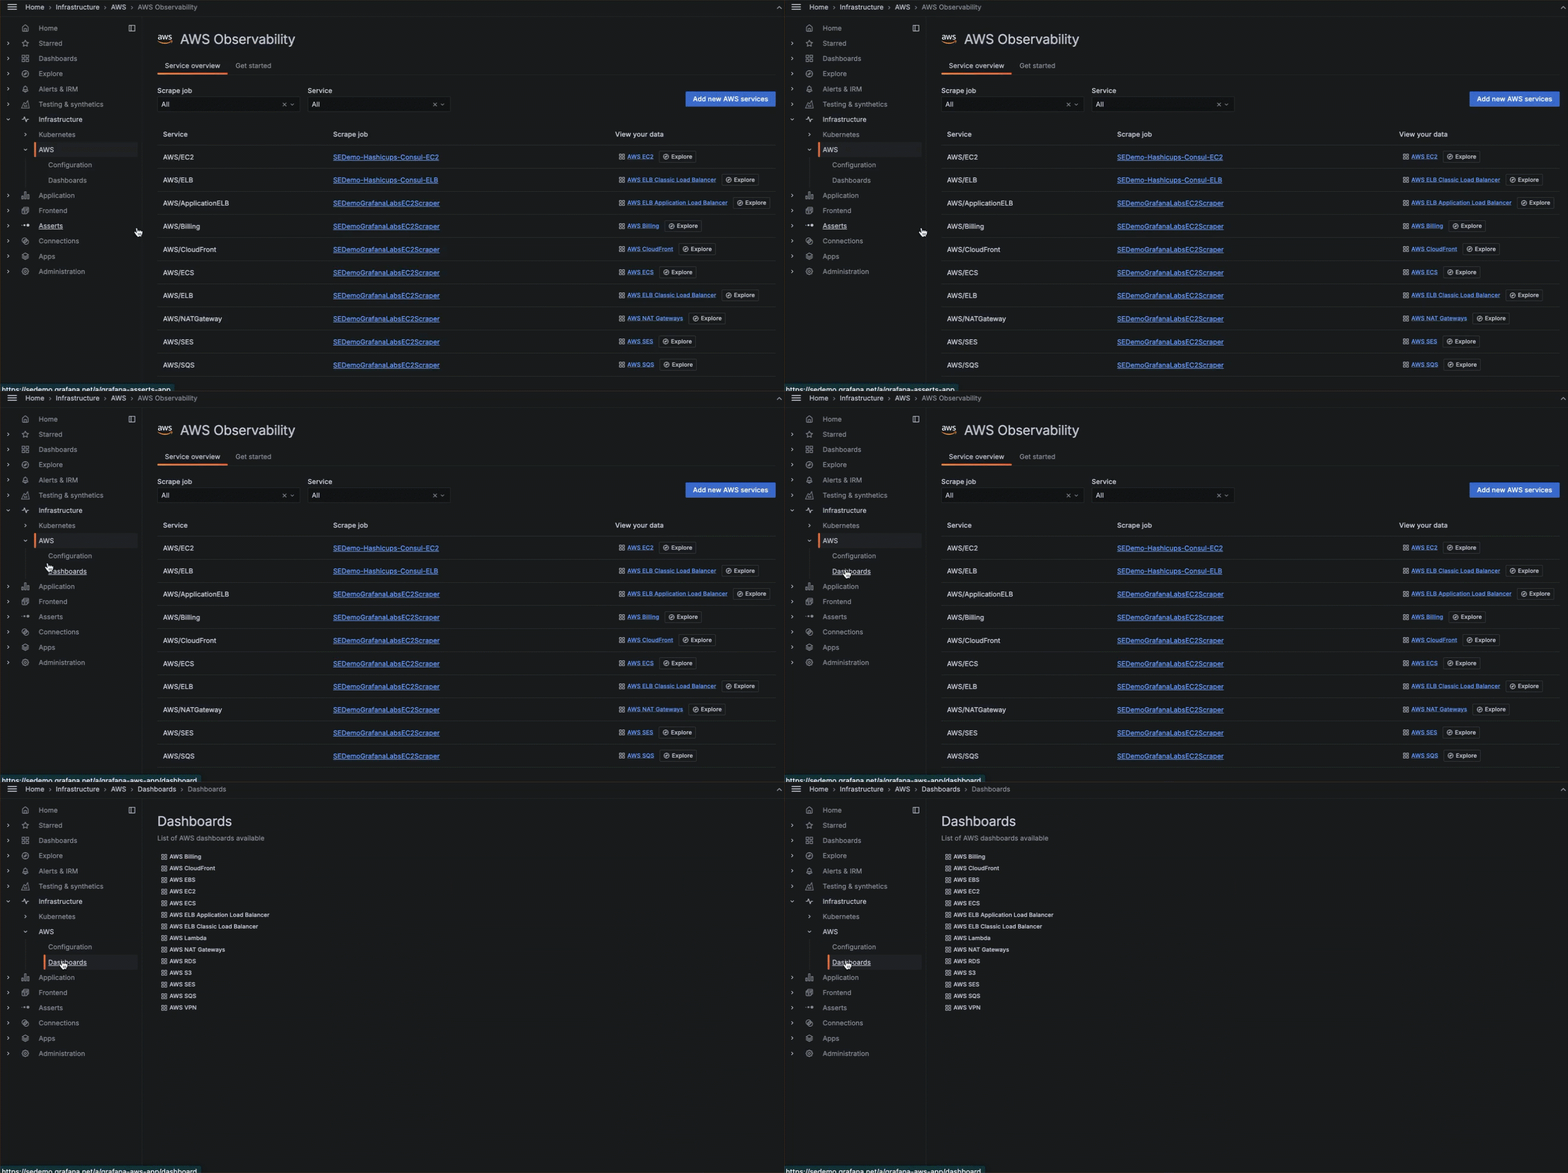
CloudWatch metrics installs the following preconfigured dashboards in your Grafana Cloud instance. These dashboards are embedded in and accessible in the AWS Observability app.
AWS Billing dashboard
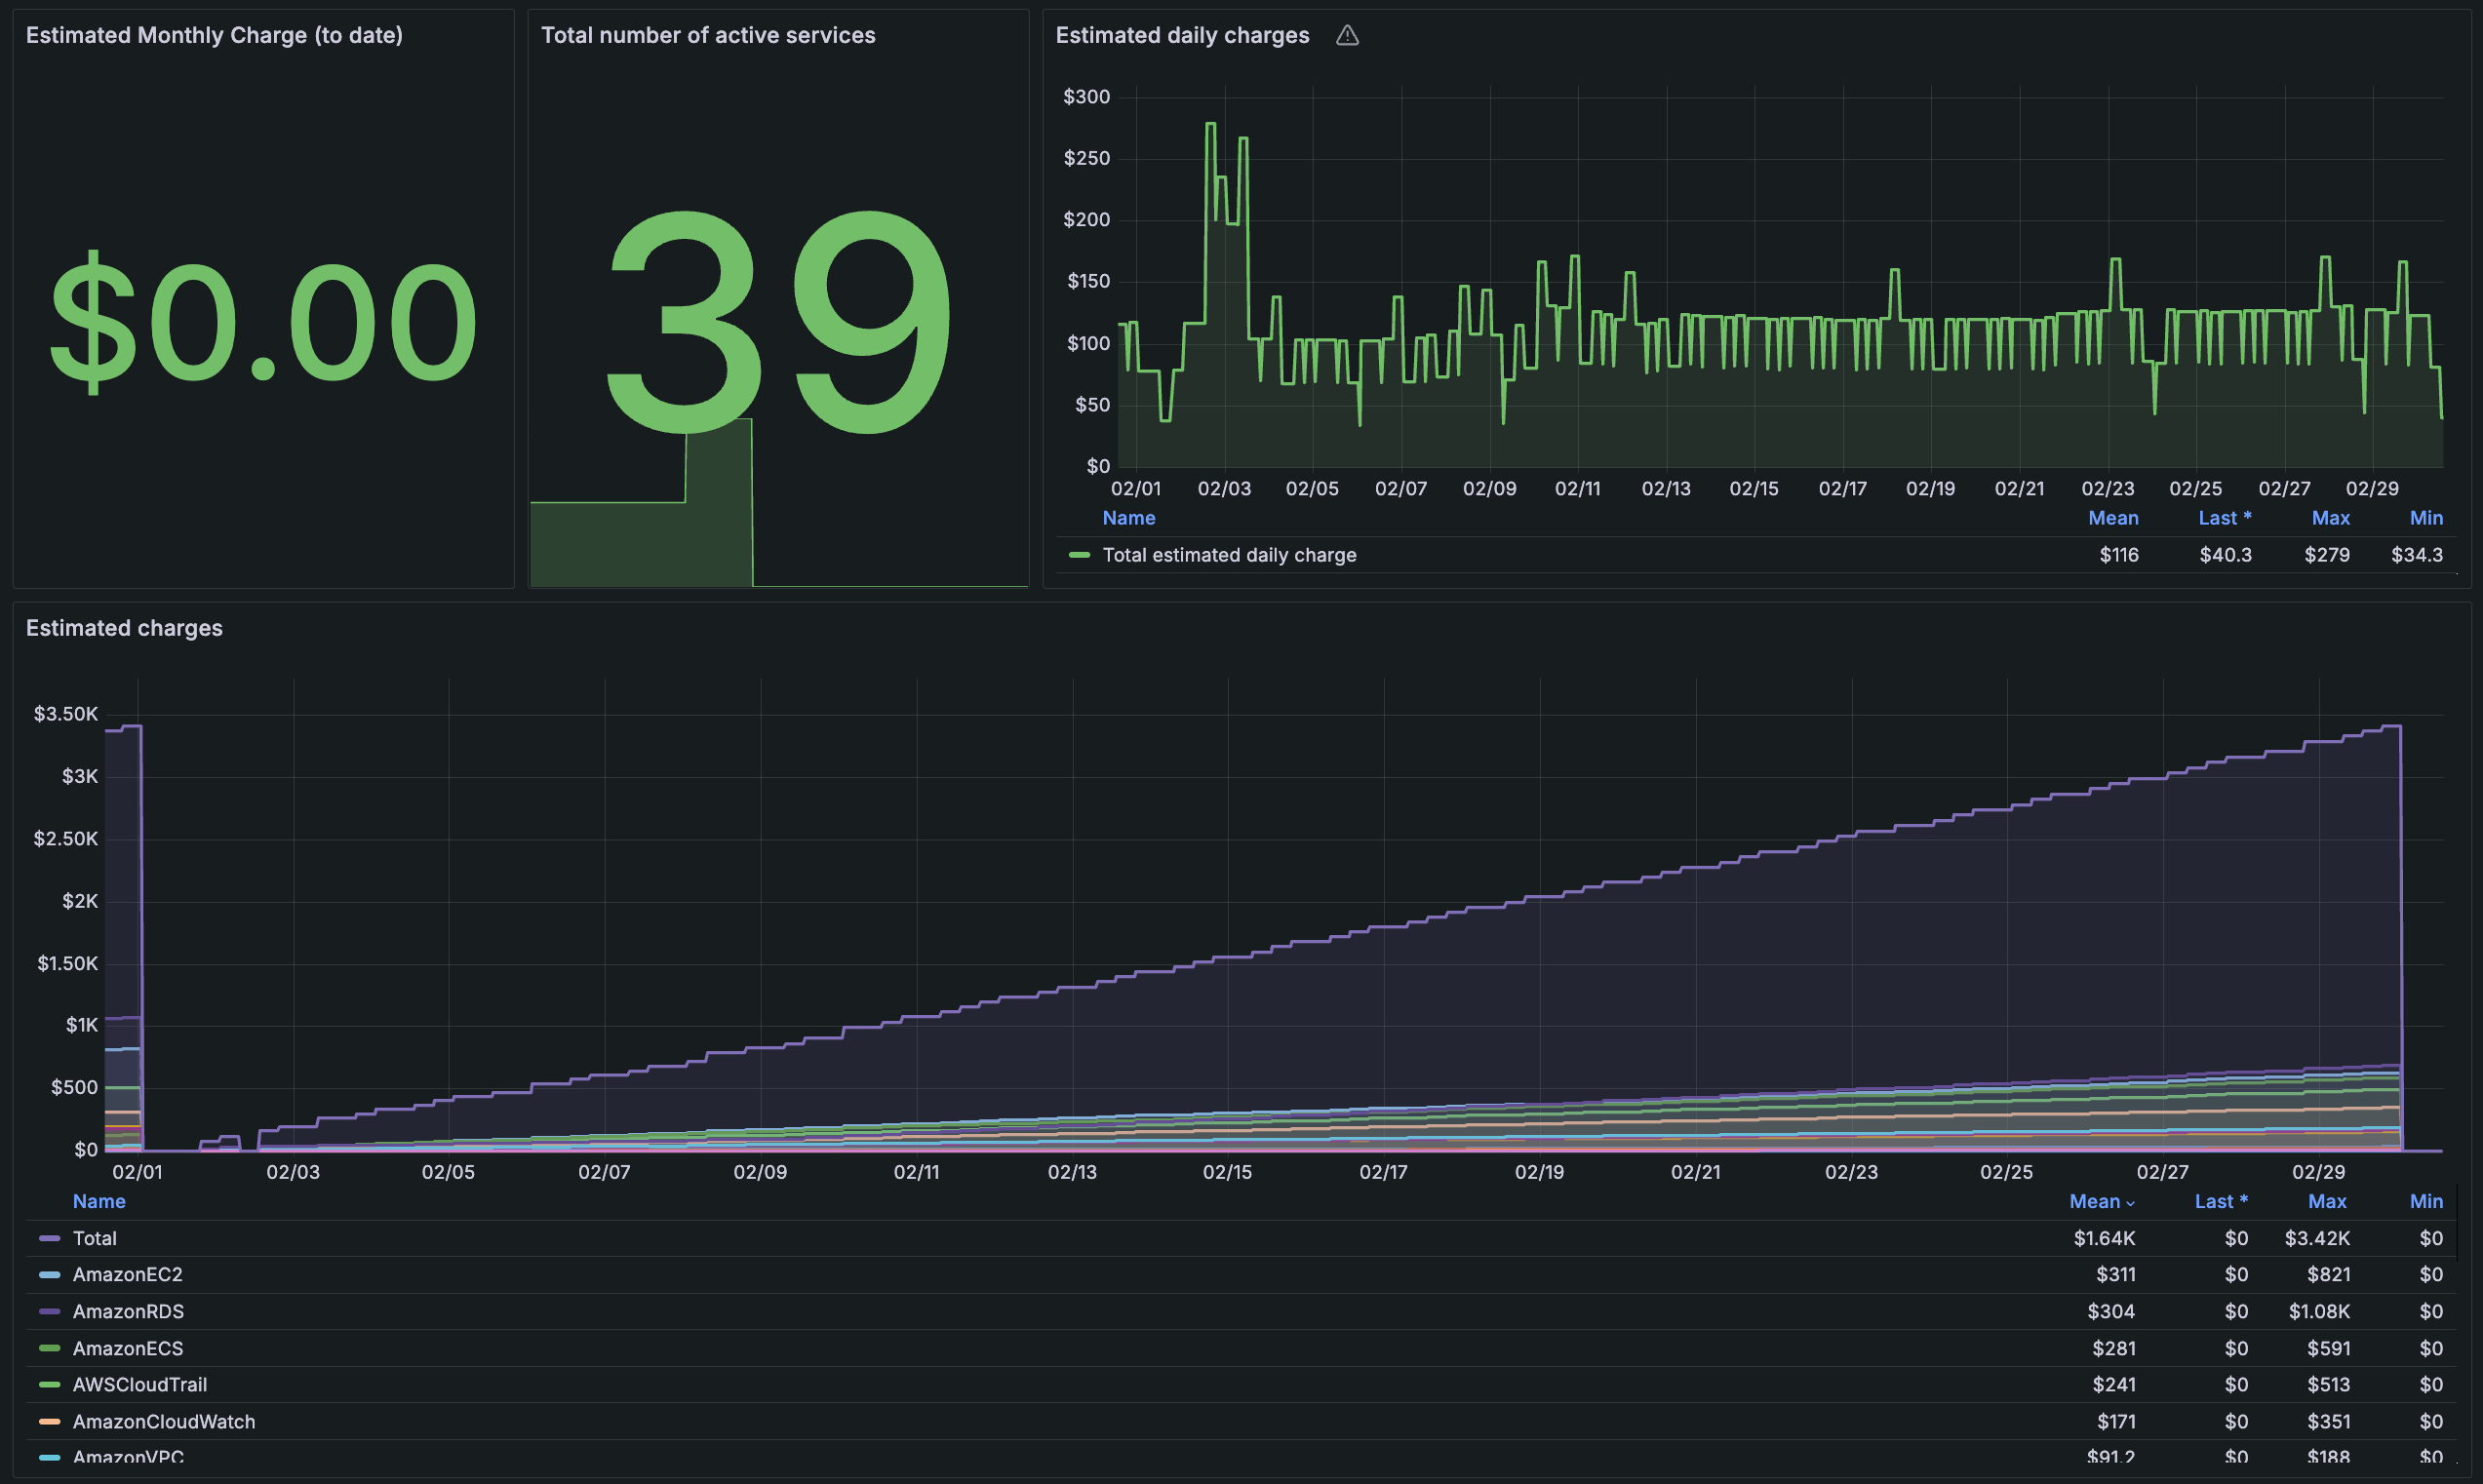
The Billing dashboard shows estimated charges for AWS resources, including estimated monthly charge, total number of active services, and estimated daily charges.
AWS CloudFront
The CloudFront dashboard shows metrics, including requests compared to total error rate, 4xx error rate compared to 5xx error rate, and bytes downloaded compared to bytes uploaded.
AWS EBS
The EBS dashboard shows metrics that include volume queue length and volume throughput percentage to help you understand throughput and bandwidth.
AWS EC2
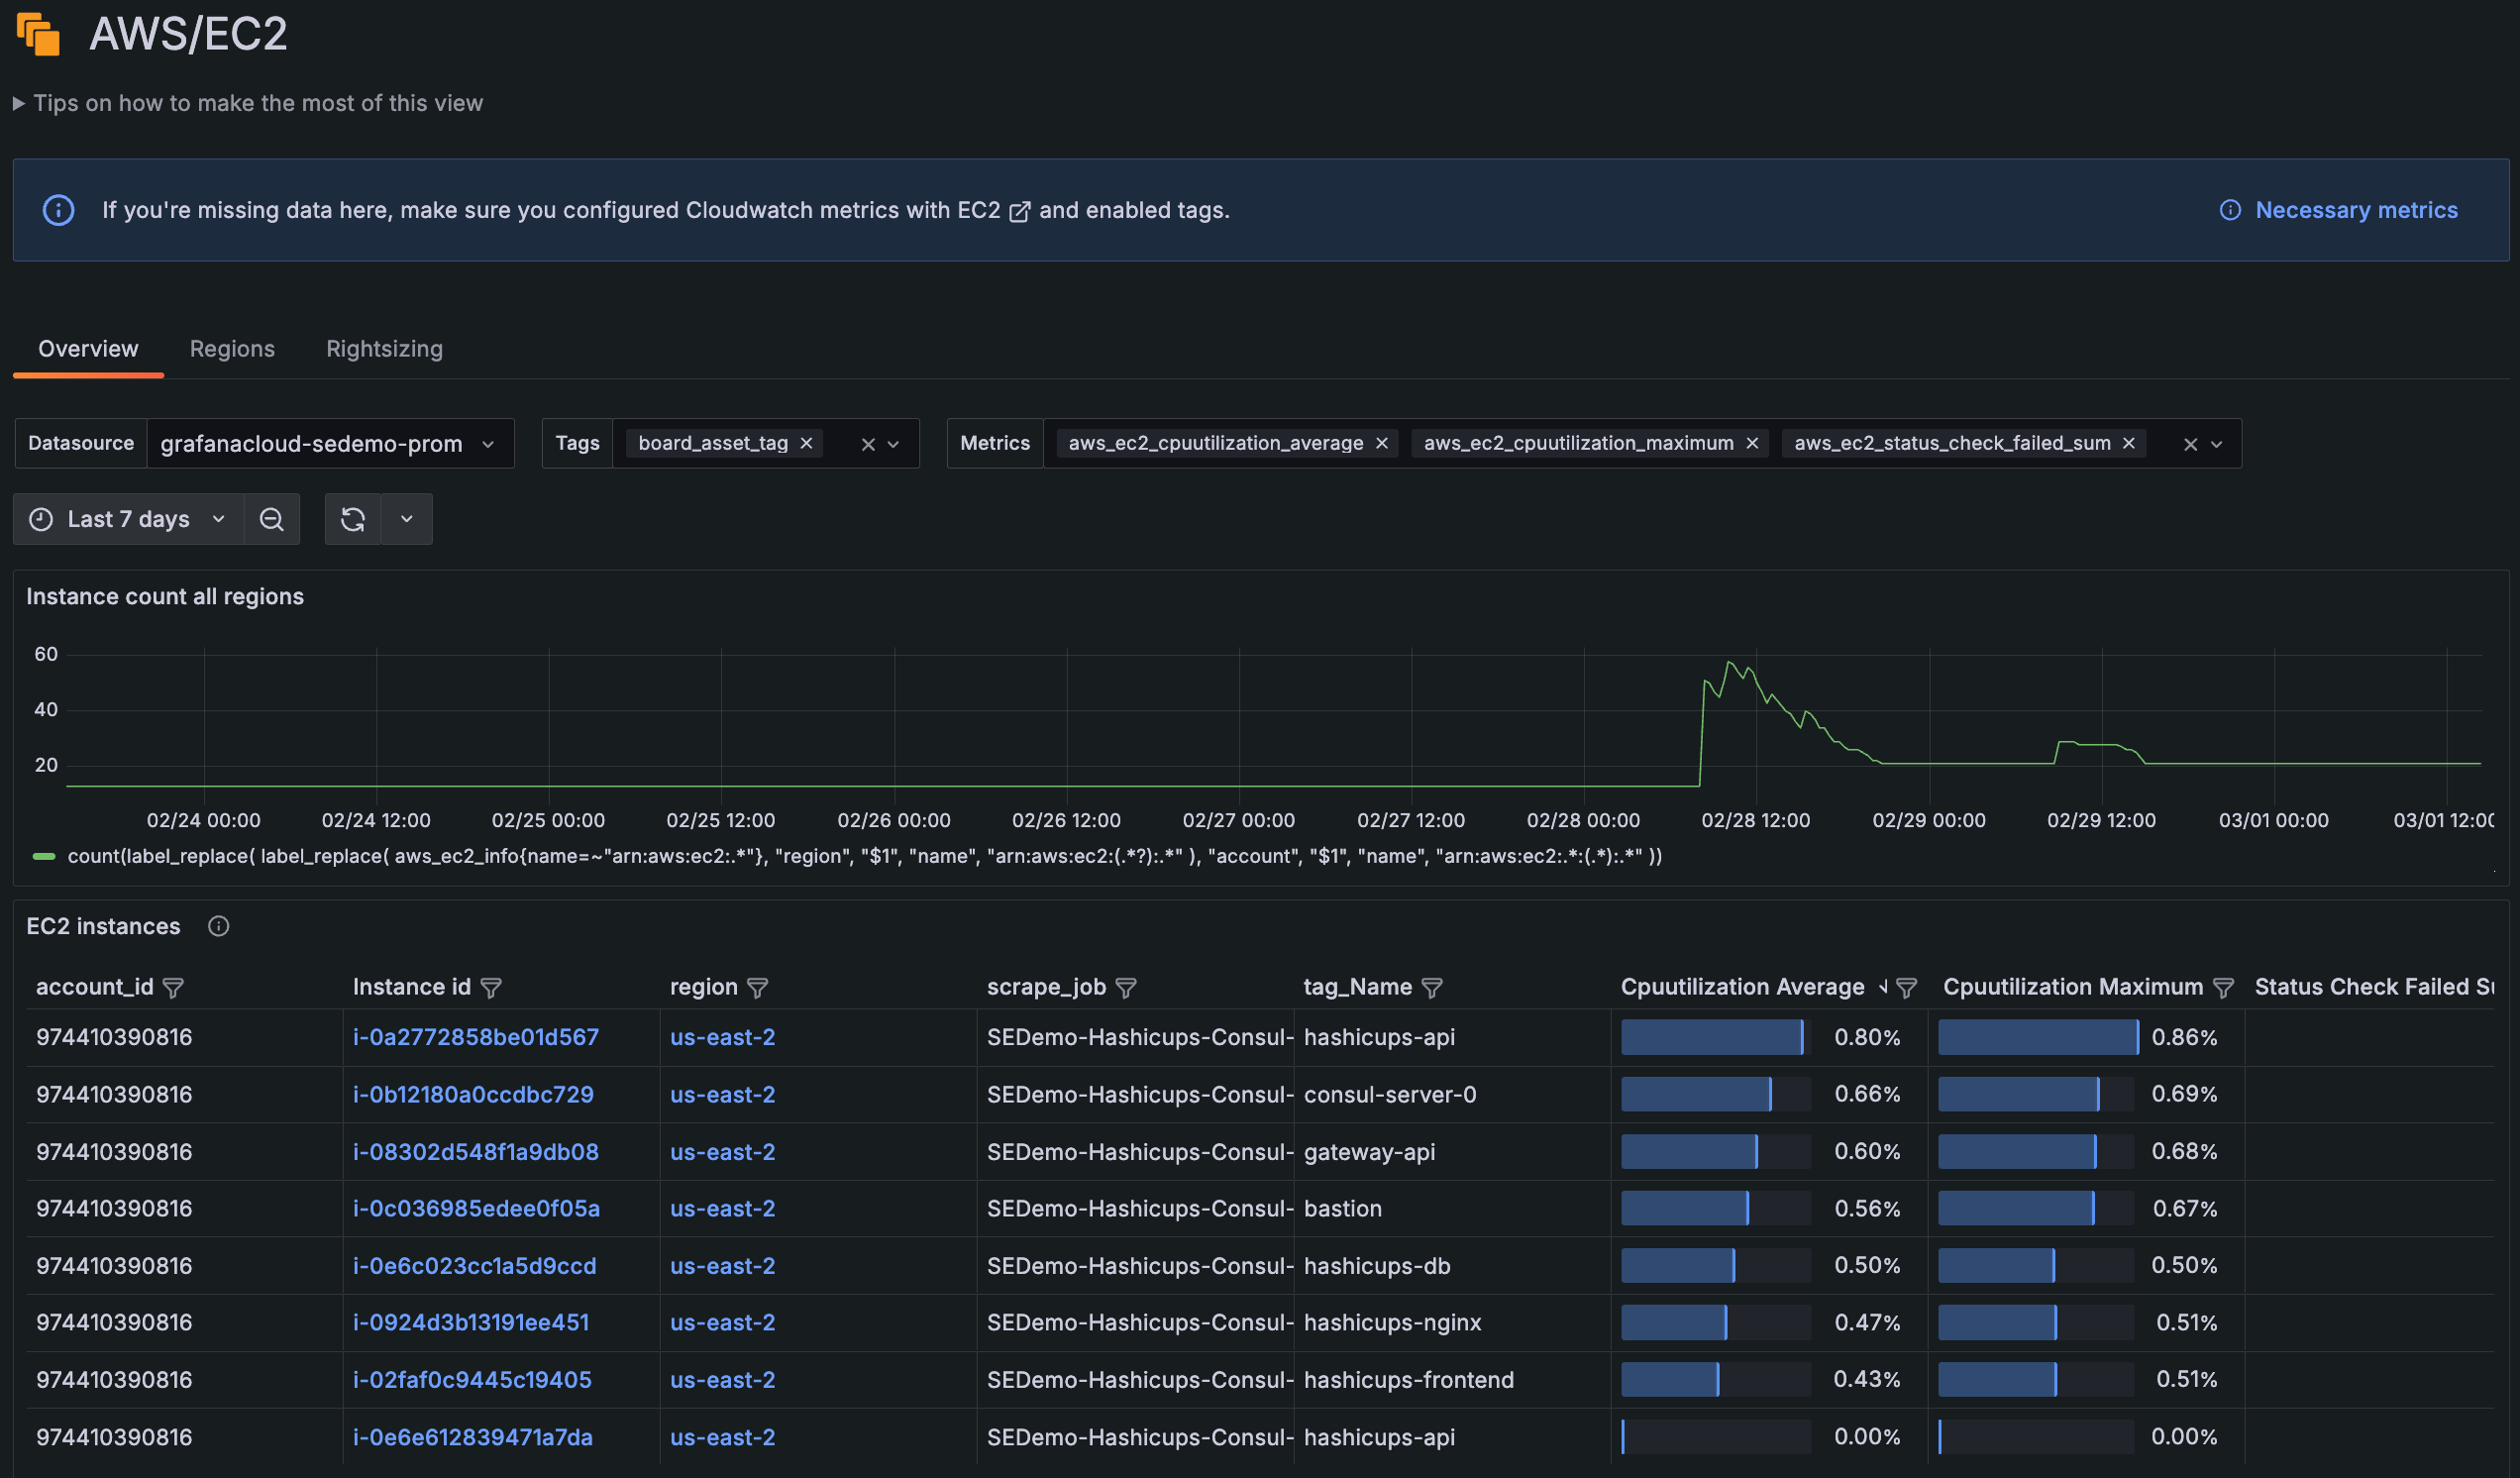
The EC2 dashboard shows EC2 instances and key indicators, such as CPU utilization, network traffic, disk performance, and system checks. You can filter the dashboard by data source, tags, and metrics.
AWS ECS
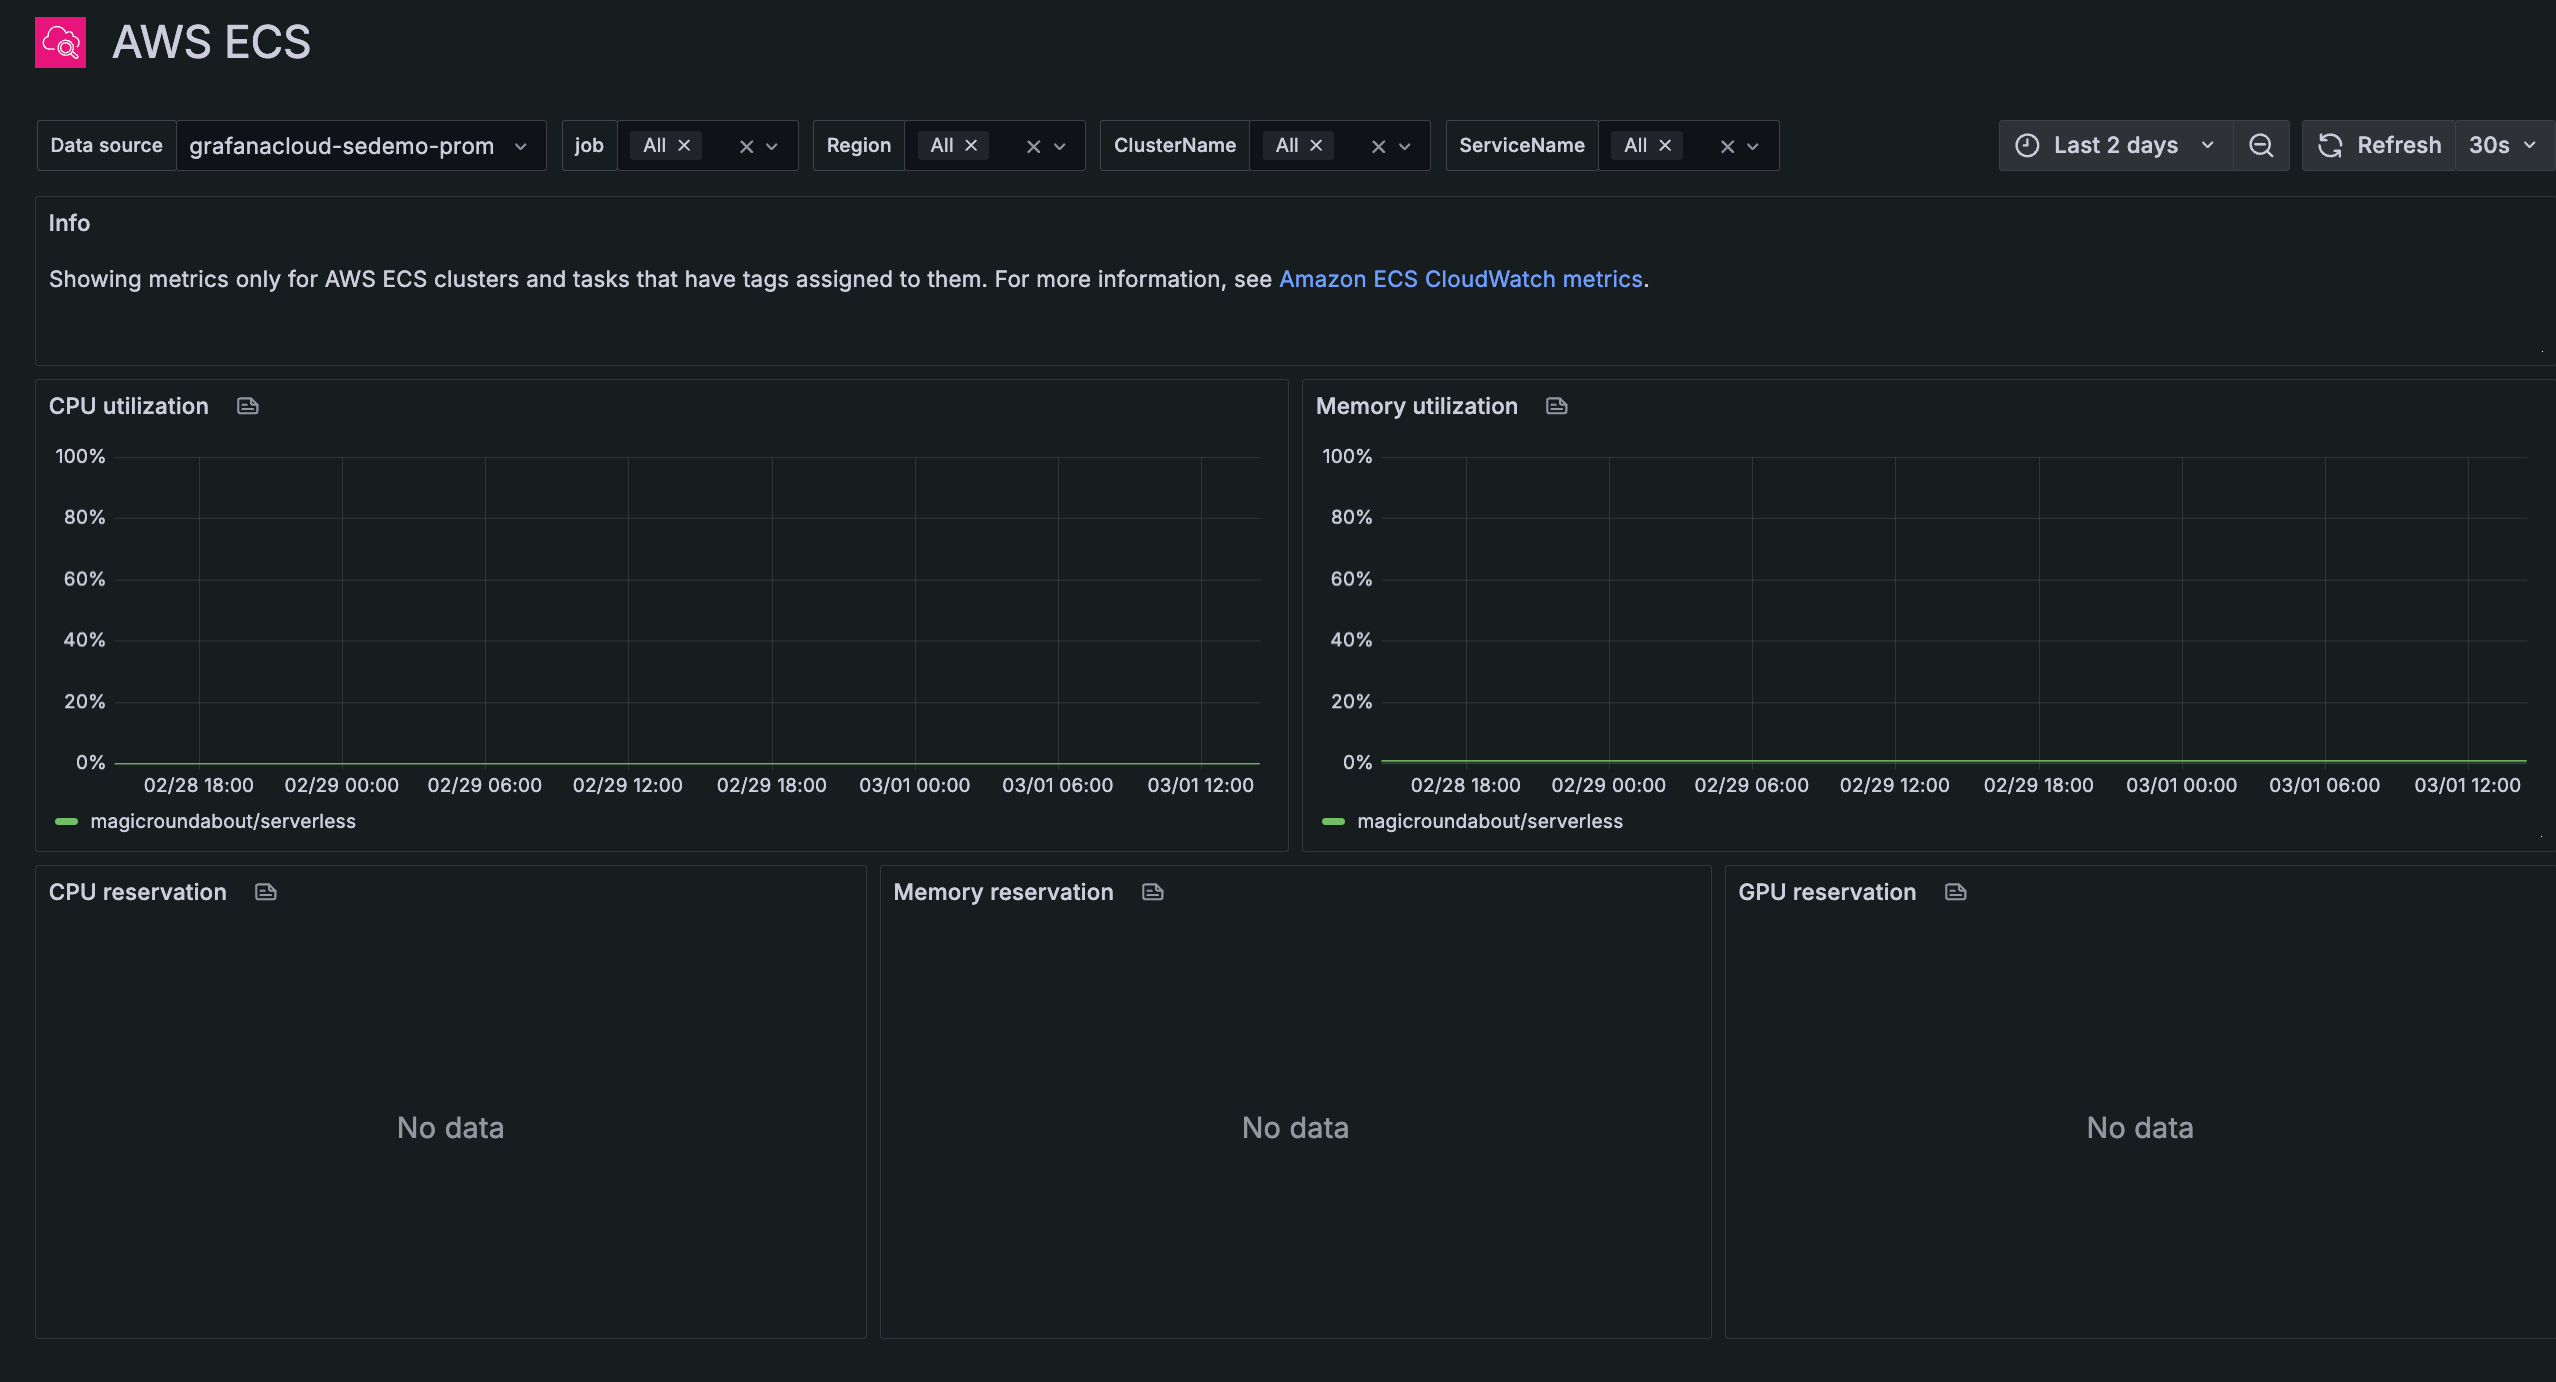
The ECS dashboard shows CPU and memory utilization, and reservation statistics for CPU, memory, and GPU for ECS.
AWS ELB Application Load Balancer
The ELB dashboard shows metrics for ELB Application Load Balancer, including request count compared to target response time, HTTP code target, HTTP code ELB, connection count, consumed LCUs compared to processed bytes, TLS negotiation error count, IPv6, rule evaluations, and auth.
AWS ELB Classic Load Balancer
This dashboard provides metrics for Classic Load Balancers.
AWS Lambda
The Lambda dashboard shows key RED metrics, including invocations, errors, and duration of requests for a Lambda function.
AWS NAT Gateways
This dashboard shows metrics for AWS NAT Gateways, including health, connections, bytes, and packets.
AWS RDS
The RDS dashboard shows metrics that include CPU utilization, database connection count, disk throughput, IOPS, and availability.
AWS S3
This dashboard allows you to monitor your S3 object buckets and keep track of their size, volume of data, and number of objects. You also have access to view request metrics, such as latency and error rate.
AWS SES
The SES dashboard shows metrics for SES event data, including send/delivery, bounce/reject, and complaint.
AWS SQS
This dashboard shows metrics for SES, including total messages, approximate age of oldest message, approximate number of messages, number of empty receives, and sent message size.
AWS VPN
The VPN dashboard shows metrics for VPN tunnels that are monitored with CloudWatch, including health and data.


