CloudWatch metrics
Ingest your AWS CloudWatch metrics from multiple AWS regions into Grafana Cloud, stored in Prometheus format.
When you configure a CloudWatch metrics scrape or stream job in Grafana Cloud, you can do the following:
- Push or pull CloudWatch metrics from multiple regions, without installing Grafana Alloy.
- Create multiple scrape or stream jobs to separate data. A scrape or stream job is a set of configurations that dictate which services, regions, and AWS account to collect data from.
- Ingest the tags from your AWS instance to make them available for querying and alerting. This allows you to identify what a particular resource is, without visiting your AWS Management Console.
- Query and alert on metrics data using the Prometheus query language (PromQL).
- Use out-of-the-box dashboards for different services, so you don’t need to build them.
Included services
You can use Grafana Cloud to connect over 60 of the most popular AWS services, including EC2, Lambda, EBS, RDS, S3, ECS, ELB, and Billing. Refer to Services for a complete list of supported services.
CloudWatch data access
When you create a metric scrape job or resource metadata scrape job for a metric stream, Grafana needs access to the CloudWatch data available in your account. CloudWatch metrics uses AWS account delegation to grant this access. Grafana can then assume a role that has access only to your CloudWatch data, with no need to share access and secret keys.
Enhanced metrics
Enhanced metrics are an optional set of additional metrics available for select AWS services that go beyond the metrics available through CloudWatch. While scrape jobs collect default metrics directly from the CloudWatch API, enhanced metrics collection calls service-specific AWS APIs to retrieve resource configuration and metadata that CloudWatch doesn’t expose. Some examples of enhanced metrics would include a Lambda function’s timeout configuration, an RDS instance’s allocated storage, or the number of nodes in an ElastiCache cluster.
Because collecting enhanced metrics depends on access to AWS service APIs beyond CloudWatch, they require additional IAM permissions in your AWS account.
All enhanced metrics require the iam:SimulatePrincipalPolicy permission.
Additionally, each supported service has specific permission requirements, for instance, lambda:ListFunctions for Lambda, rds:DescribeDBInstances for RDS, and elasticache:DescribeCacheClusters for ElastiCache.
When you configure a Grafana Cloud Provider AWS scrape job and select enhanced metrics, Grafana Cloud validates that the required permissions are present before creating the job.
If permissions are missing, you receive an error indicating which IAM permissions you should add to your AWS role or policy.
Enhanced metrics are opt-in and configured per job alongside your standard CloudWatch metric selections.
Tags
Tags are labels you attach to cloud resources that say what they are, who owns them, and what they are for.
Some common examples include env=prod, team=payments, cost-center=1234, and app=checkout.
Grafana uses AWS resource tags as the discovery and scoping mechanism for a scrape job.
Tags tell the scraper which resources to target, how to label them, and who owns them.
Scrape jobs require AWS resources to be tagged so that users can control exactly what is scraped, avoiding accidentally ingesting huge numbers of metrics.
Raw CloudWatch service metrics do not include AWS resource tags, so Grafana scrapes tags separately and attaches them to aws_<service>_info metrics.
Users also have the option to copy specific tags to service metrics. Service metrics with selected tags are helpful for direct querying, alerts, and dashboards where label presence simplifies queries. Adding specific tags to service metrics allows you to filter, group, and alert directly on metrics without doing a join. Best practice for tags is to only copy a few commonly used, low-cardinality tags onto service metrics for faster dashboards and alerts.
Timestamps in Grafana Cloud and CloudWatch metrics
CloudWatch metrics scrape jobs and streams set the timestamp of metrics to the time of pulling, instead of the time as reported by the metric in CloudWatch. This setting might seem counterintuitive, but its intent is to simplify the writing of alert queries. The timestamps from CloudWatch metrics always appear more delayed than they actually are.
As an example, assume you are looking at a single metric, CPU Maximum, pulled every five minutes. This leads to CloudWatch metrics pulling data with a CloudWatch period of five minutes.
CloudWatch timestamps mark the beginning of a period, not the end.
CloudWatch samples are visible at the beginning of a period and aggregated through the period window.
CloudWatch metrics pulls on a consistent interval, and only requests data which has been fully aggregated.
This results in a Grafana Cloud timestamp of 0:08 for a metric CloudWatch stamped at 0:00.
If the CloudWatch timestamp was used instead:
- Metrics would appear to be eight minutes old when ingested.
- Any alert queries written would need to consider this extra variable delay.
The pull timestamp gives the appearance of an eight-minute delay. But actually, only three minutes have passed since the value stopped being updated.
Methods for ingesting CloudWatch metrics
You can ingest AWS CloudWatch metrics into Grafana Cloud using one of the following options:
- CloudWatch metric streams: Push metrics with CloudWatch metric streams using Amazon Data Firehose, providing real-time insights and scalability while simplifying configuration and reducing manual effort.
- CloudWatch metrics scrape Pull CloudWatch metrics from multiple regions for your AWS account, with or without installing Grafana Alloy.
Note
This documentation is for using Cloud Provider Observability to monitor your AWS accounts, which doesn’t require you to install Grafana Alloy. However, if you want more control over the exporter configuration or need to store your data on-premesis, you can use the Grafana Alloy integration to run Alloy on your own infrastructure to monitor AWS.
CloudWatch metric streams
CloudWatch metric streams push CloudWatch metrics using Amazon Data Firehose, and provide real-time insights and scalability while simplifying configuration and reducing manual effort.
After you configure CloudWatch metric streams with Grafana Cloud, a CloudWatch metric stream regularly batches metrics for your resources, conforming to the supplied include and exclude filters, and pushes them to Grafana Cloud using a Data Firehose.
The Data Firehose that delivers your metrics to the configured Grafana Cloud endpoint for CloudWatch metrics streaming ingest, also backs up data that failed to send to an S3 object storage service.
Note
The AWS metric stream must emit metrics in OpenTelemetry 1.0 format and not JSON to be compatible with the Grafana ingest service.
AWS resource metadata scrape job
Metrics pushed to Grafana Cloud by metrics stream only contain region and dimensions as labels. To enrich your metrics with additional metadata as labels, such as the associated resource’s ARN and resource tags, you must configure a Cloud Provider AWS Resource Metadata scrape job in Grafana Cloud, with the same AWS account, region, and services that you’ve configured your CloudWatch metrics stream for. Grafana Cloud periodically scrapes info metrics containing resource metadata about your tagged AWS resources. When metrics from your CloudWatch metric stream get ingested by Grafana Cloud, your ingested metrics are automatically enriched with scraped resource metadata, such as the name label containing the resource ARN.
One resource metadata scrape job per AWS account
When using CloudWatch metric streams, you can only configure one AWS Resource Metadata scrape job per AWS account resource ID. If you try to create a second resource metadata scrape job for the same AWS account, Grafana Cloud rejects the request.
Enforcing this one-to-one mapping between AWS Resource Metadata scrape jobs and AWS Account resources ensures data consistency in the app experience as well as reduces the possibility of unnecessary and costly configuration. AWS Resource Metadata scrape jobs collect info metrics containing metadata about the AWS resources in your AWS account. Having multiple scrape jobs that target the same resources is unnecessary and costly due to the duplicated info metric series, and reduces the ease and data consistency when writing PromQL queries that use the info metrics.
CloudWatch metrics scrape
After configuration, CloudWatch metrics scrape:
- Continuously pulls metrics that have tags applied to them from CloudWatch
- Pushes these metrics to your hosted metrics instance in Grafana Cloud
Then you can drill into your data and identify issues.
Note
For AWS to ingest metrics from CloudWatch into Grafana Cloud, you must set at least one tag on a resource in AWS.
How CloudWatch metrics scrape jobs work
When you create scrape jobs to collect data, you can specify jobs that logically split your data, and scrape any number of AWS accounts to better organize your data.
Metrics collection and storage
For every scrape job, an open source exporter continually pulls metrics from CloudWatch and stores them in a Prometheus format in Grafana Cloud.
Then you can use PromQL to query metrics later at no additional cost.
PromQL allows you to run familiar expressions, such as aws_ec2_cpuutilization_maximum{region=“eu-west-2”, scrape_job=”myEC2Job”}.
Data flow
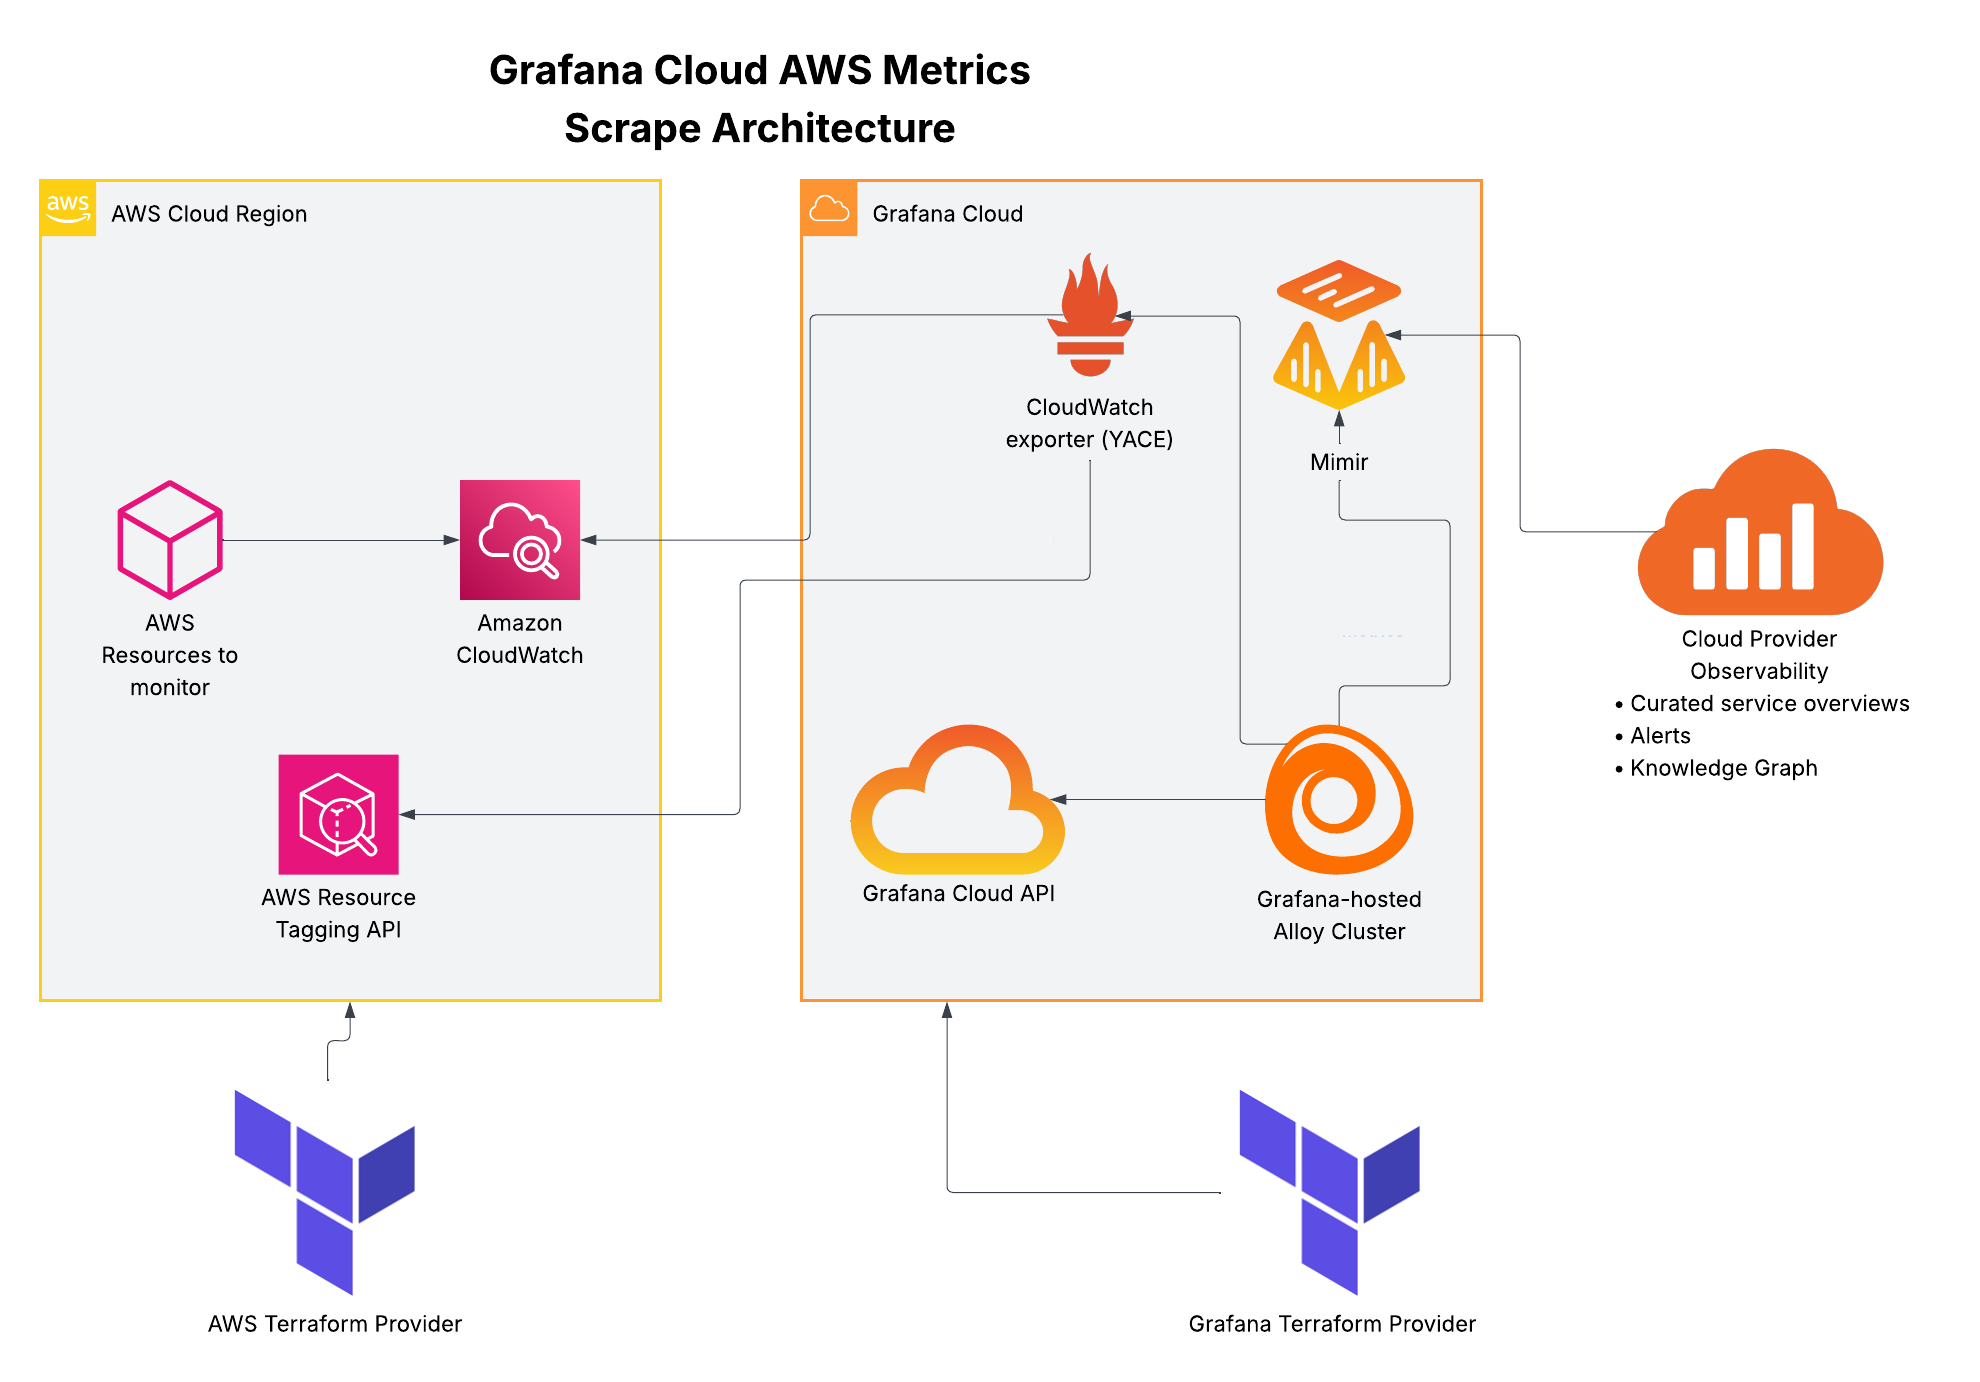
- Push raw service metrics
- Create CloudWatch scrape config
- Read CloudWatch scrape configs
- Call CloudWatch exporter with config
- Collect metrics according to scrape config
- Collect tagged resources to associate with metrics
- Remote-write metrics


