Application performance overview
The Application Performance Overview provides a comprehensive view of your frontend application’s performance metrics, including Core Web Vitals, page loads, errors, and HTTP requests. Use this dashboard to monitor user experience, identify performance bottlenecks, and track improvements over time.
When reviewing the dashboard, look for these key indicators of healthy performance:
- Web Vitals values are green (good performance)
- Page Loads don’t have unusual spikes, either high or low
- Errors are zero or below your expected threshold
- P75 graphs show consistent trends without sudden spikes
When opening the page there a couple of things you should look for:
- Healthy Web Vitals values are green
- Page Loads don’t have any spikes, low or high
- Errors are 0 or below an expected threshold
- P75 graphs don’t have any spikes
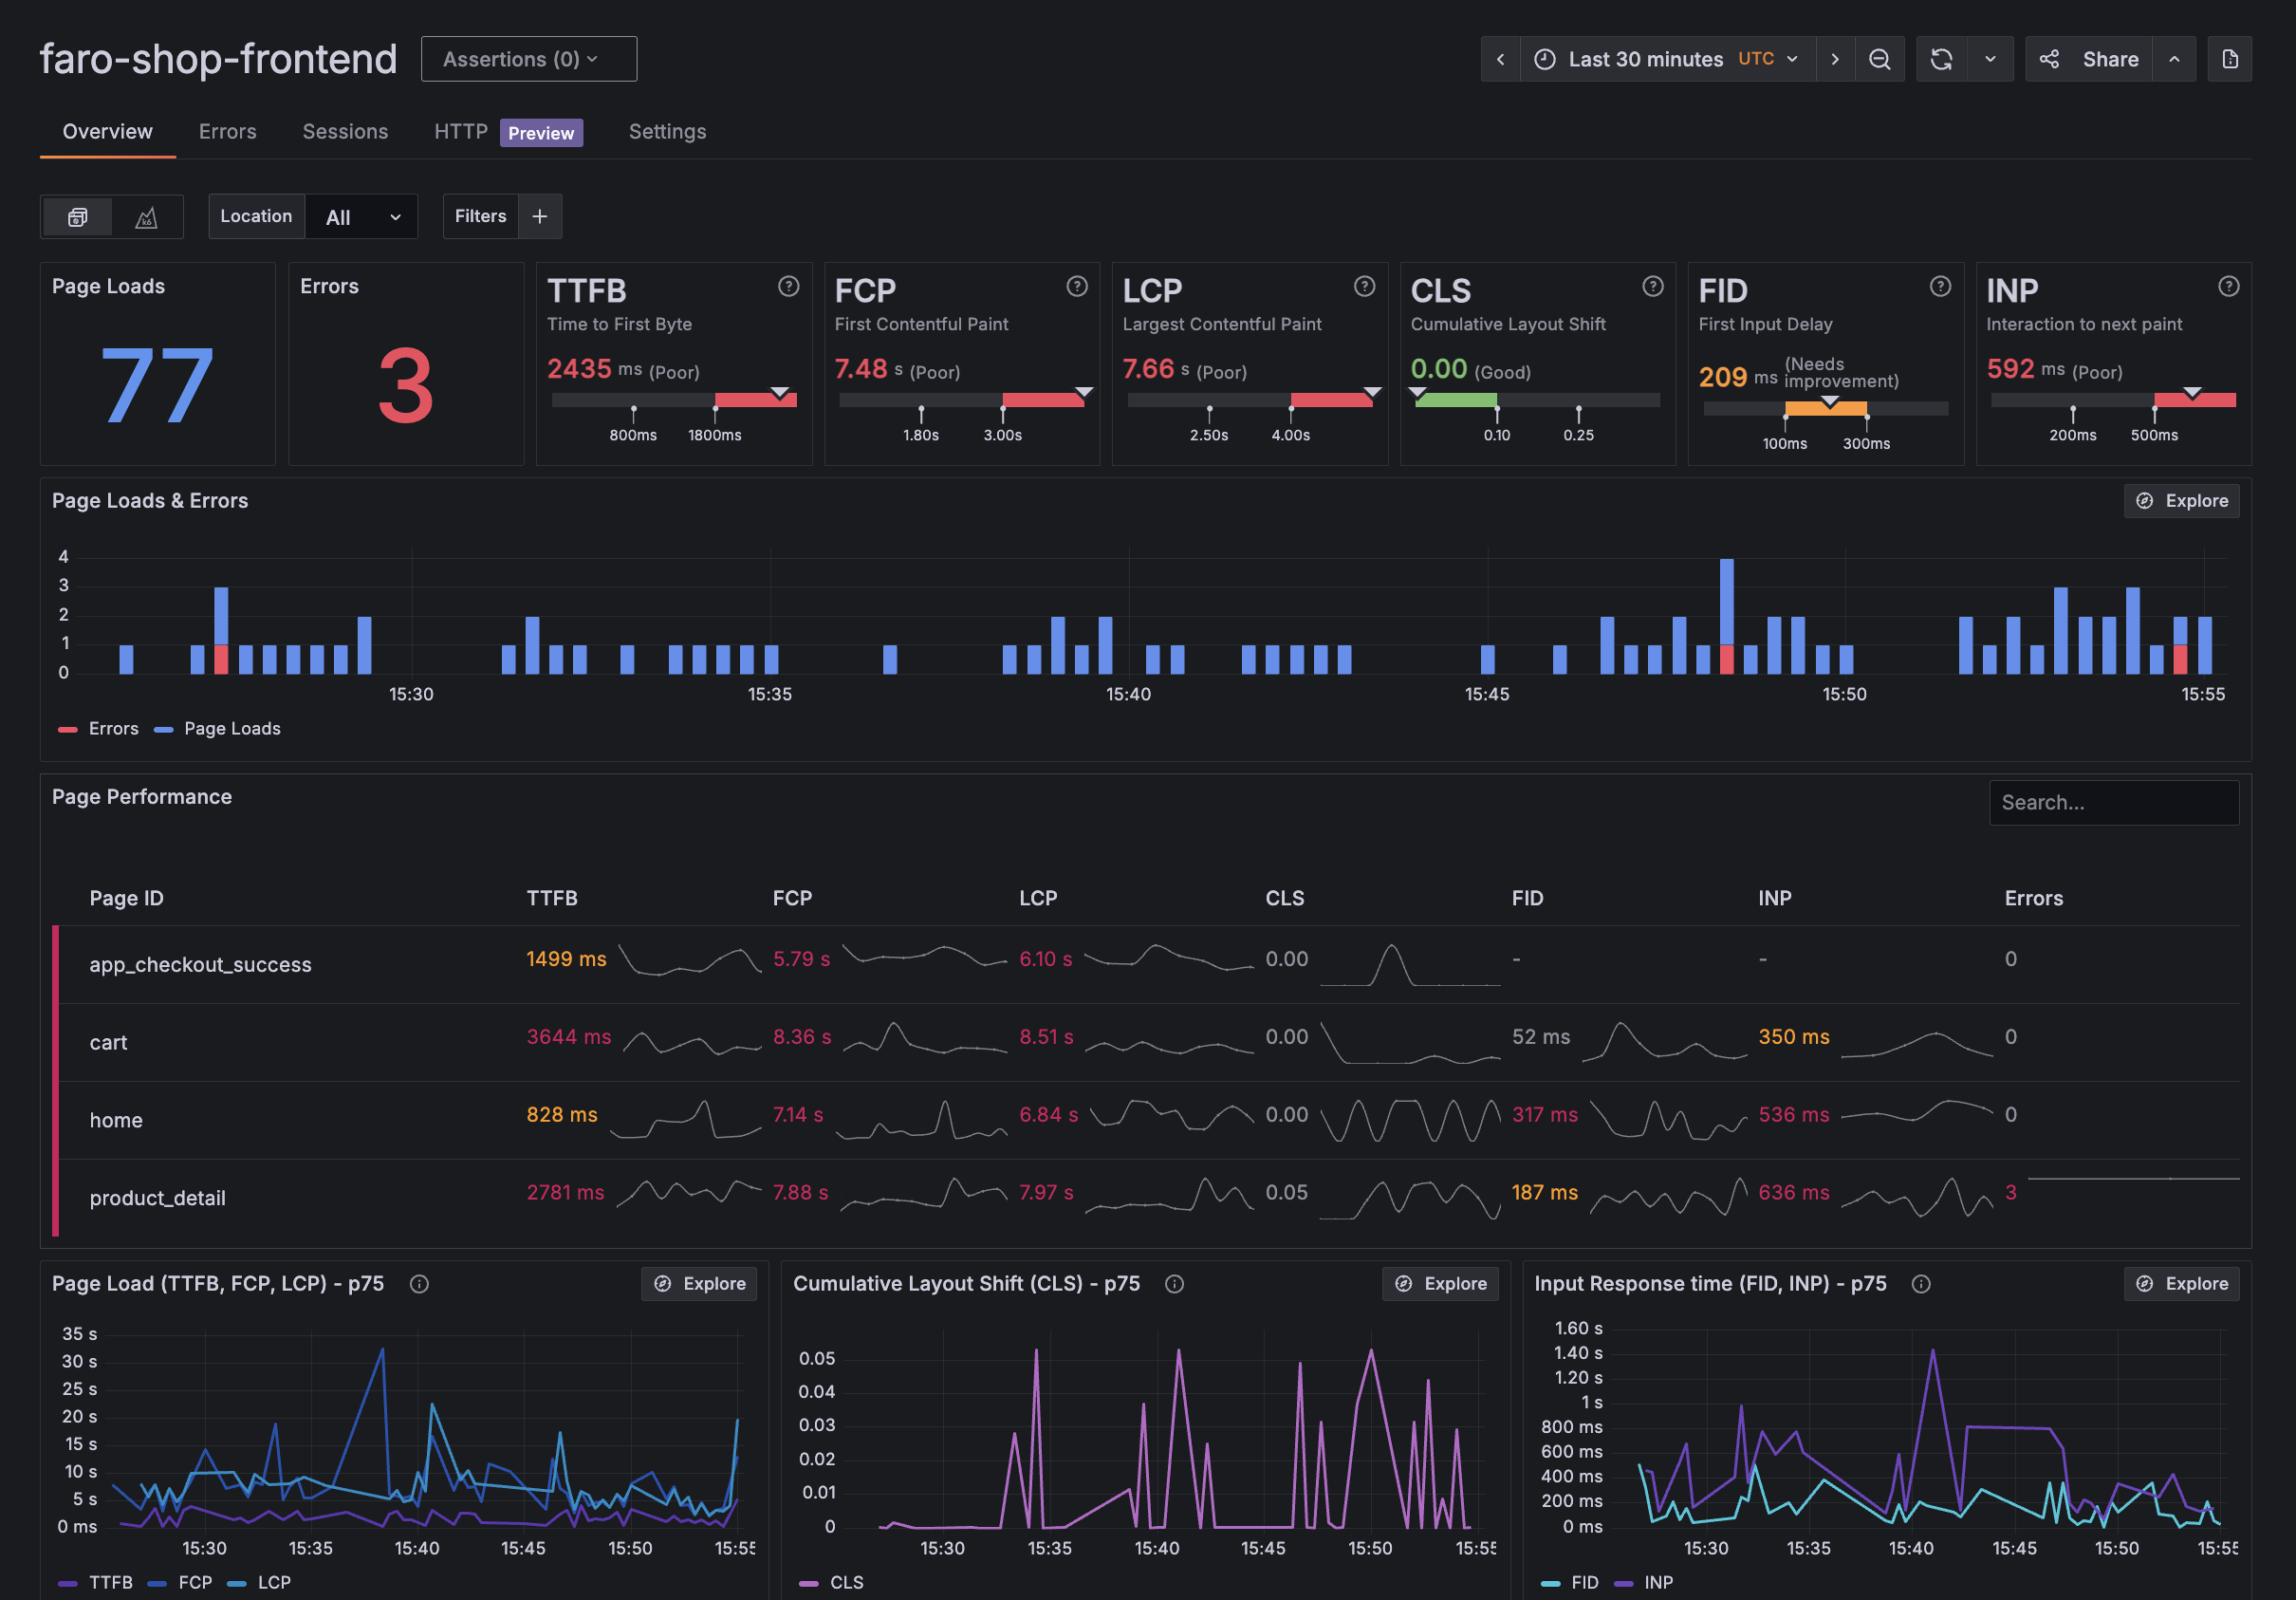
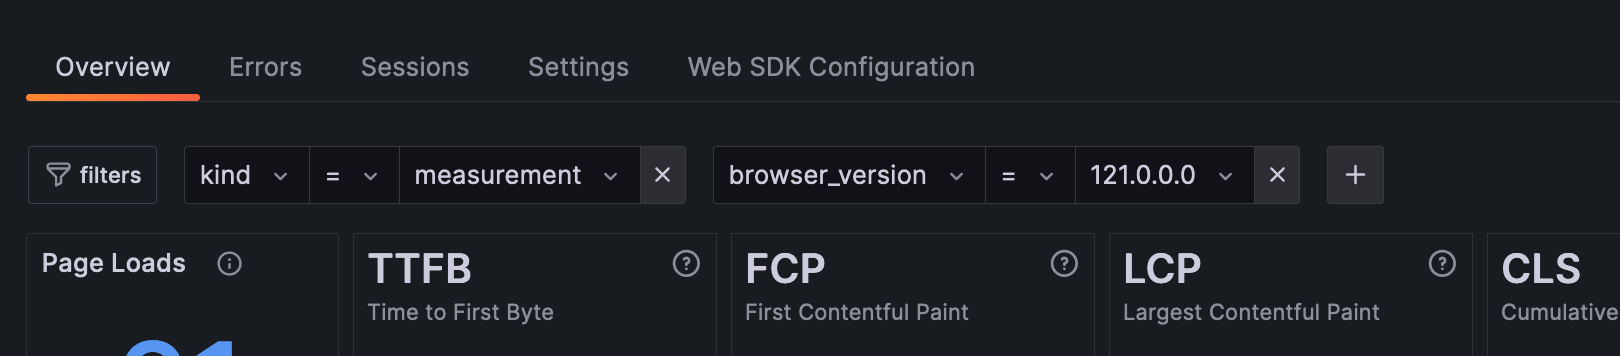
Core Web Vitals
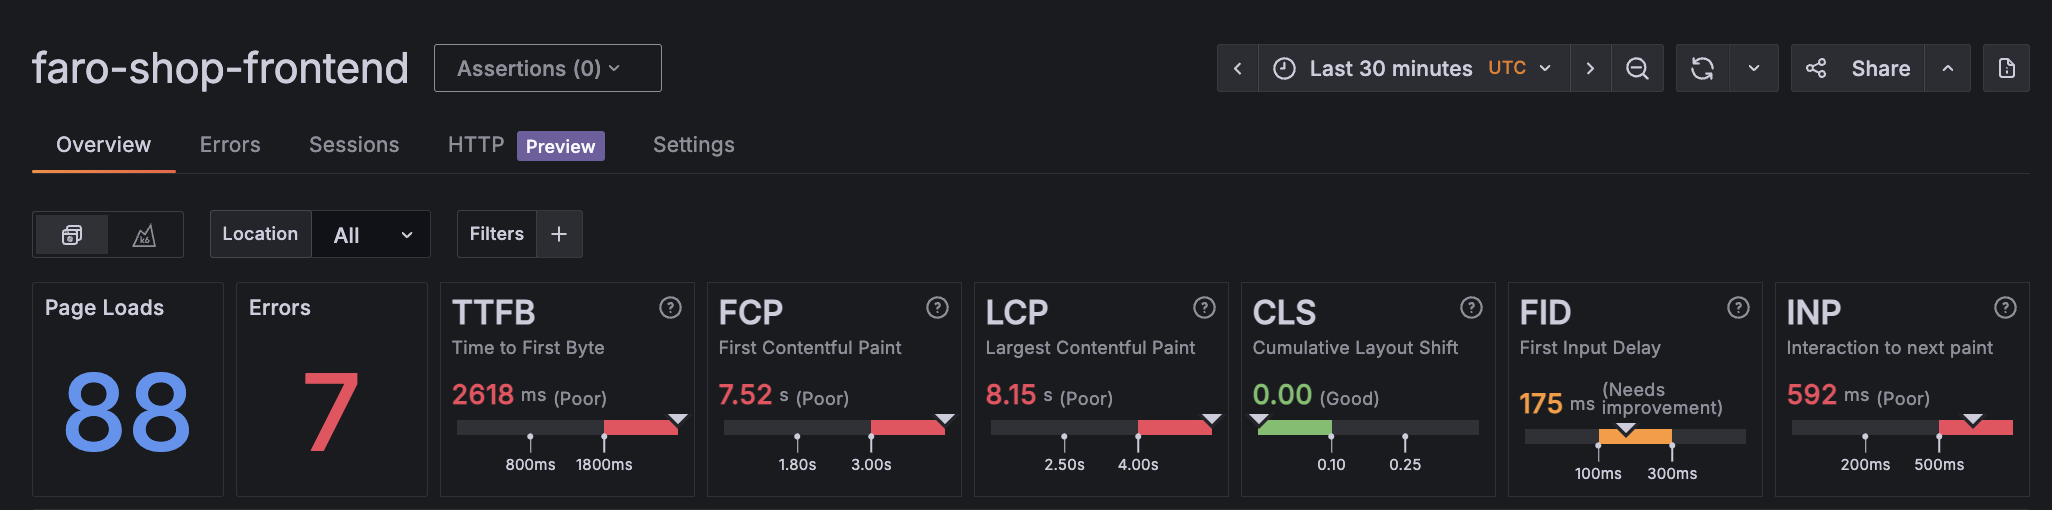
The first row of the dashboard shows the web vitals. Web Vitals measure the real-world user experience for loading performance, interactivity, and the visual stability of web pages. The following video walks you through how to understand and analyze core web vital metrics:
- TTFB: Time to First Byte, measures the time between making a request and receiving the first byte of response.
- FCP: First Contentful Paint, measures how long it takes the browser to render any DOM content like text, images, or SVG elements.
- CLS: Cumulative Layout Shift, measures the amount of unexpected movement of content on a page during its lifecycle.
- LCP: Largest Contentful Paint, measures the time it takes for the largest visible element in the viewport, like an image or headline, to fully render.
- FID: First Input Delay, measures the time between a user’s interaction and when the next visual update is painted on screen.
The following video walks you through how to understand and analyze page loads, errors overview, metrics, filters, and other sections of the dashboard:
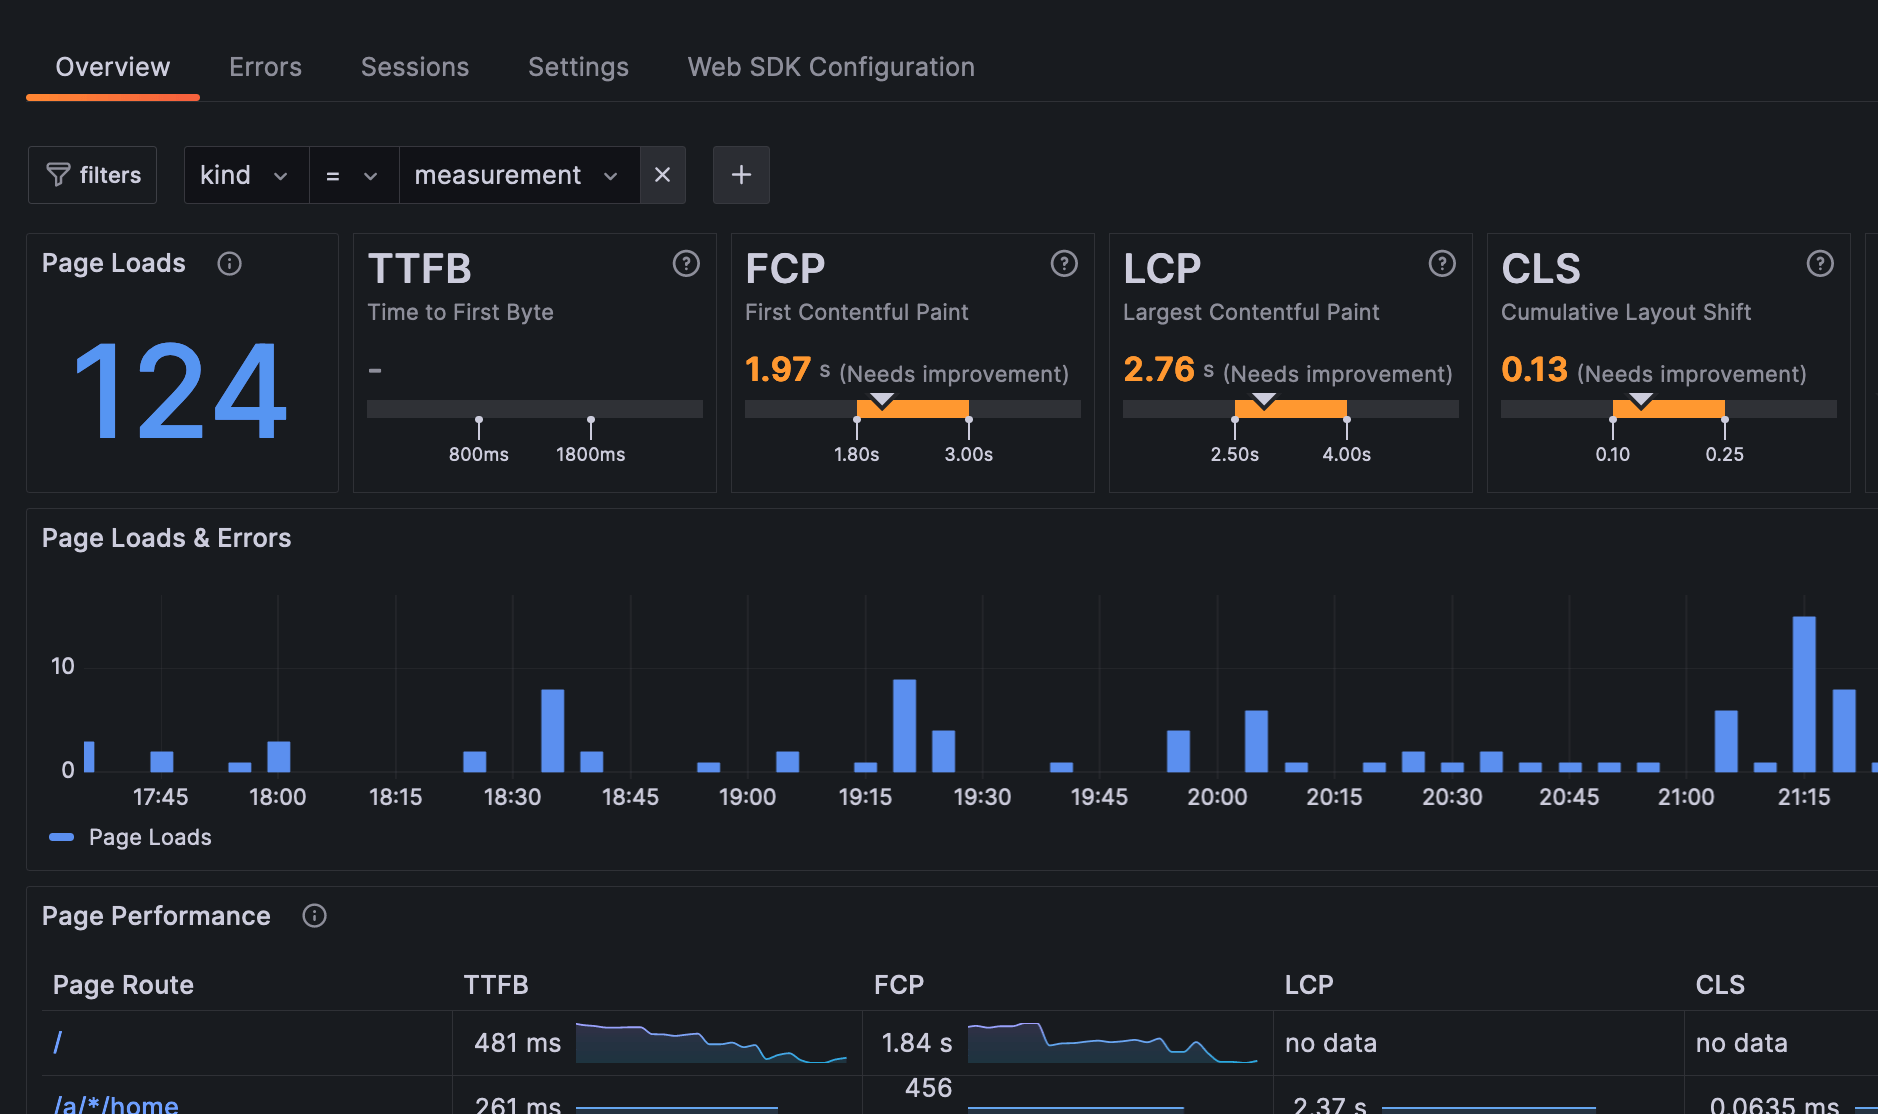
Page Loads
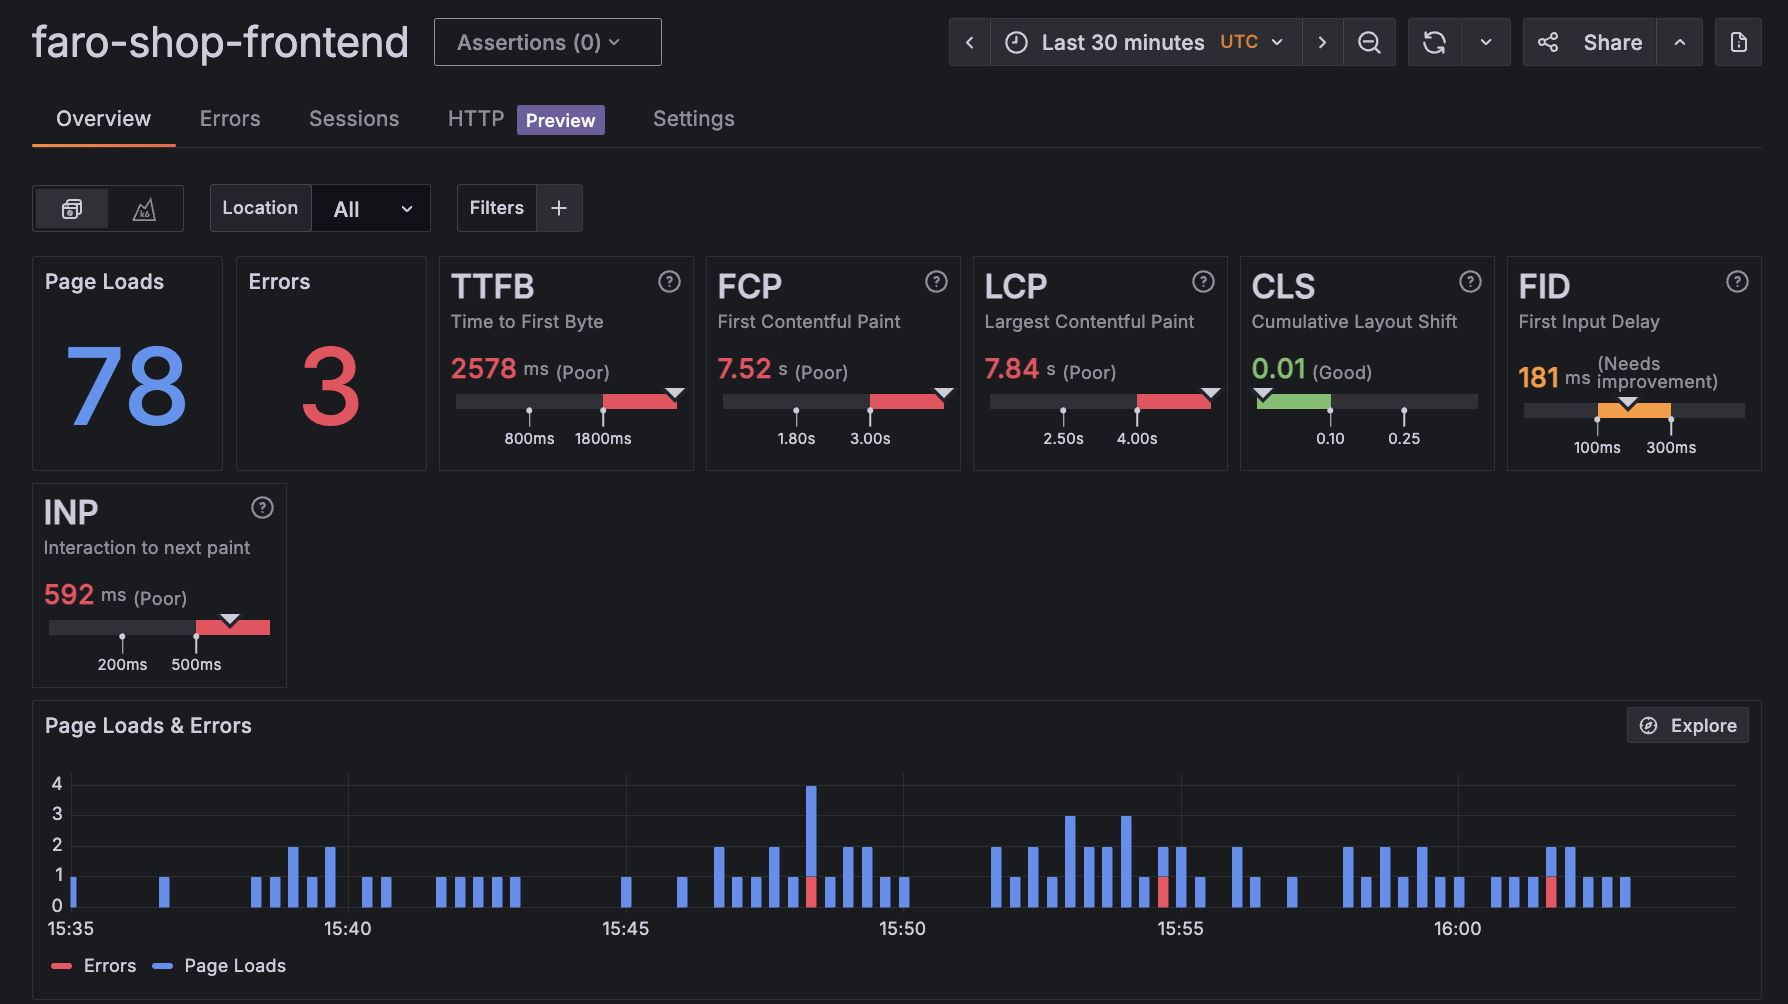
The Page Loads section shows how many times pages were loaded during the selected time frame and highlights errors using a color-coded chart: blue for successful page load and red for failed page load. This section helps assess page load health and identify page load performance issues.
Page Performance
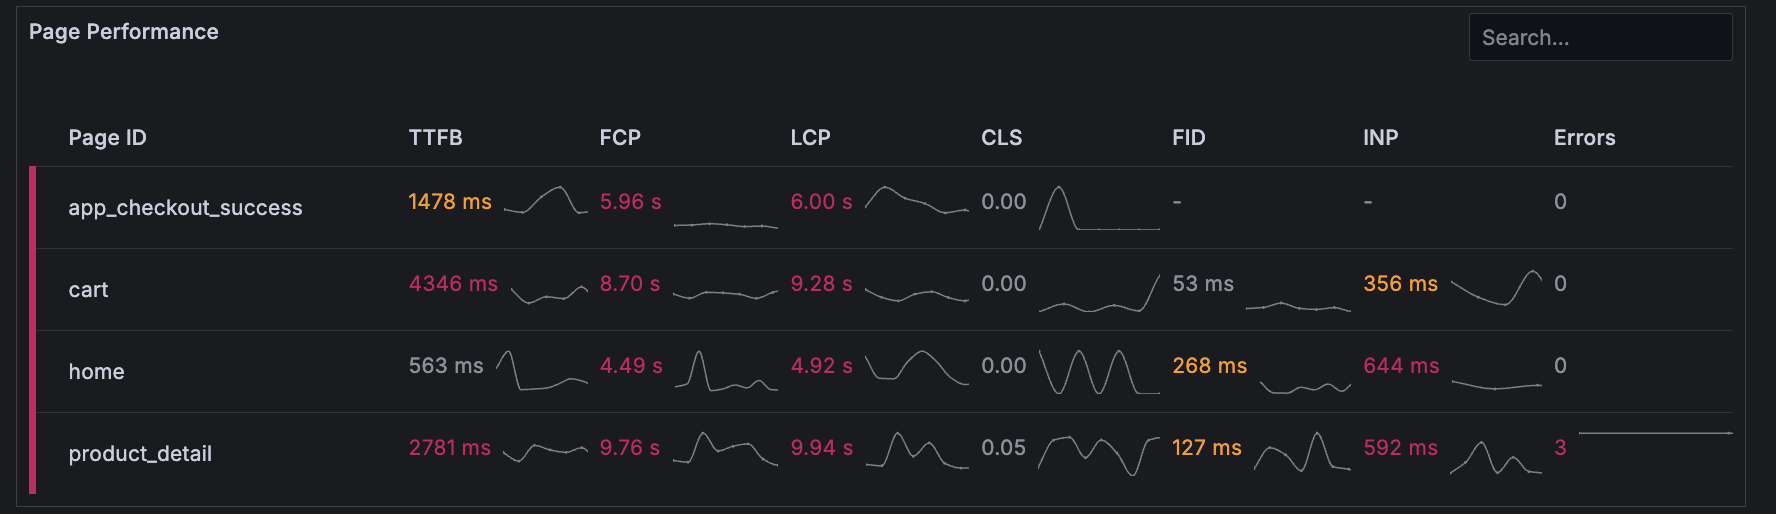
The Page Performance section displays multiple page IDs, each with associated Core Web Vitals and error metrics. Page IDs are auto-generated by the Faro cloud receiver but can be overridden during instrumentation. Performance is color-coded: red for poor, yellow for needs improvement, and green for good. This section helps identify pages that aren’t performing well and provides detailed insights into each page’s health.
Errors overview
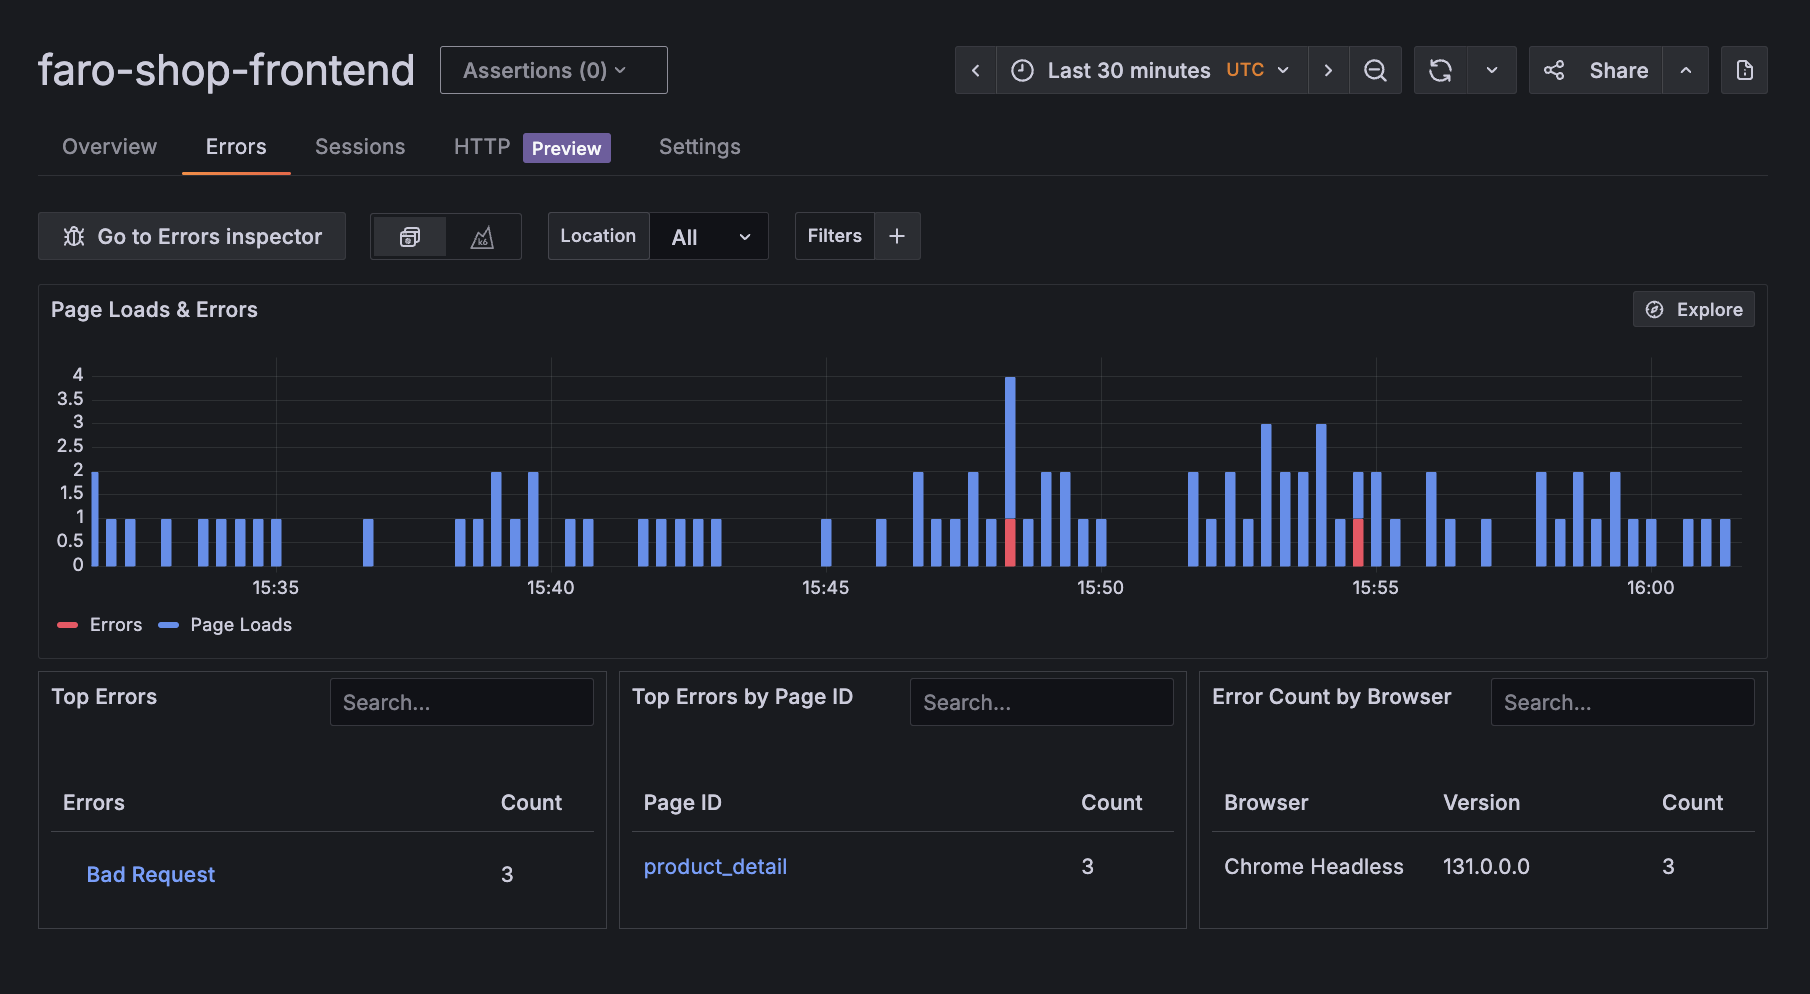
The Errors tab displays the total number of errors within a selected time range and their distribution over time. It highlights the most frequent errors, top errors by page ID, and error counts by browser. Clicking on a specific error reveals the stack trace, detailed message, metadata, and links to affected sessions. This level of detail helps pinpoint root causes quickly and improves the debugging process.
Sessions overview
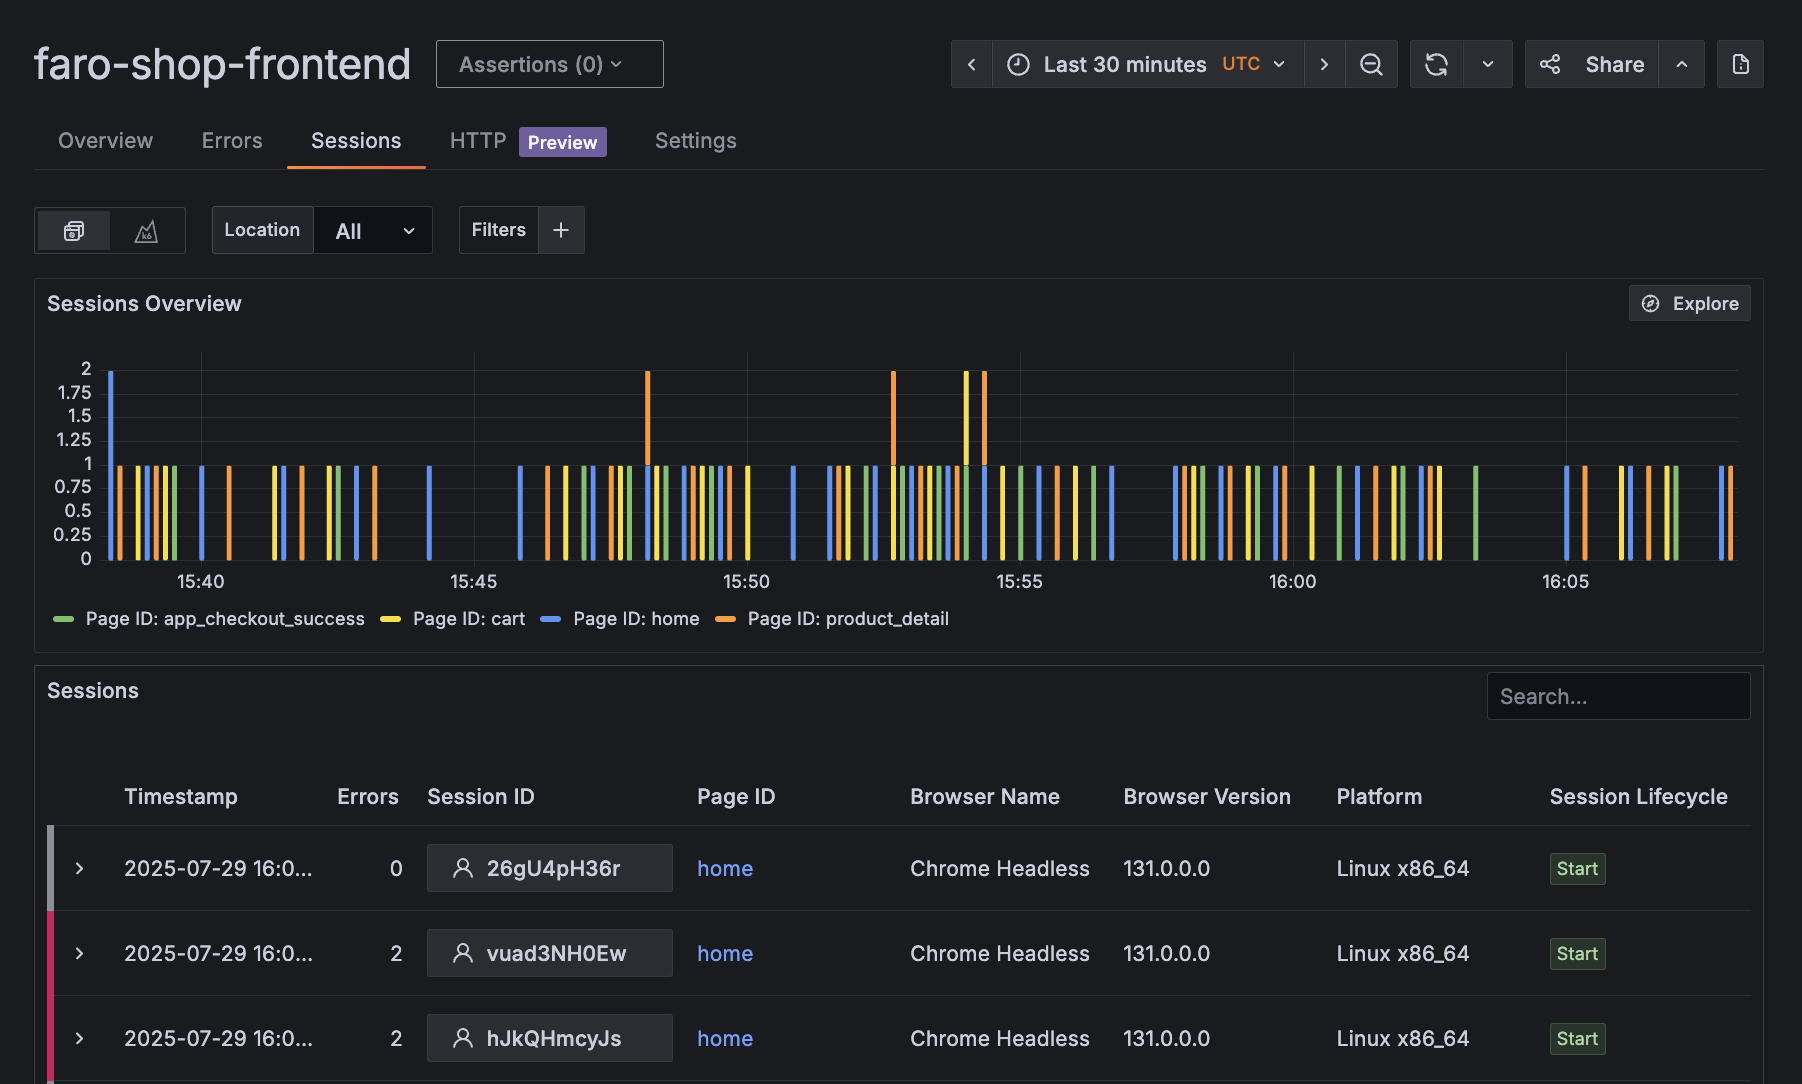
The Sessions tab tracks individual user sessions using unique session IDs created automatically by Faro. It displays session counts over time, along with detailed tables showing timestamps, errors, browser info, and lifecycle data. Selecting a session provides a full summary, including Core Web Vitals, page interactions, user journey, and request-level performance. This data connects real user behavior to performance issues, enabling deeper analysis and root cause identification.
Web vitals p75 time series
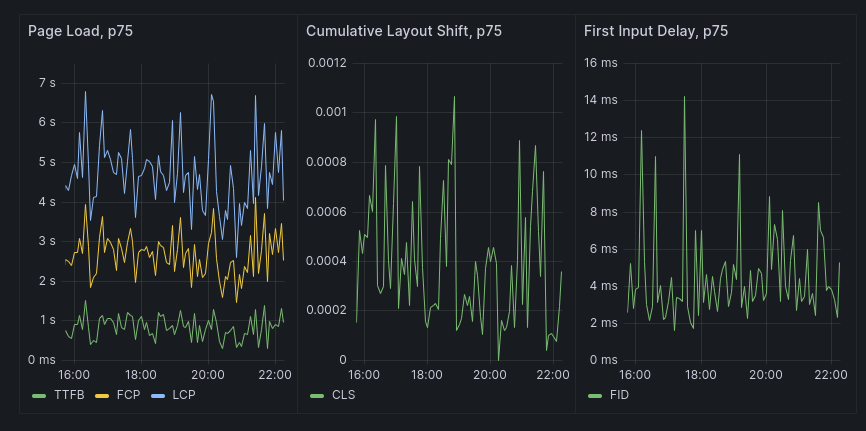
In this section, you can view a p75 distribution of all Web Vitals divided into:
- Page Load: TTFB, FCP, LCP
- Cumulative Layout Shift: CLS
- First Input Delay: FID
Use the web vital graphs to identify issues with your application and zoom into specific time windows.
HTTP overview
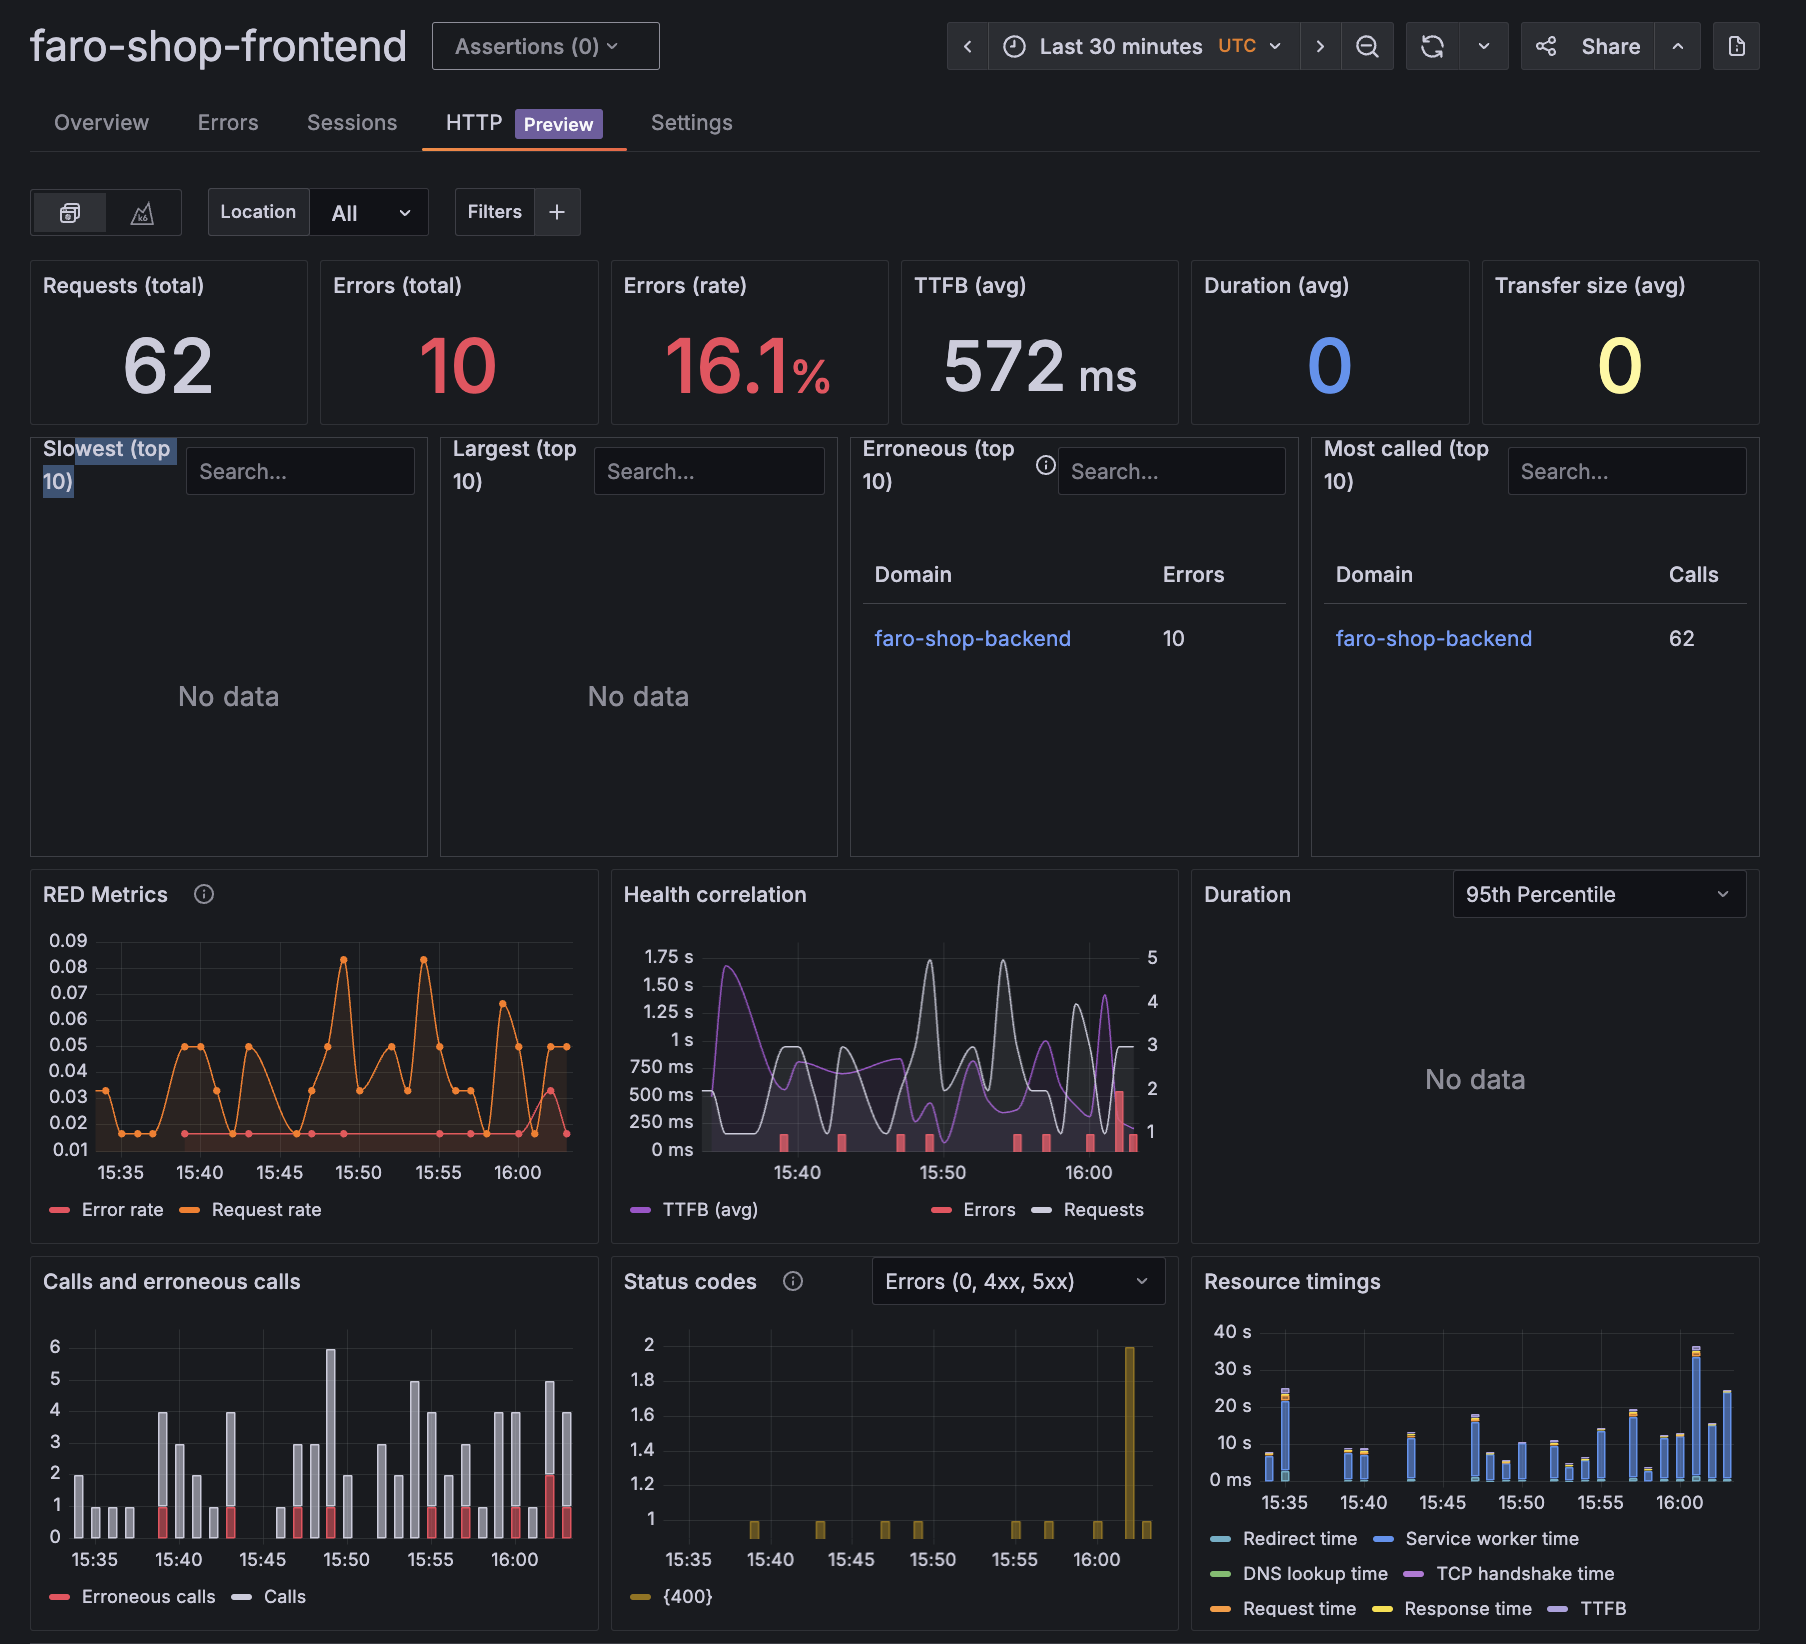
The HTTP tab provides insights into your application’s HTTP requests. It displays key metrics such as total requests, total errors, error rate percentage, and average TTFB. These metrics help evaluate backend responsiveness and identify issues affecting frontend performance. Use this section to monitor request quality and detect bottlenecks in real time.
Filters
On the top right, there is a set of filters you can use that allow you to:
- Change the data source
- Change time frame like you would normally in a Grafana dashboard
On the top left, there is a more complex filtering system that allows you to narrow down the information exposed. With it, you can slice and dice your data based on the meta-information, provided by the SDK.
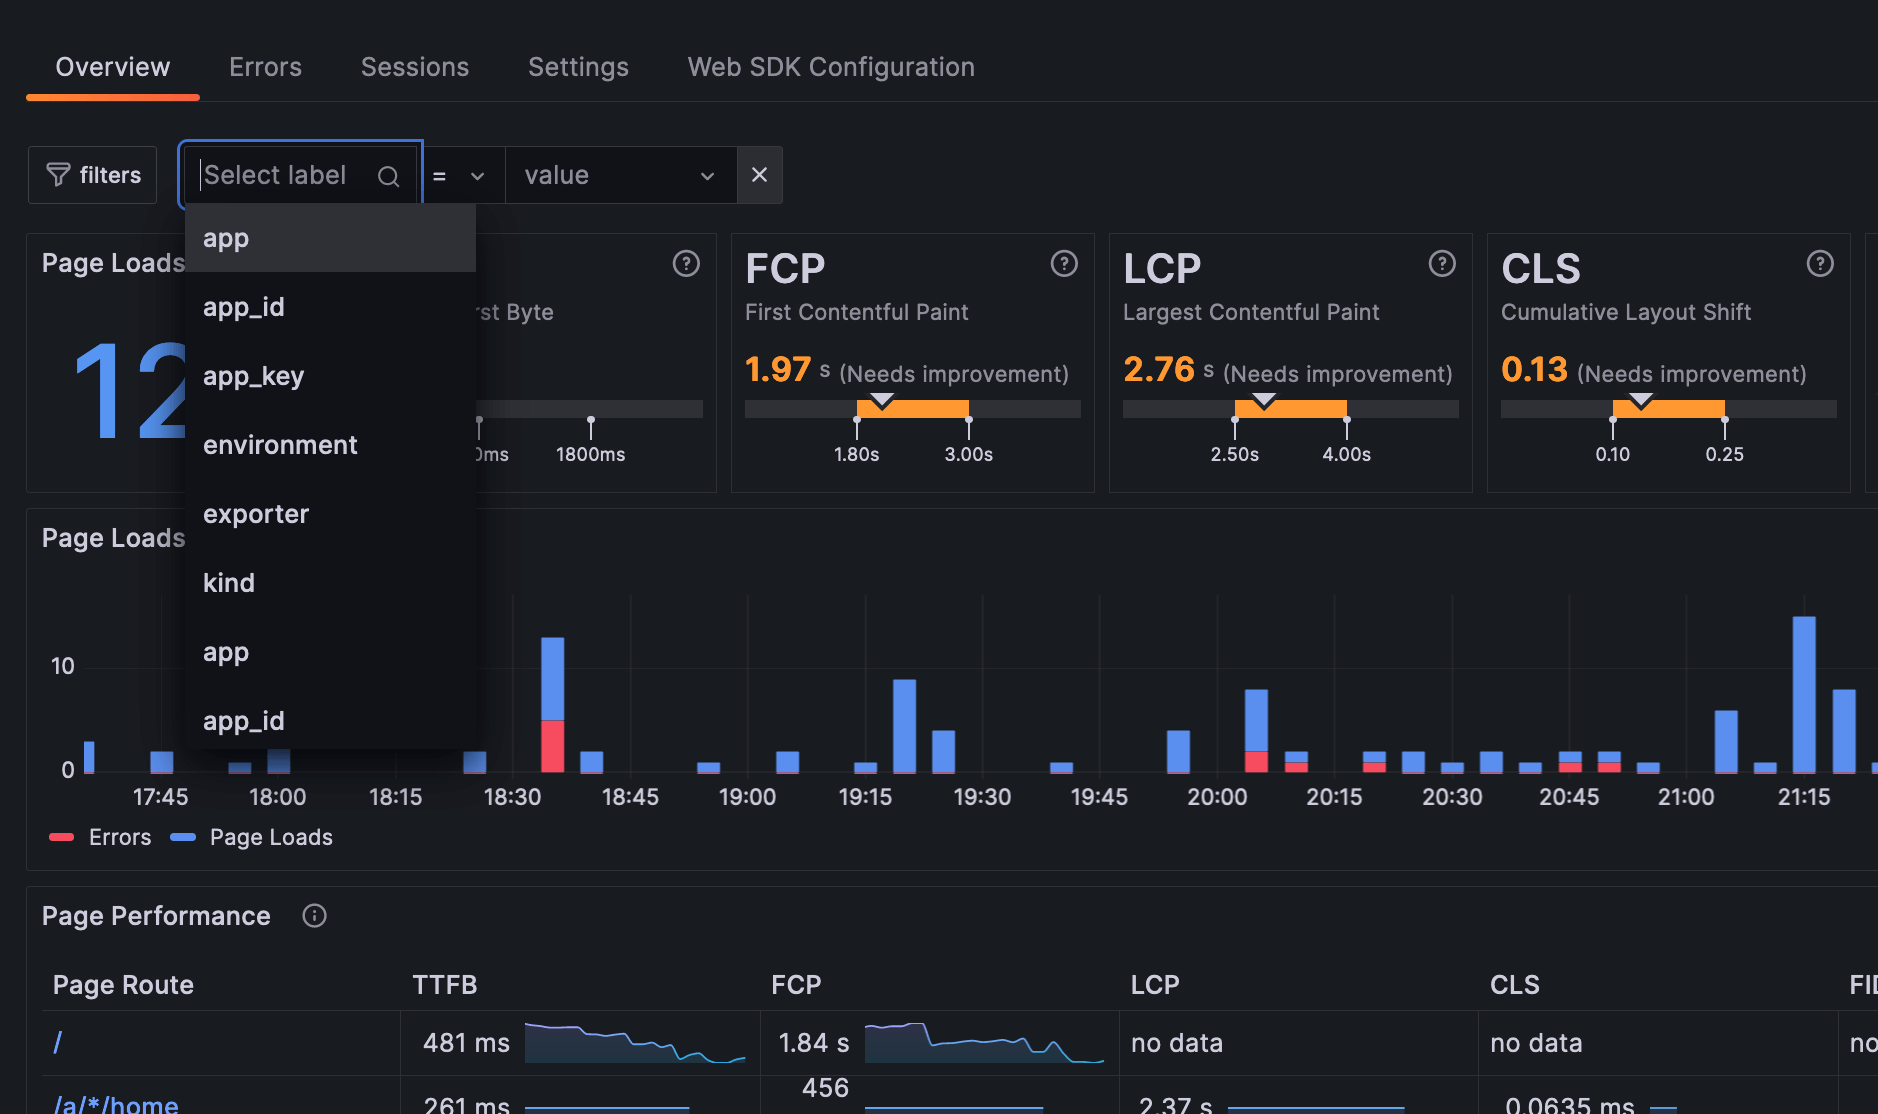
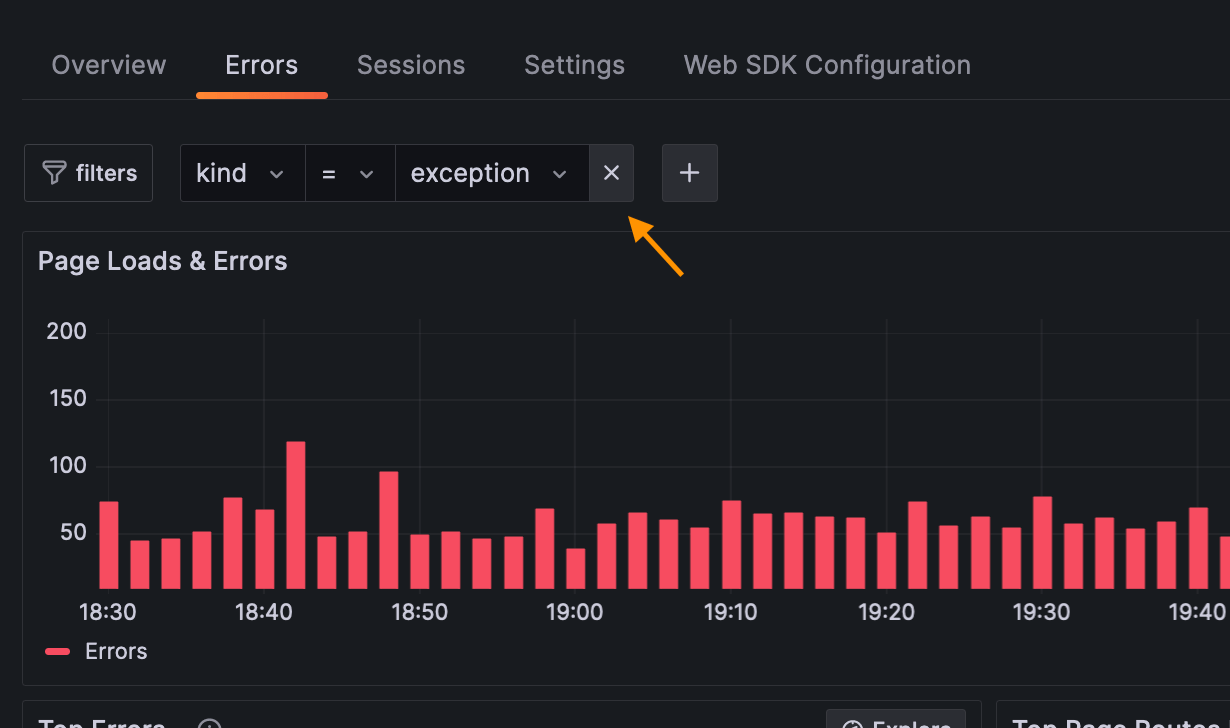
Adding a meta filter
To add a meta filter:
- Click the ‘+’ button
- Select the meta label that you want from the drop-down
- Select the value from the drop-down
To edit a meta filter value:
- Click the value of the filter you want to change
- Select the new value from the drop-down
To remove a meta filter
- Click the label of the filter you want to remove
k6 browser performance overview
To enable the ability to review both lab and field data in web performance monitoring and testing, Frontend Observability offers a way to view your k6 browser generated telemetry isolated from the real user data.
If you use Faro Web SDK and k6 Browser, you automatically have this data tagged with a k6_isK6Browser flag attribute in your telemetry.
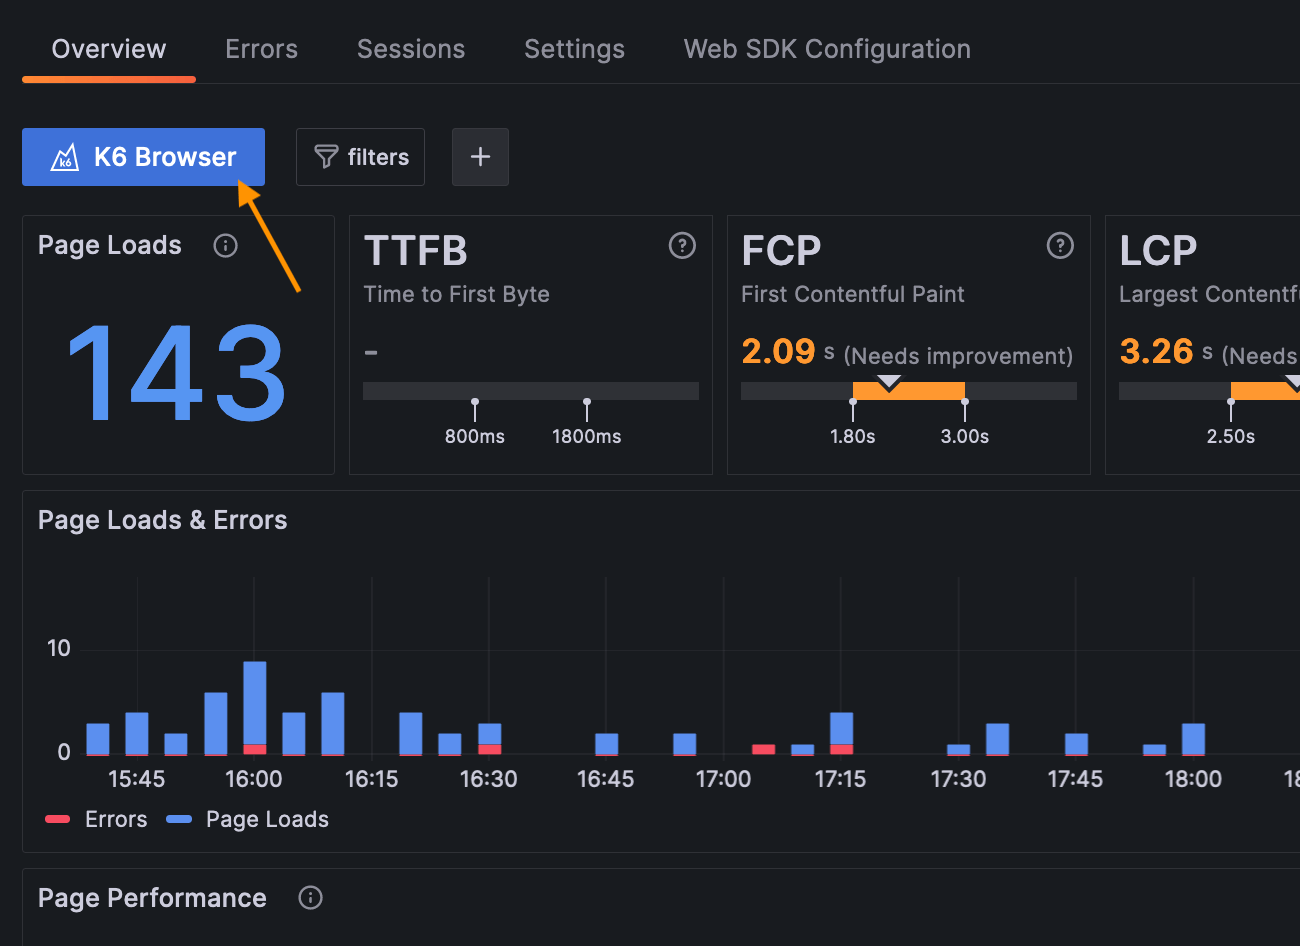
To view the k6 Browser generated data:
- Navigate to the Application Performance Overview page
- On the top left, click on the k6 Browser button