Analyze user sessions
User sessions help you understand the complete user journey through your application, from initial page load through interactions, errors, and backend API calls. Each session groups all events from a single user’s visit, so you can trace what led to errors or performance issues.

Browser, user-journey, and UX related events recorded by the Faro Web SDK are associated with a unique session ID to enable deeper insights into erroneous conditions and why they occurred.
Before you begin
- Your application must be instrumented with the Faro Web SDK
- For trace correlation features, add the web-tracing package to Faro (included in the Frontend Observability plugin setup code)
You can find all recorded user sessions on the Sessions page. The sessions list can be filtered by session properties.
Sort and filter sessions
You can filter sessions by properties and meta data in the session panel.

For example, filter on the following meta data to get quick insights into users’ behavior:
page_url- the full url where the event was recordedbrowser_*- meta attributes about the browser and the operating systemevent_*- meta attributes related to a recorded event
Click on the column headings to sort the data. Subsequent clicks cycle through the sort order: descending, ascending, and not sorted. For example, click the “Errors” heading to order the sessions by error count in descending order.
Use the search field to narrow the scope of the table to only show rows which data includes the given search term.

Analyze a single user session
Click on a Session Id to view the session details.

On the Session Details view, you can learn more about: the user session attributes, user journey events, and backend traces that were created as part of the user session.
Inspect user journey events
The user journey table contains all events that were automatically recorded and manually created:
session_start- A new user session was startedsession_resume- A user session was resumed after a navigationsessions_extend- A user session reached its maximum activity time or maximum lifetime and a new session was automatically createdview_changed- Indicates that the user transitioned into another viewfaro.performance.navigation- Contains data about the performance of a navigation such as network and render timingsfaro.tracing.fetch- A trace event recorded for a fetch request send when the web-tracing package is addedfaro.tracing.xml-http-request- A trace event recorded for a xml-http-request request send when the web-tracing package is addedroute_change- A React Route change event send when the faro-react is used
Signal types:
measurement- Represents a measurement signal. For example measurements for the different web-vitalsexception- Represents an error that occurredlog- Represents a log message
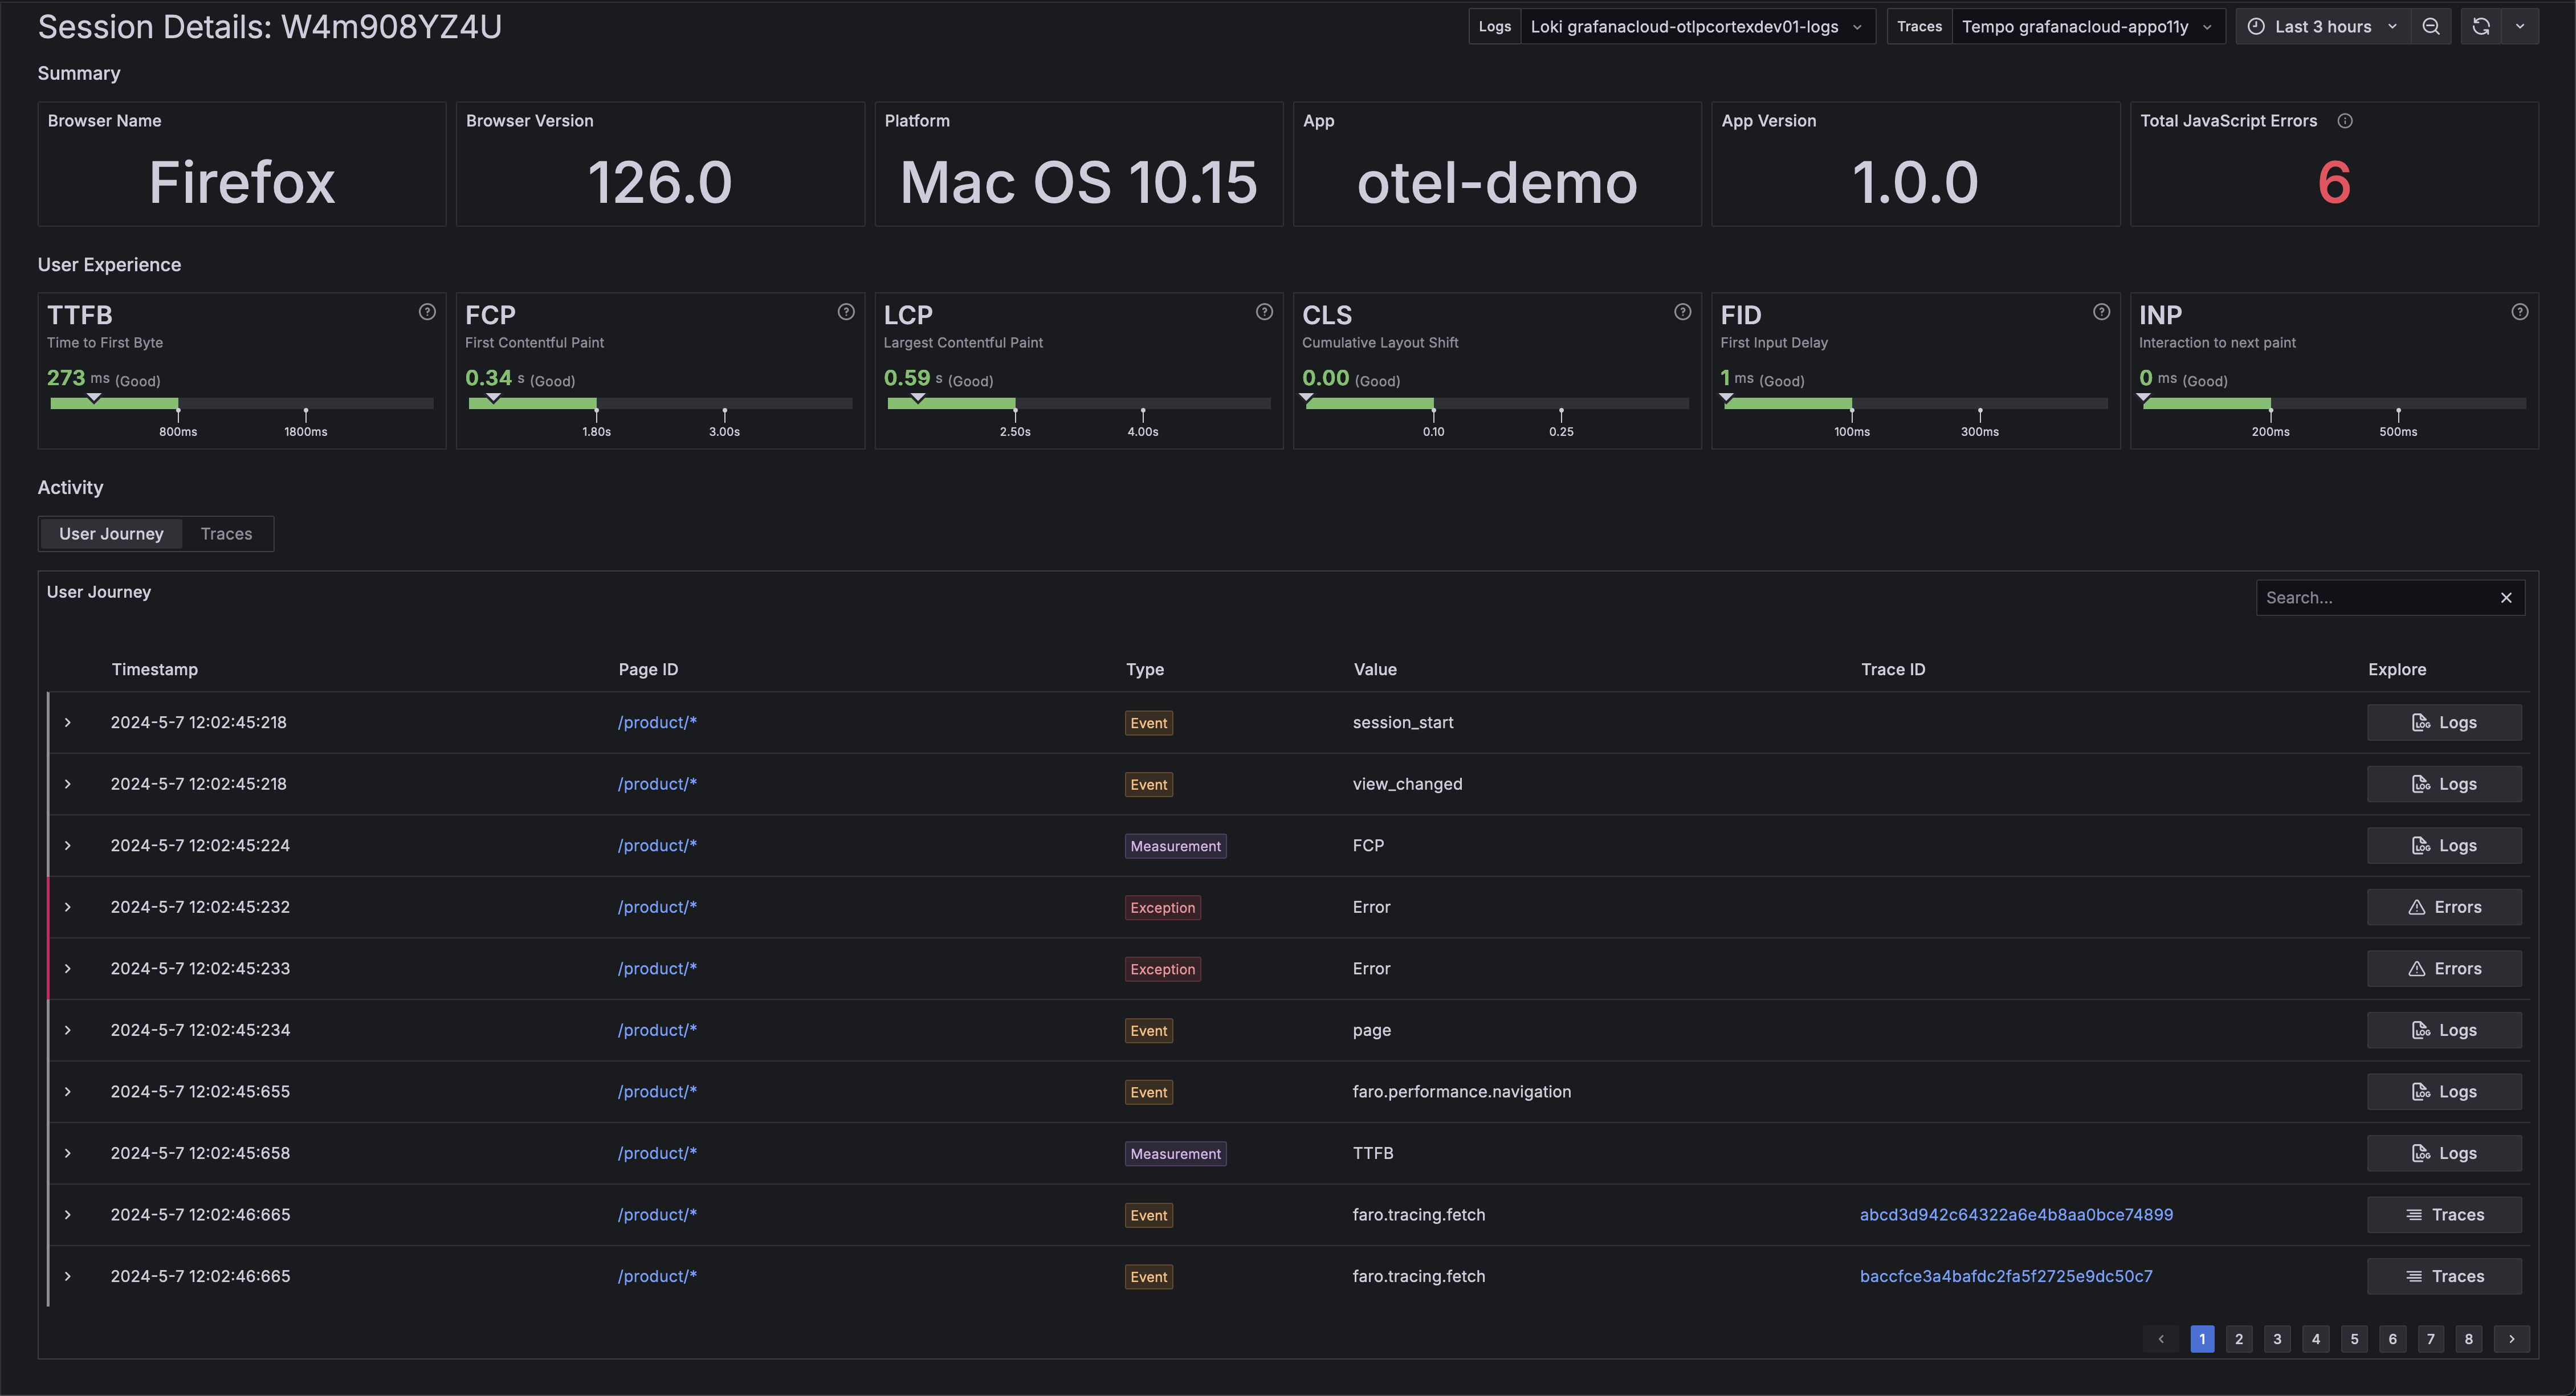
Click on a single event to view the raw event log or a single error view, depending on the event kind.
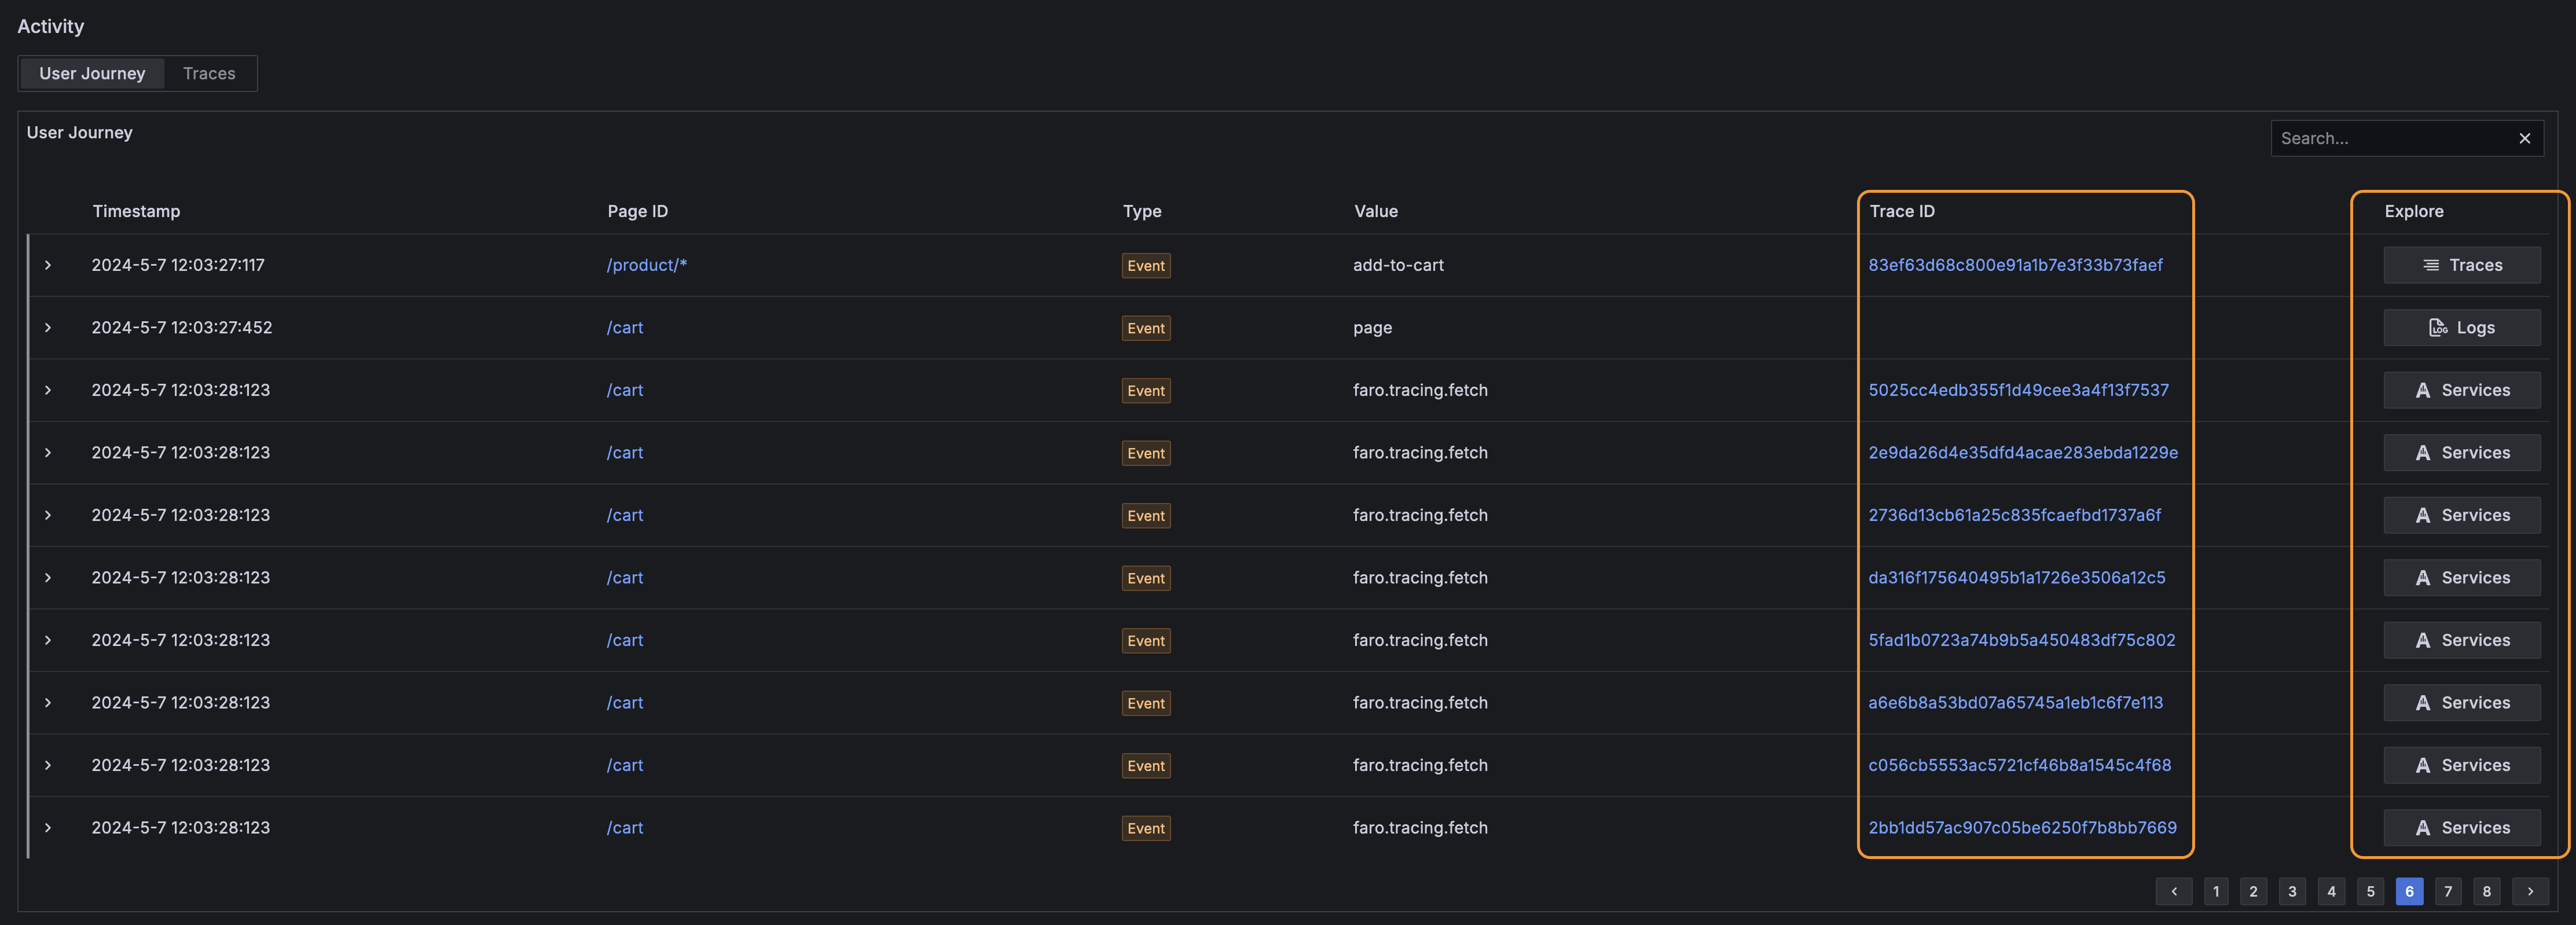
Continue investigation in other parts of Grafana Cloud
To gain end-to-end insights the User Journey table provides several actions to continue the investigation in other parts of Grafana Cloud and to follow a requests throughout the system.
Note
It is mandatory to have the web-tracing package added to Faro. The Faro setup code provided by the Frontend Observability plugin has it integrated already.
The User Journey table provides different actions to continue the investigation in other places:
The
Trace IDcolumn.If there’s a trace ID available for a signal, it shows up in the
Trace IDcolumn. Following the trace ID link opens the Grafana Cloud Trace Explore view.The
Explore ColumnThe
Explore Columnprovides the most relevant action fo a specific row.Tracesopens Trace Explore with the respective trace ID selectedLogsopens Logs Explore filtered to show only logs for the specific signalErrorsopens the specific error details in the Errors applicationServicesopens the Traces view for the specific trace in Application ObservabilityNote
The
Servicesaction is only visible if there are server spans found for the given trace ID. If it is a client only span, theTracesaction shows up instead.
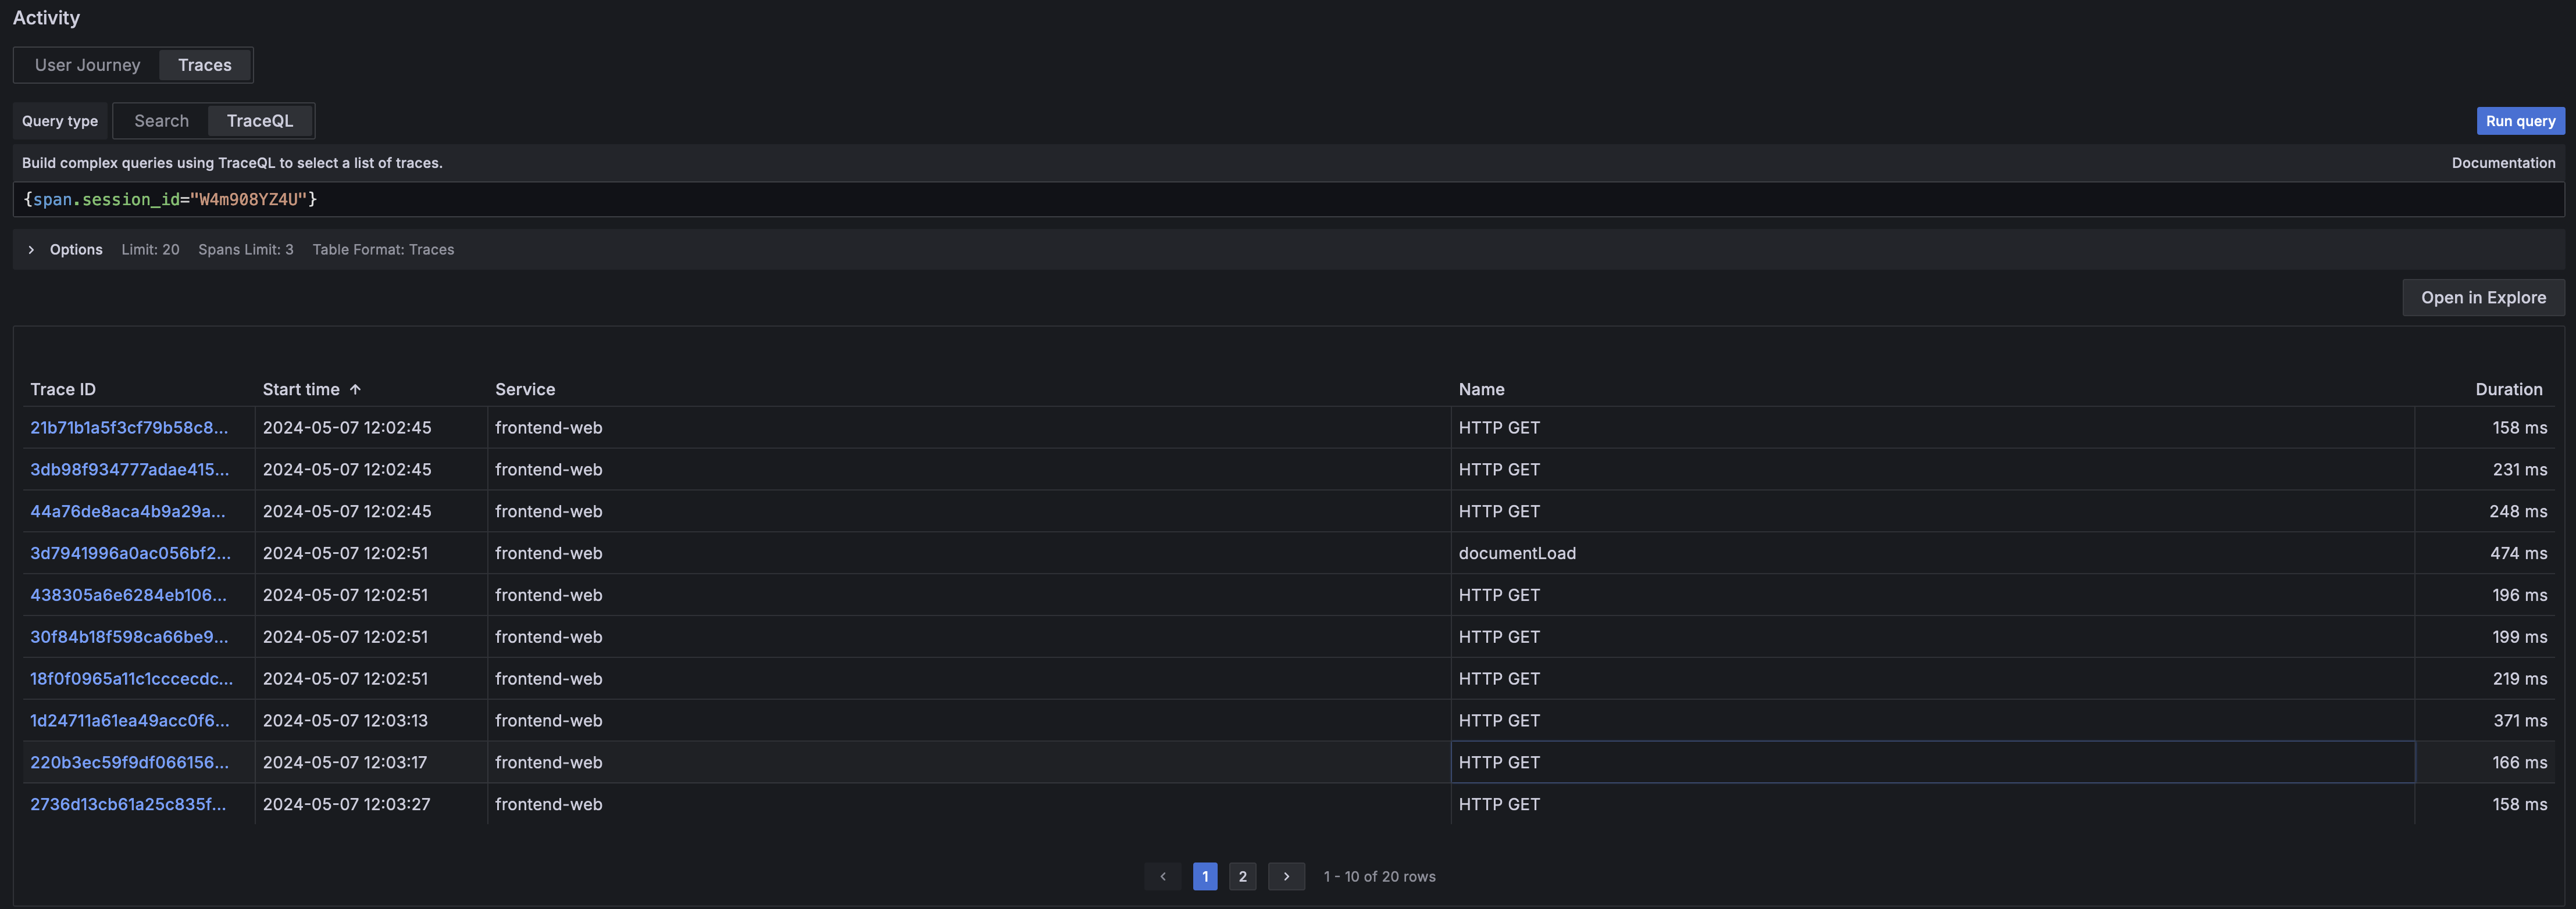
Inspect traces produced as part of a user journey
If the tracing instrumentation is activated, the Faro Web SDK records interactions with backend services as trace data.
Those interactions have an additional session_id attribute and allow for easy discovery of slow backend transactions.
The traces inspect table provides a full search editor if you need to narrow the scope of the displayed items.
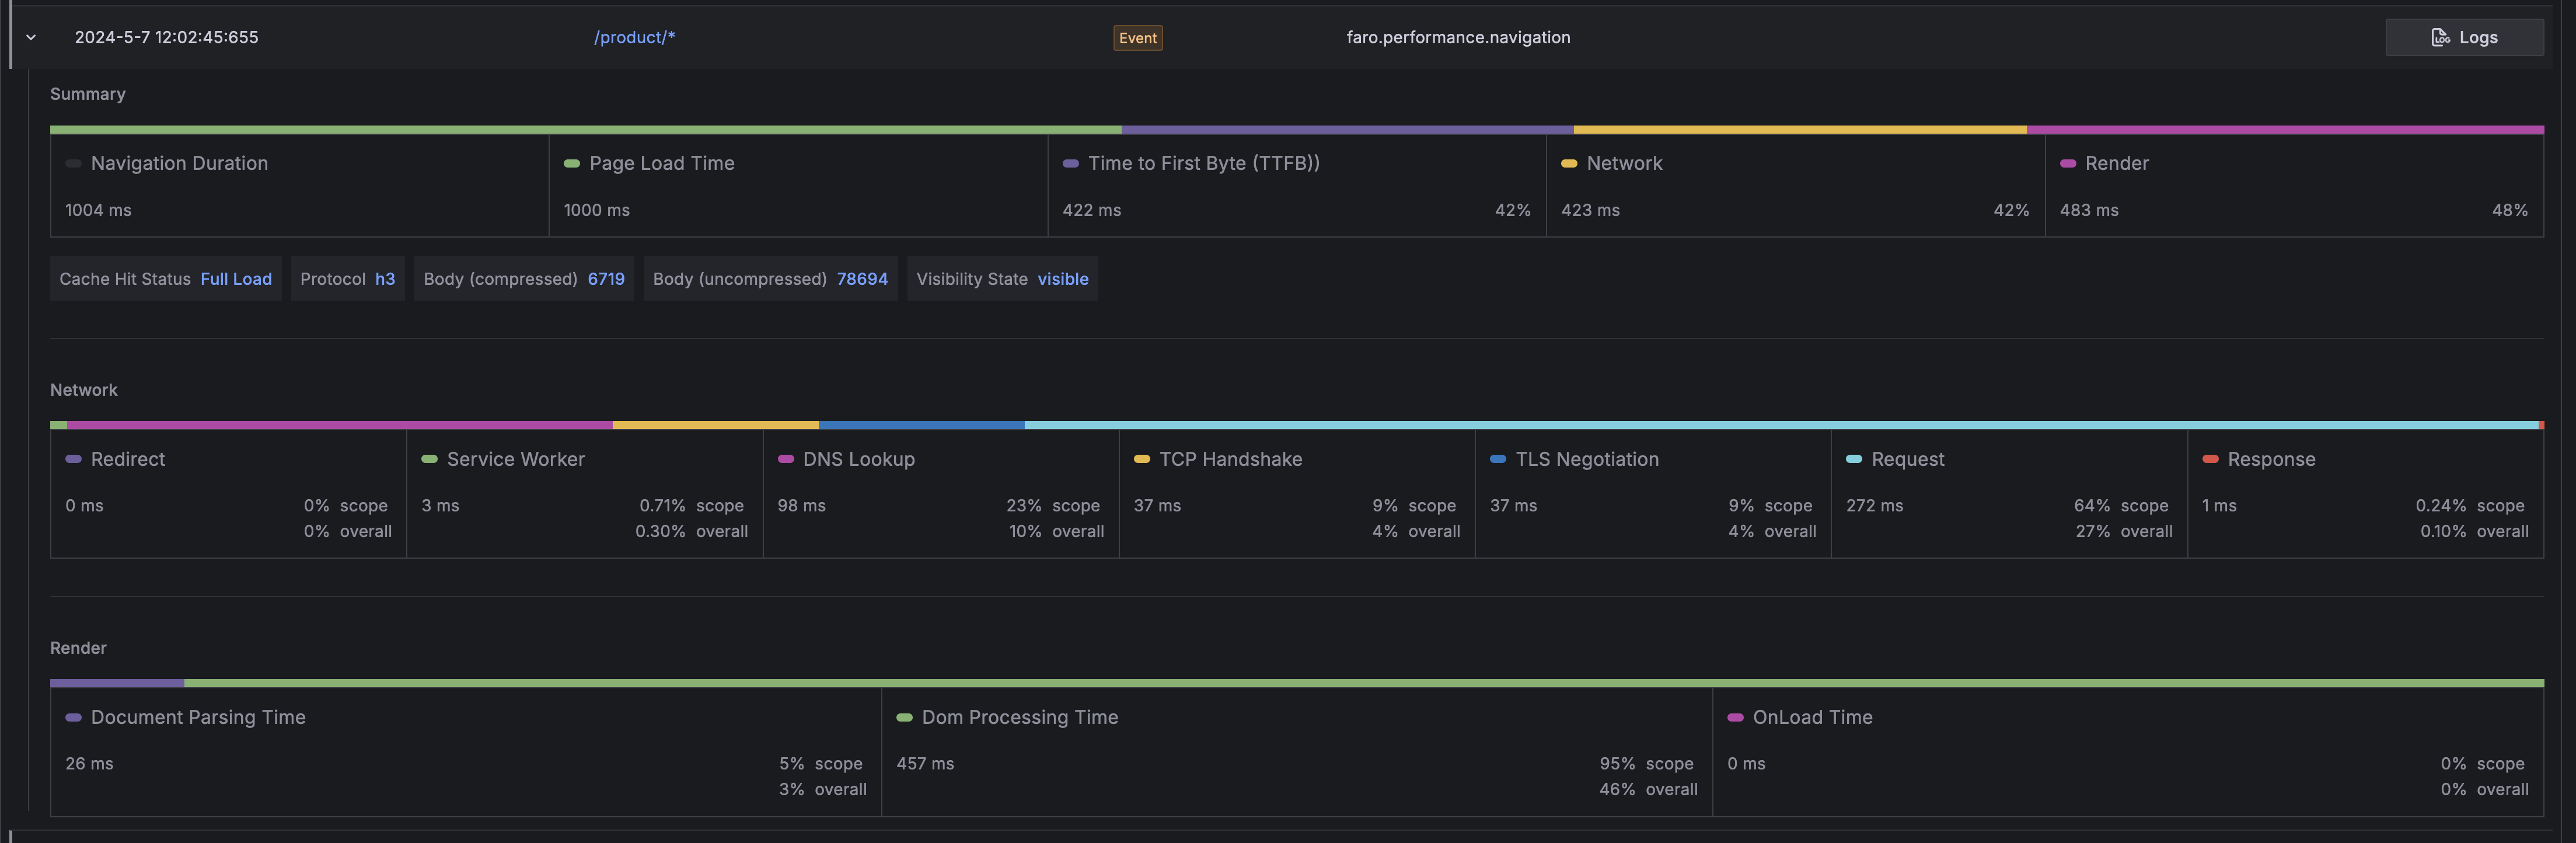
Inspect and understand navigation performance
An overview about the time spent in the different phases of loading and rendering a page is
available in the user journey table under the faro.performance.navigation event.
Press the chevron on the left side of the row to reveal the navigation timings panel.

The navigation timings panel provides insights to the load and rendering performance of the page alongside other useful information.
Summary
The summary row provides an overview about the whole duration of the navigation. This is useful to see at a glance about how much time each part takes in the whole navigation.
Metrics shown in this row:
Navigation Duration- how long the whole duration takesPage Load Time- the time to fetch and render the resourceTime To First Byte (TTFB)- the time between the request for a resource and when the first byte of the response arrivesNetwork- the time it takes from making the request till the response is loadedRender- time to parse and build the page (contains load handler execution time too).
It also shows useful metadata about the resource load like:
Cache Hit Status- tells if a resource is directly loaded from cache, loaded by a conditional fetch or is a full load.Possible values are:
cache: direct cache hitconditionalFetch: loaded via a 304fullLoad: loaded from the server
Protocol- The network protocol used to fetch the resourceBody (Compressed | Uncompressed)- The size of the request body compressed and uncompressedVisibility State- whether the navigation happened in the foreground or background.This useful because browsers prioritize visible/foreground work and tabs loaded in the background are usually slower.
Possible values are:
visibleandhidden
Network
The network row provides insights into how long each step involved loading a resource takes.
Metrics shown in this row:
Redirect- the time to follow all redirectsService Worker- Service Worker processing timeDNS Lookup- DNS lookup timeTCP Handshake- TCP handshake timeTSL Negotiation- TLS negotiation timeRequest- the time it takes send the requestResponse- how long it takes to read the response
Render
Document Parsing Time- the time to parse the HTML document and to construct the Document Object Model (DOM)Dom Processing Time- the time to load and process all resources after the document has been parsed and the Document Object Model (DOM) is build.OnLoad Time: the time it takes to process all registered load event handlers
Next steps
After analyzing sessions:
- Review errors to see which issues are affecting the most sessions
- Monitor performance to identify slow page loads or interactions
- Analyze HTTP requests to troubleshoot backend integration issues
- Filter by geolocation to understand regional user behavior patterns


