Getting started with Beyla
To reduce the time it takes to instrument an application and improve the adoption of Application Observability, Grafana built Beyla, an eBPF auto-instrumentation tool, that is able to report transactions span information, as well as RED metrics for Linux HTTP/S and gRPC services, without any application code or configuration changes.
eBPF overview
eBPF stands for Extended Berkeley Packet Filter, and allows attaching applications to different points of the Linux Kernel. eBPF applications run in privileged mode and allow the runtime information of the Linux Kernel to be inspected: system calls, network stack, as well as inserting probes in user space applications.
The eBPF applications are safe, they are compiled for their own Virtual Machine instruction set and run in a sandboxed environment that verifies each loaded eBPF program for memory access safety and finite execution time. Unlike older technologies, such as the natively-compiled Kprobes and Uprobes, there is no chance that a poorly programmed probe will cause the Linux Kernel to hang.
After being the eBPF binaries have been verified they are compiled with a Just-In-Time (JIT) compiler for the native host architecture (x86-64, ARM64, etc). This allows for efficient and fast execution.
The eBPF code is loaded from ordinary applications running in user space. The kernel and the user space applications can share information through a set of well defined communication mechanisms, which are provided by the eBPF specification. For example: ring buffers, arrays, hash maps, etc.

Running an instrumented service
For this quick start tutorial, instrument any HTTP, HTTPS or gRPC Go service that uses any of the following libraries:
- Standard
net/http - Gorilla Mux
- Gin
- gRPC-Go
HTTP and HTTPS services written in other languages can also be instrumented:
- Node.js (HTTP 1.1 and HTTPS with OpenSSL)
- Python (HTTP 1.1 and HTTPS with OpenSSL)
- Rust (HTTP 1.1 and HTTPS with OpenSSL)
- Ruby (HTTP 1.1 and HTTPS with OpenSSL)
- .NET Core 6+ (HTTP 1.1 and HTTPS with OpenSSL)
- Java (HTTP 1.1)
The HTTP 1.1 and OpenSSL support is generic, services written in different programming languages than those listed above might work, but haven’t been tested.
If you don’t have a service to instrument, create a server.go file with the following code:
package main

import (
	"net/http"
	"strconv"
	"time"
)

func handleRequest(rw http.ResponseWriter, req *http.Request) {
	status := 200
	for k, v := range req.URL.Query() {
		if len(v) == 0 {
			continue
		}
		switch k {
		case "status":
			if s, err := strconv.Atoi(v[0]); err == nil {
				status = s
			}
		case "delay":
			if d, err := time.ParseDuration(v[0]); err == nil {
				time.Sleep(d)
			}
		}
	}
	rw.WriteHeader(status)
}

func main() {
	http.ListenAndServe(":8080", http.HandlerFunc(handleRequest))
}
The code implements an HTTP service that accepts request on port 8080. The HTTP handler behavior can be specified with the following query parameters:
statuswill override the returned HTTP status code (which defaults to 200). For examplecurl -v "http://localhost:8080/foo?status=404"will return a 404 status code.delaywill artificially increase the service response time. For examplecurl "http://localhost:8080/bar?delay=3s"will take at least 3 seconds to complete.
Download the server.go file from this tutorial.
Run the test HTTP service with the following command:
go run server.goInstrument a service
Set up Beyla as a standalone linux process by following the standalone setup documentation.
First, we will locally check that Beyla is able to instrument the provided test server application, after configuring it to print the traces to the standard output.
Set environment variables and run Beyla:
BEYLA_PRINT_TRACES=true BEYLA_OPEN_PORT=8080 sudo -E beylaThe BEYLA_PRINT_TRACES=true configuration option tells Beyla to log any trace to the standard output.
The BEYLA_OPEN_PORT=8080 option tells Beyla to instrument the service that owns the port 8080.
Since Beyla requires administrator rights to load eBPF programs, the beyla command
must run with sudo -E (or as a root user).
After running the above command, you should see a log message confirming that the test service has been found:
time=2023-11-14T09:10:00.513Z level=INFO msg="instrumenting process"
component=discover.TraceAttacher cmd=/tmp/go-build898688565/b001/exe/server pid=8710
Now, open a new terminal and send a few HTTP GET calls to the test service:
curl -v "http://localhost:8080/hello"
curl -v "http://localhost:8080/bye"
For each request, Beyla will log trace information to the first terminal:
2023-11-14 09:11:13 (2.89ms[859.99µs]) 200 GET /hello
  [127.0.0.1]->[localhost:8080] size:0B svc=[{server go your-hostname-8710}]

2023-11-14 09:11:13 (1.87ms[191µs]) 200 GET /bye
  [127.0.0.1]->[localhost:8080] size:0B svc=[{server go your-hostname-8710}]
The output format is:
Request_time (response_duration) status_code http_method path
  source->destination request_size service_id
Experiment with the curl command and make additional requests to see how it affects the trace output. For example, the following request would send a 6-bytes POST request and the service will take 200ms to respond:
curl -X POST -d "abcdef" "http://localhost:8080/post?delay=200ms"Beyla will log the following trace information:
2023-11-14 09:12:49 (208.32ms[206.79ms]) 200 POST /post
[127.0.0.1]->[localhost:8080] size:6B svc=[{server go your-hostname-8710}]
Send data to Grafana Cloud
Once we have verified that our application is correctly instrumented, we can set up a Grafana Cloud OpenTelemetry exporter to read the generated traces and forward them to Grafana Cloud. You can get a Free Grafana Cloud Account at Grafana’s website.
For information on how to configure Beyla to submit data to other OpenTelemetry collectors, or how to generate Prometheus metrics, see the configuration options documentation.
There are two ways to forward your OpenTelemetry traces to Grafana Cloud:
- Using Grafana Alloy and configuring Beyla to forward the traces to it via the standard OpenTelemetry export.
- Configuring Beyla to submit data directly to the Grafana Cloud OpenTelemetry Protocol endpoint, as shown in this tutorial.
Running Grafana Beyla with your Grafana Credentials
In your Grafana Cloud Portal, click on the “Details” button in the “OpenTelemetry” box. Next, copy your Grafana OTLP Endpoint and Instance ID, as in the image below.
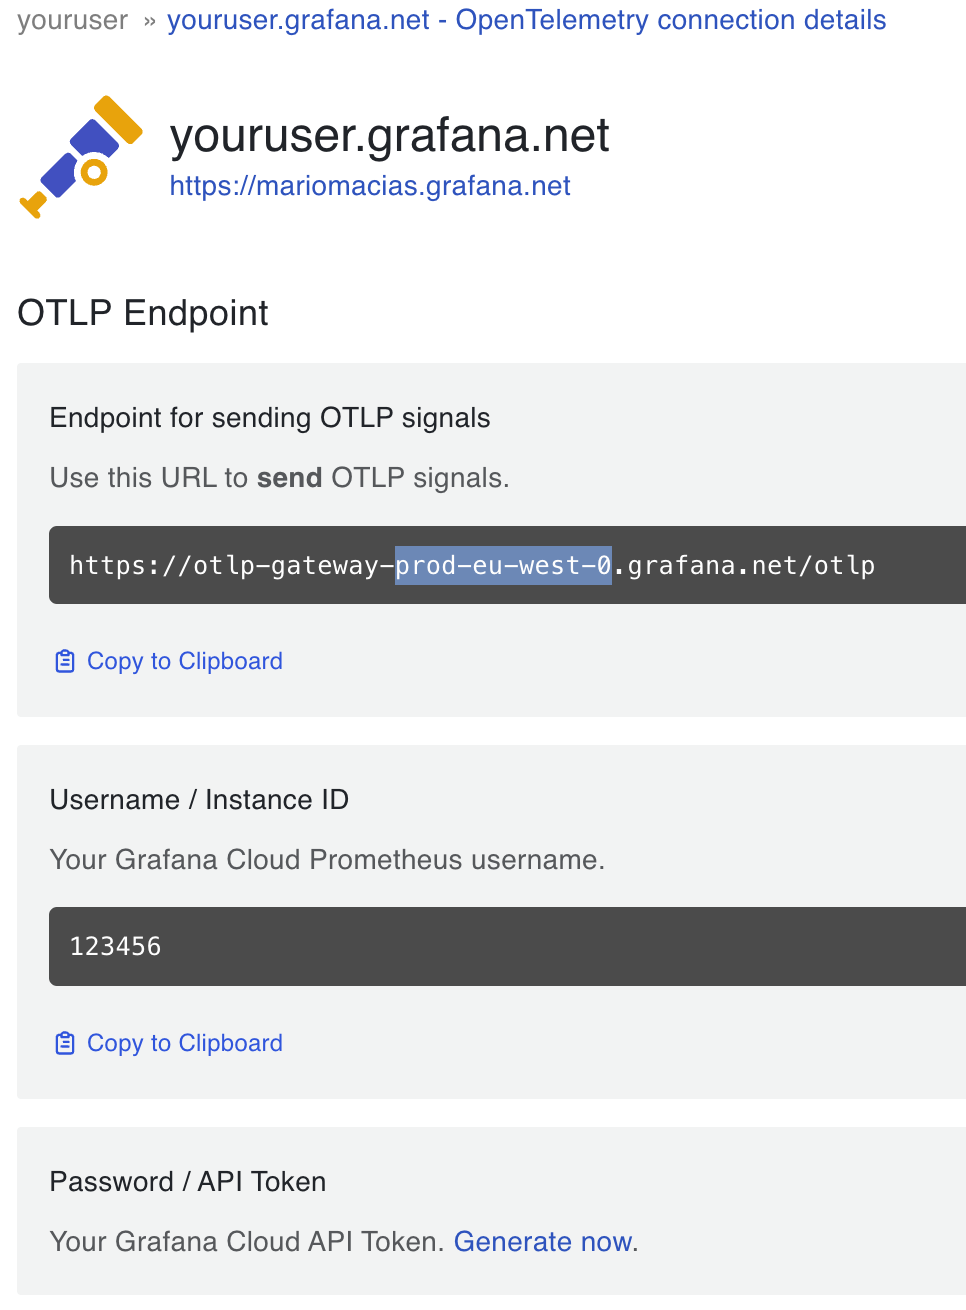
Also generate a Password/API token with metrics push privileges.
Now you can run Beyla by using the above information to set the
OTEL_EXPORTER_OTLP_ENDPOINT, GRAFANA_CLOUD_INSTANCE_ID and GRAFANA_CLOUD_API_KEY
environment variables.
The GRAFANA_CLOUD_SUBMIT environment variable (whose value defaults to traces)
lets you choose which type of data to submit to the Grafana OpenTelemetry endpoint:
metrics and/or traces. To make use of the metrics dashboard presented in the next section,
we will set GRAFANA_CLOUD_SUBMIT=metrics.
For example:
export OTEL_EXPORTER_OTLP_ENDPOINT=https://otlp-gateway-prod-eu-west-0.grafana.net/otlp
export GRAFANA_CLOUD_SUBMIT=metrics
export GRAFANA_CLOUD_INSTANCE_ID=123456
export GRAFANA_CLOUD_API_KEY="your api key here..."

BEYLA_OPEN_PORT=8080 sudo -E beyla
Optionally, open another terminal and run the following command to generate some artificial load:
while true; do curl -v "http://localhost:8080/service?delay=1s"; doneTo verify that metrics are properly received by Grafana, you can go to the left panel,
choose the Explore tab and your Prometheus data source. Next, write http_ in the
Metrics Browser input field and you should see the available metric names in the auto-complete drop-down.

Add the Beyla RED Metrics Dashboard
You could start composing your PromQL queries for better visualization of your auto-instrumented RED metrics; to save you time, we provide a sample public dashboard with some basic information.
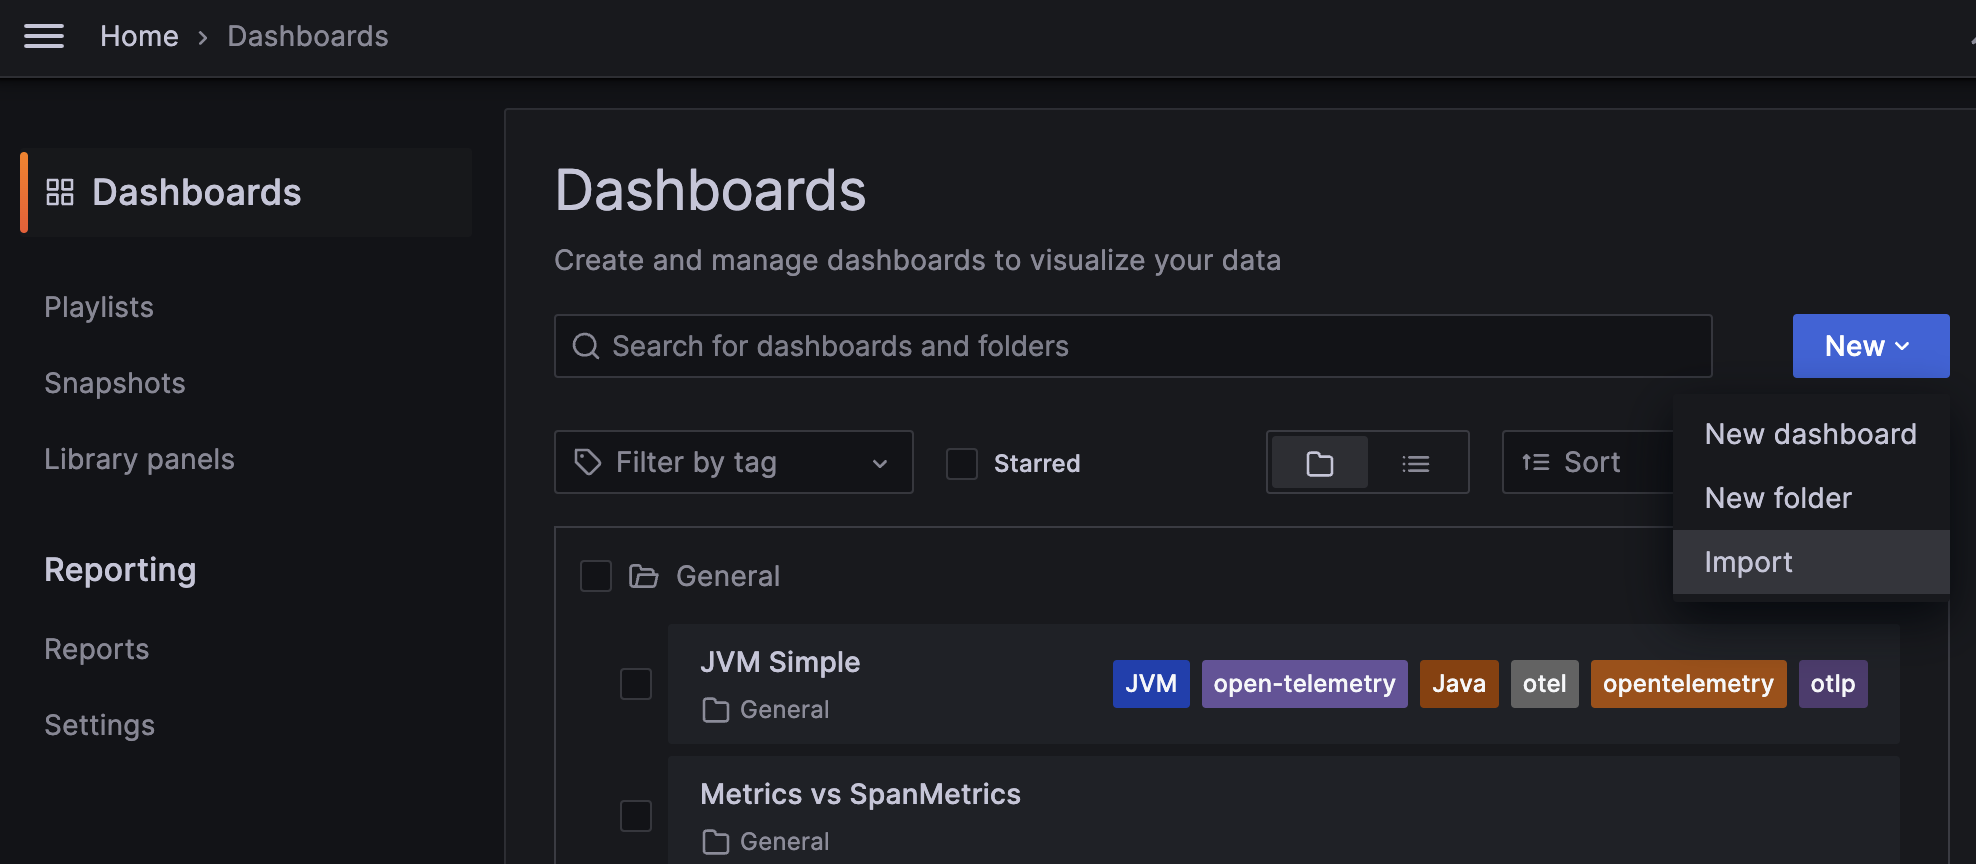
To import the sample dashboard into your Grafana instance, choose “Dashboards” in the Grafana left panel. Next, in the Dashboards page, click on the “New” drop-down menu and select “Import”:
In the “Import via grafana.com” textbox, copy the Grafana ID from the
Beyla RED Metrics
dashboard: 19923.
Rename the dashboard to match your service, select the folder and, most importantly, select the
data source in the prometheus-data-source drop-down at the bottom.
And voilà! you can see some of your test RED metrics:
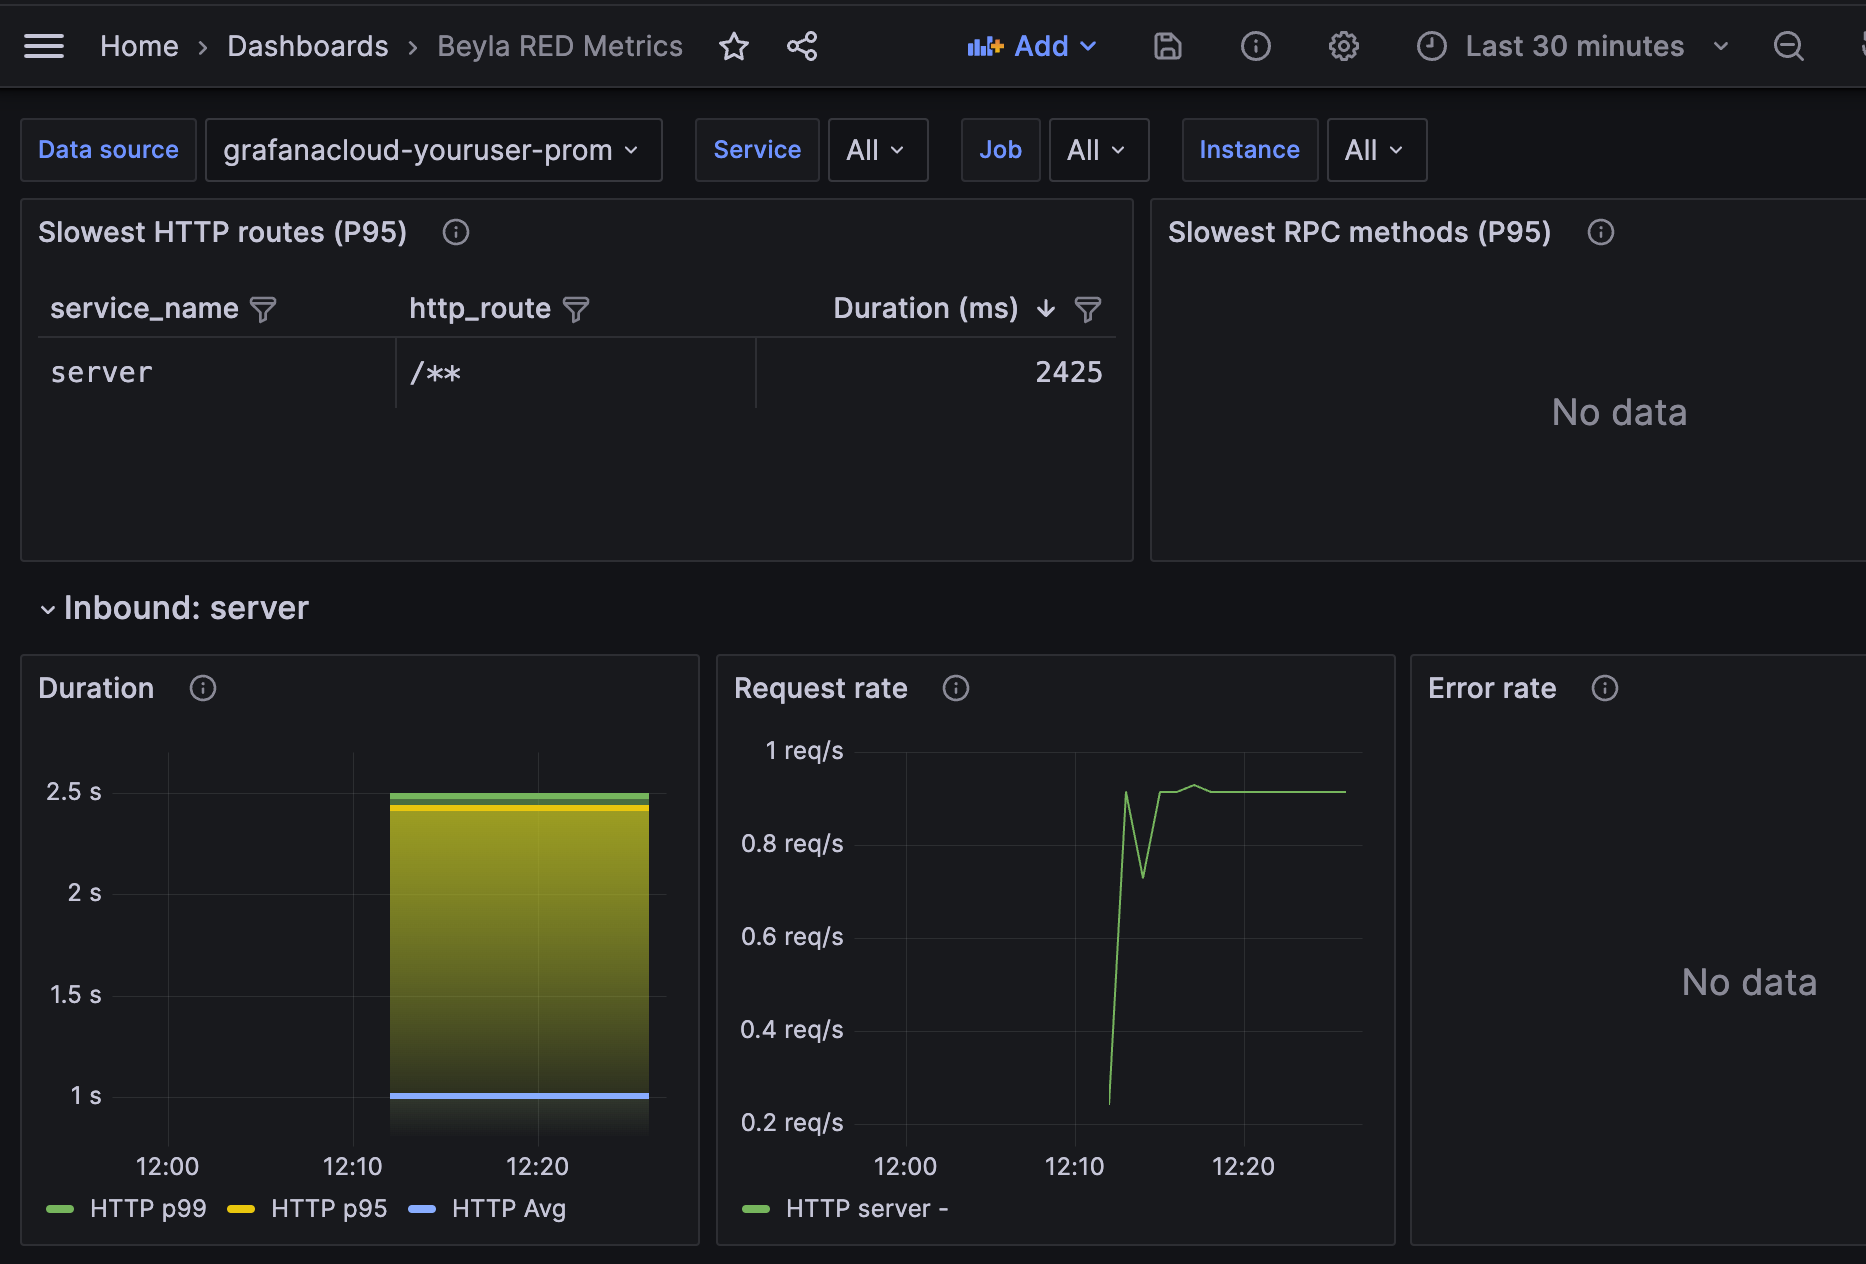
The dashboard contains the following components:
- A list with the slowest HTTP routes for all instrumented services. Since you only have a single service, only one entry appears. If you configure Beyla to report the HTTP routes, many entries could appear there, one for each HTTP path seen by the server.
- A list with the slowest GRPC methods. Since the test service in this tutorial only serves HTTP, this table is empty.
- For each instrumented service, a list of RED metrics for the inbound (server) traffic. This includes:
- Duration: average and top percentiles for both HTTP and gRPC traffic.
- Request rate: number of requests per second, faceted by its HTTP or gRPC return code.
- Error rate as a percentage of 5xx HTTP responses or non-zero gRPC responses over the total of the requests. They are faceted by return code.
- For each instrumented service, a list of RED metrics for the outbound (client) traffic. In
the above screenshot they are empty because the test service does not perform HTTP or gRPC
calls to other services.
- The Duration, Request Rate and Errors charts are analogues to the inbound traffic charts, with the only difference that 4xx return codes are also considered errors on the client side.
At the top of the chart, you can use the “Service” dropdown to filter the services you want to visualize.
Conclusions and future work
eBPF proved to be a low-overhead, safe, and reliable way to observe some basic metrics for HTTP/gRPC services. Beyla is not a replacement for language specific agents, however it significantly decreases the landing time of your application insights in Grafana. Beyla does not require any code changes, recompilation nor repackaging, simply run it together with your service, and your application metrics will start to flow.
eBPF also allows you to get deeper insights which manual instrumentation doesn’t. For example, Beyla is able to show you how much time a request is enqueued, after the connection is established, and before its code is actually executed (requires exporting OpenTelemetry traces, but this functionality is not explained in this tutorial).
Beyla has its limitations too. It only provides generic metrics and transaction level trace span information. Language agents and manual instrumentation is still recommended, so that you can specify the granularity of each part of the code to be instrumented, putting the focus on your critical operations.
Another limitation to consider is that Beyla requires
elevated privileges; not actually a root user, but at least it has to run with the
CAP_SYS_ADMIN capability. If you run the tool as a container (Docker, Kubernetes…), it
has to be privileged.
In the future, we plan to add metrics about other well-established protocols, like database or message queuing connections.
Distributed tracing is only supported for Go services, while other programming language support remains on the road-map. Distributed tracing can correlate requests from multiple services (web, database, messaging…). One complexity of distributed tracing is the injection of client-side headers and matching them to the context of the server-side requests. Each release is making progressive advances towards this goal.
Another shorter term goal is to reduce the surface of the code that requires administrative
privileges, executing a small eBPF loader with root or CAP_SYS_ADMIN privileges,
and running the rest of data processing/exposition with normal user privileges.
Was this page helpful?
Related resources from Grafana Labs