RCA workbench
RCA workbench streams all insights into a timeline, so that you can explore all potential causes for a particular issue correlated over time and dependency. You also have access to the relevant metrics, logs, traces, and profiles.
The typical troubleshooting process usually involves accessing dashboards, opening a metrics browser, adding metrics, and checking logs in multiple browser windows. Often, issues arise where the dashboards are outdated, you’re not sure which metrics to use, or it takes a significant amount of time just to focus on a specific time range.
The knowledge graph streamlines this process by automatically highlighting all system insights and providing additional context. By searching within graphs, you can identify the root cause of issues. For more in-depth troubleshooting, RCA workbench is available for manual analysis of insights.
RCA workbench provides the following benefits:
- Conveniently add or remove entities as needed
- Visualize insights on a timeline for causal investigation
- Access logs, traces, profiles, and other dashboards seamlessly
- Examine an entity graph to assess the impact of current issues and spatially correlate them
- Use a mind map to navigate insights based on category and type
Best practices before troubleshooting
RCA workbench is most effective when your observability setup already reflects real customer impact and service ownership.
- Alert on business impact first, not only on low-level symptoms.
- Expand telemetry coverage to improve entity discovery, relationship quality, and investigation depth.
- Ensure the affected services, infrastructure, and dependencies are all sending metrics into Grafana Cloud.
- Configure logs and traces where possible so you can validate hypotheses without leaving the investigation workflow.
More coverage makes the graph and RCA workbench more effective and helps surface a broader range of failure scenarios.
Open RCA workbench
Complete the following steps to open RCA workbench.
Sign into Grafana and select Observability > RCA workbench.
From the Frequently used menu, select Show all Services or Show all Nodes.
Configure display settings
RCA workbench provides display settings to customize the timeline view and control which insights appear. These settings help you focus on relevant insights and adjust the visualization behavior.
To access display settings, click the gear icon in the top right corner of RCA workbench.
The following table describes the available configuration options:
Show Entity with Insights
The Show Entity with Insights option is a filter toggle that controls which entities appear in the timeline. When enabled, RCA workbench hides entities with no active insights and displays only entities with at least one firing insight. This reduces clutter by filtering out healthy entities without issues.
When disabled, RCA workbench displays all entities regardless of whether they have insights. This is useful when you have many services loaded in the workbench but want to focus only on the ones with actual issues. Use the disabled state when you want to compare healthy entities against problematic ones or verify that certain entities remain stable during an incident.
Hide Insights older than
The Hide Insights older than option is a time threshold filter that hides insights that started firing before a specified cutoff. This setting accepts a duration value such as 1 hour, 6 hours, or 1 day. Insights that began firing before this threshold don’t appear in the timeline.
This filter reduces noise from long-running pre-existing issues. It lets you focus on insights that are new or recent relative to your investigation window. For example, when investigating a specific incident, you can filter out older unrelated insights that clutter the view.
Setting this to a shorter duration like 6 hours shows only insights that started within the last 6 hours.
Setting a longer duration like 48 hours includes insights from the last two days.
Hide Insights present more than
The Hide Insights present more than option is a percentage-based filter that hides insights based on how much of the selected time range they’ve been active. This setting accepts a percentage value between 0 and 100. Insights that are present for more than this percentage of the selected time range don’t appear in the timeline.
For example, if you select a 4-hour time range and set this filter to 90, insights that have been active for more than 90% of those 4 hours (3.6 hours) are hidden.
This filter differs from Hide Insights older than:
- Hide Insights older than filters by start time (when the insight first fired)
- Hide Insights present more than filters by percentage of time present in the selected range
This filter is useful for filtering out chronic, long-running issues that persist throughout most of the selected time range. For example, if an insight is present for 95% of your investigation window, it’s likely a known background issue rather than a new problem related to your current incident. Hiding it lets you focus on insights that appear intermittently or for shorter periods within your selected range.
Setting this to 2 hours hides insights that have been continuously firing for more than 2 hours.
Setting this to 24 hours filters out insights active for more than a day.
Display env label
The Display env (site) label option is a display toggle that controls whether environment and site scope labels appear beneath each entity name in the timeline.
When enabled, each entity displays its environment and site values beneath the entity name.
For example, you might see fced69 / otel-demo displayed under a service row.
This helps distinguish entities from different environments or sites when multiple environments appear in the same view. When disabled, the scope labels are hidden for a cleaner and more compact view. Disable this setting when working within a single environment or when you want to reduce visual clutter.
Chart tooltip
The Chart tooltip option sets the tooltip behavior when hovering over charts in the timeline. This controls how information displays when you move your cursor over timeline data points.
The available tooltip modes are:
- Default: Tooltip appears only for the specific row or insight you’re hovering over, with no crosshair across other rows.
- Shared Line: Shows a vertical crosshair line across all entity rows at the hovered timestamp, but tooltip data appears per-row individually.
- Shared Tooltip: Shows the crosshair line and a combined tooltip popup with data from all visible rows at that timestamp, allowing you to compare insight states across services at the same point in time.
Use Shared Tooltip for incident investigation when you want to correlate exactly when multiple services fired insights simultaneously. Use Shared Line when you want time alignment across rows but prefer individual tooltips. Use Default for focused investigation of individual entity metrics without crosshair indicators.
Search entities with insights
The Search Entities with Insights option is a filter mode for the entity selector dropdown. When enabled, it pre-filters search results to show only entities that currently have active insights. This filters what entities are available to add to the workbench, not what’s already displayed.
This is distinct from the Show Entity with Insights setting which filters entities already on the workbench. The Search Entities with Insights option filters what you see when browsing or searching in the entity selector dropdown.
To use this filter:
Click the search icon in the top right corner of RCA workbench.
Enable the Search Entities with Insights toggle.
Click the entity selector dropdown such as Show all Services.
When you type a service name or browse the dropdown, you see only entities with active insights rather than every entity in your environment.
This is useful during active incidents when you want to quickly find and add only affected services to the workbench. Without this filter, you might need to wade through hundreds of healthy entities to find the ones with issues.
Filter entities by attributes
The Filter panel lets you narrow down which entities and insights are shown in the workbench timeline. This helps you isolate specific services, insight categories, or other criteria when the workbench has many entities.
To access the Filter panel:
- Click the filter icon in the top right corner of RCA workbench.
The Filter panel displays available filter categories based on insight and entity labels and attributes. Common filter categories include:
- __grafana_origin: Filters by the source plugin that generated the insight such as
plugin/grafana-asserts-appfor insights from the Asserts app. - alertname: Filters by insight rule name such as
ErrorRatioBreachorLatencyBreach. - asserts_alert_category: Filters by insight category such as
error,saturation, oranomaly. - asserts_entity_name: Filters to specific services by name such as
payment,fraud-detection, ormysql. - asserts_entity_type: Filters by entity type such as
Service,Node, orPod. - asserts_env: Filters by environment identifier.
To apply filters:
In the Filter panel, use the Search filter box to quickly find a specific label value within the list.
Expand a filter category to view available values.
Select one or more values by clicking the checkboxes.
The timeline updates automatically to show only entities and insights matching the selected filters.
To clear all filters, click Clear All at the top of the Filter panel.
When you select multiple values within the same category, entities matching any of those values appear in the timeline. When you select values across different categories, only entities matching all selected criteria appear.
These filters work on the active insights shown in the timeline.
For example, selecting error under asserts_alert_category shows only entities with error-related insights.
Selecting specific services under asserts_entity_name isolates those services in the timeline.
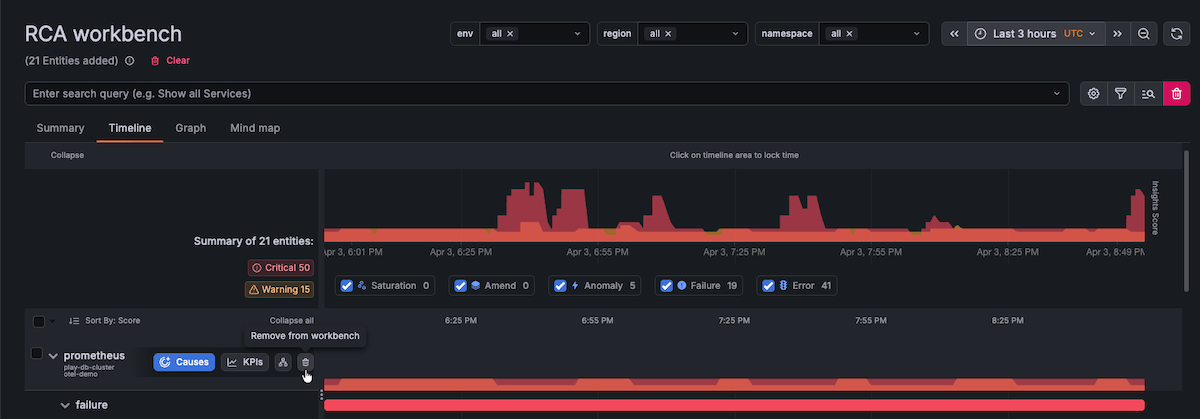
Remove entities from the Timeline
You may find that RCA workbench includes more entities than necessary for troubleshooting based on your query. For instance, if you choose Show all services, all services are added, potentially overwhelming you with too much information for effective troubleshooting. To streamline your troubleshooting efforts, you can remove entities from the Timeline, allowing you to focus on the specific entities you want to investigate.
Removing entities from the Timeline is beneficial when you notice a recurring pattern with a particular subset of entities and want to eliminate other irrelevant entities from your investigation.
To remove entities from the Timeline, perform the following steps:
Click Timeline.
Hover over an entity you want to remove and select the checkbox.
Click the delete icon to remove the entity from the workbench.
![Remove entities]()
Use the Timeline to perform root cause analysis
The Timeline equips you with the necessary tools for conducting root cause analysis. After you have adjusted the list of entities by adding or removing them, you can use the Timeline to focus on a particular time period, determine the sequence in which insights were triggered, and access logs, traces, profiles, and other dashboards.
To use the Timeline view to perform root cause analysis, complete the following steps:
Use the time picker to select the time range you want to investigate.
A good starting point is to begin slightly before the first customer-visible symptom so you can identify the trigger and understand the blast radius.
On the graph, click and drag on insights to zoom in.
Zooming in provides a clearer view of the insights that have fired.
![Zoom in on insights]()
You might need to zoom in more than once. The following image shows a view of the insights that have fired on the frontend service between 08:48 AM and 12:41 AM.
![Zoom in on insights]()
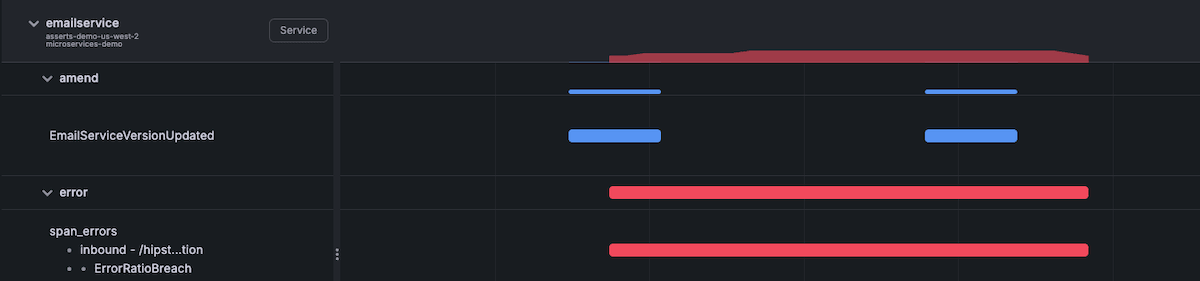
Expand the entities on the left to show each insight in the timeline view.
While showing each insight in the timeline view, you can investigate insight patterns and sequencing.
This helps you understand what failed first, what failed next, and which dependencies were affected.
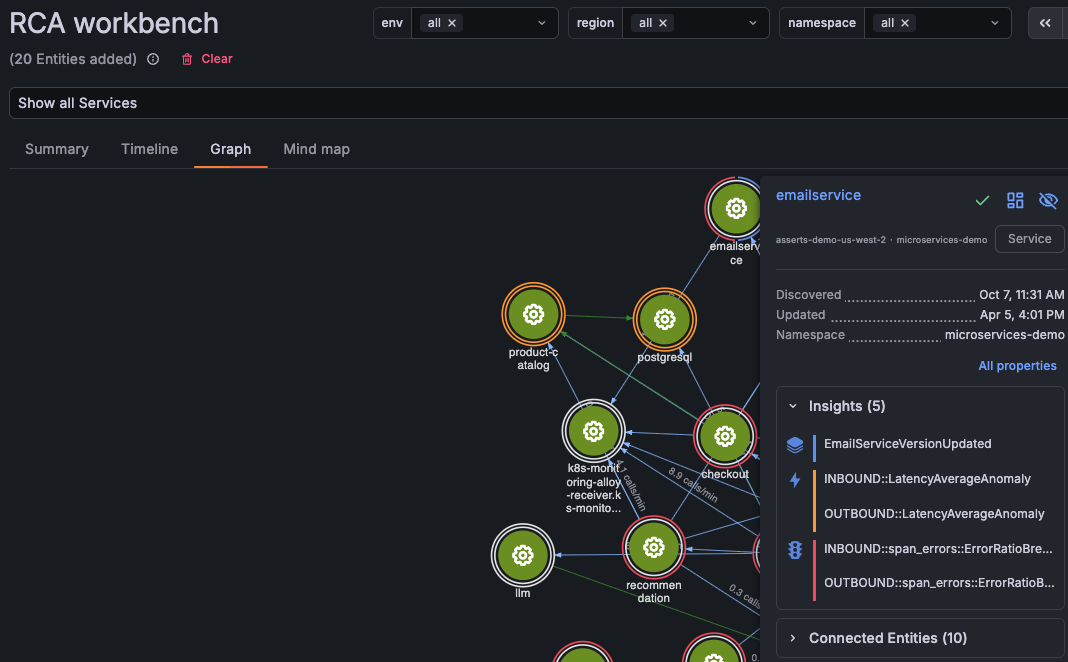
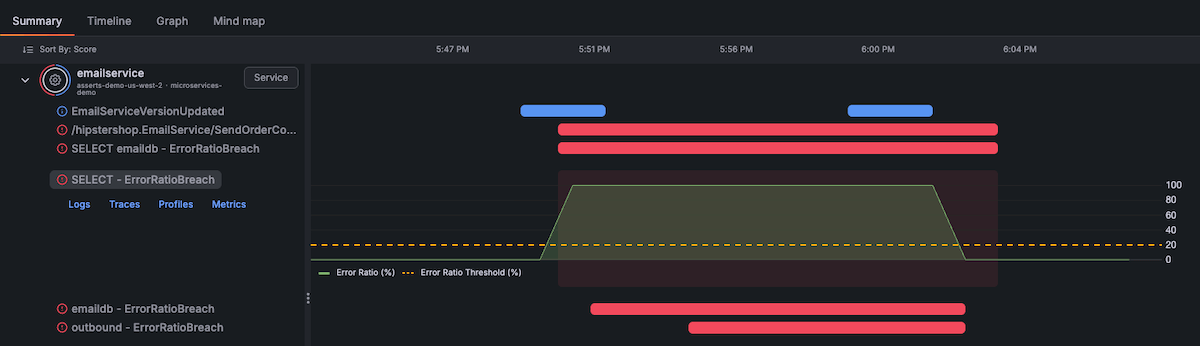
The following image shows that the email service experienced an amend and an error insight at approximately the same time, indicating that a service update might have triggered the errors experienced by the service.
![Add insights]()
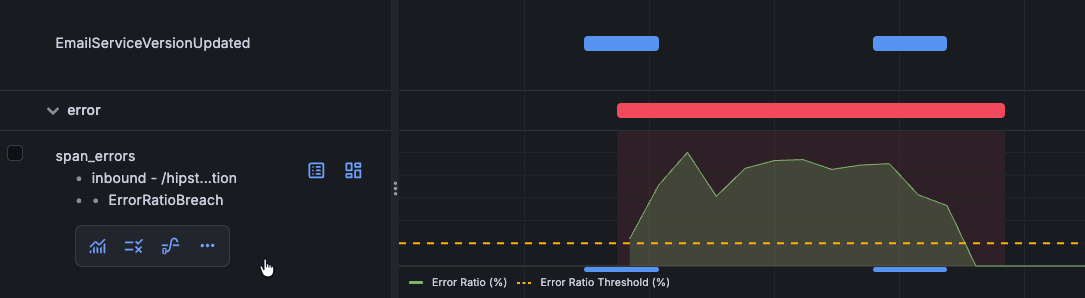
To investigate further, click an insight in the left panel.
This shows associated metrics in the Timeline.
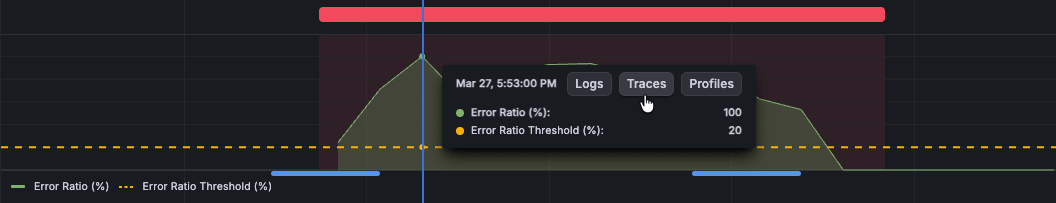
The following image shows that the error log rate breach steadily increased above the threshold after the amend insight fired on the email service.
![Error log rate breach]()
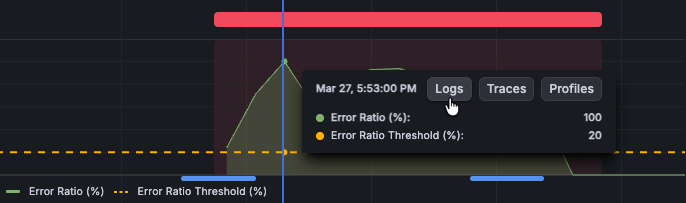
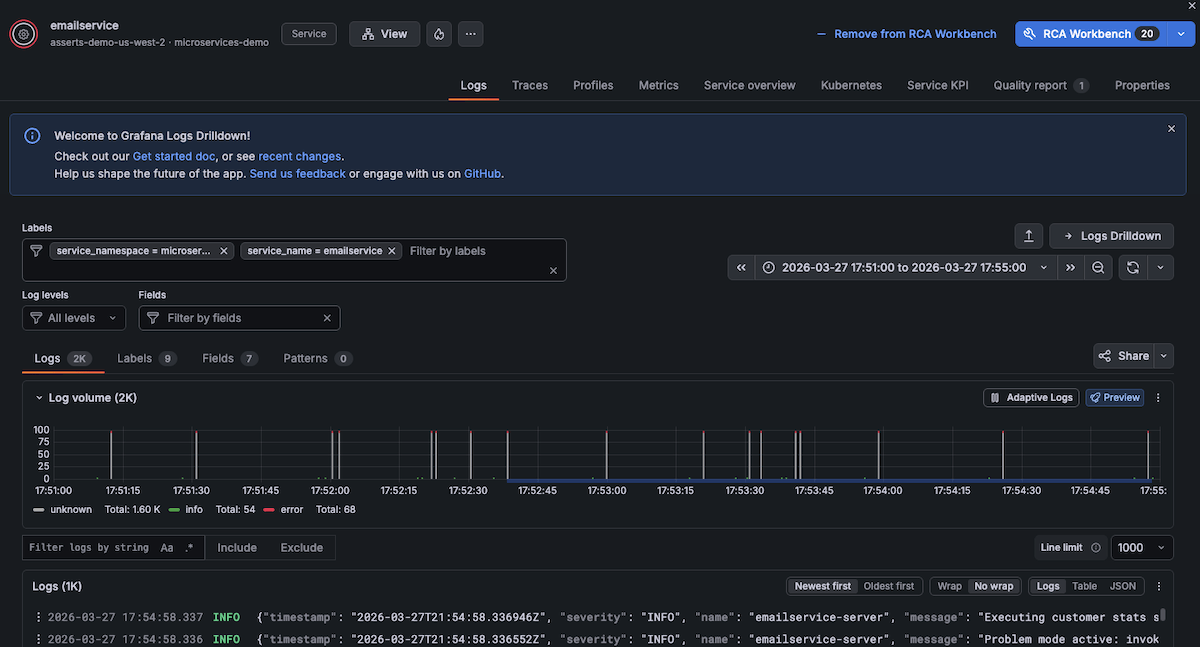
To navigate to logs, click a point in time on the Timeline and click Logs.
![Navigate to logs]()
A drawer opens showing the Logs tab, which includes the capabilities of Logs Drilldown contextualized for the selected entity with preset filters. This enables you to:
- Find and filter entity logs by labels, fields, and patterns
- Drill into data using volume and text patterns
- Uncover related logs and monitor changes over time
- Interact with formatted log data
You can accomplish these tasks without writing any LogQL queries.
![View log detail]()
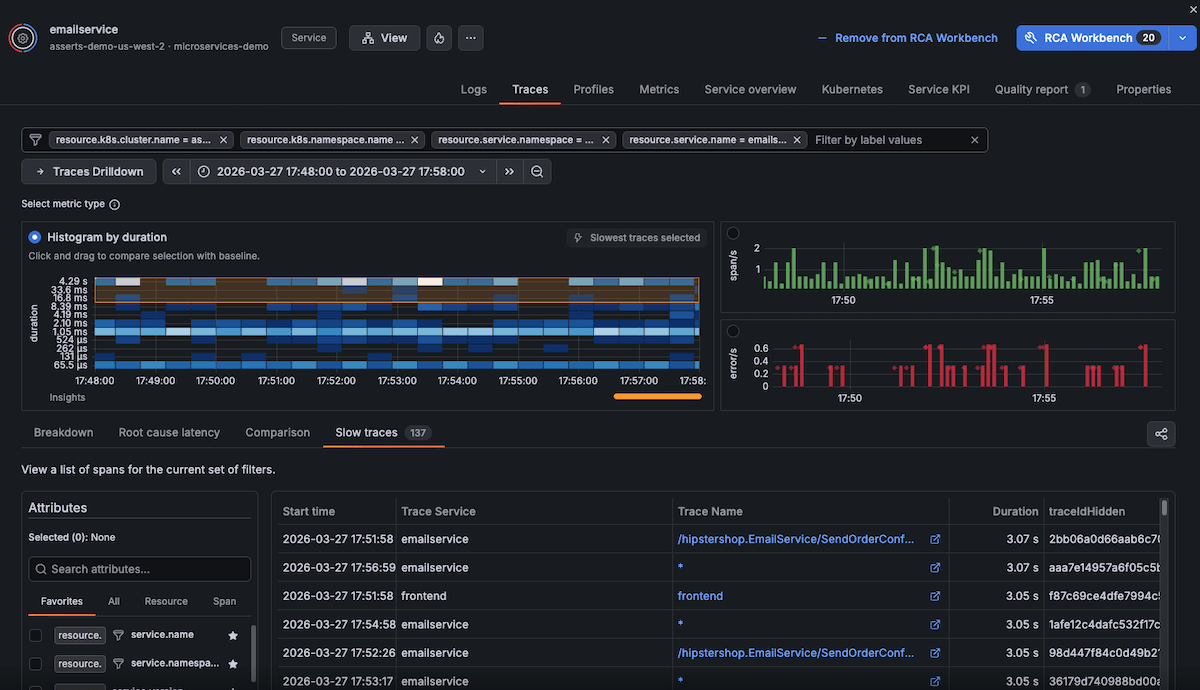
To navigate to traces, click a point in time on the Timeline and click Traces.
![Navigate to traces]()
A drawer opens showing the traces associated with the point in time you selected. You can click any traces to understand more or open Traces Drilldown.
![View trace details]()
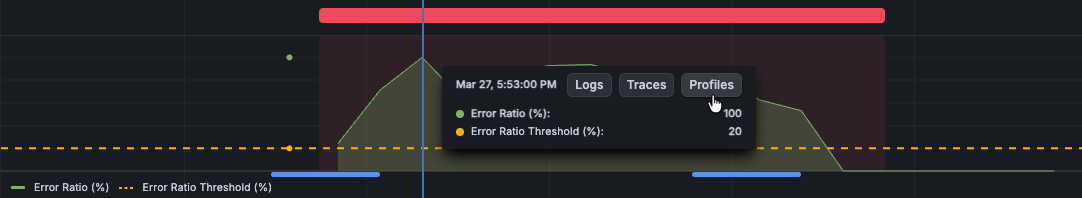
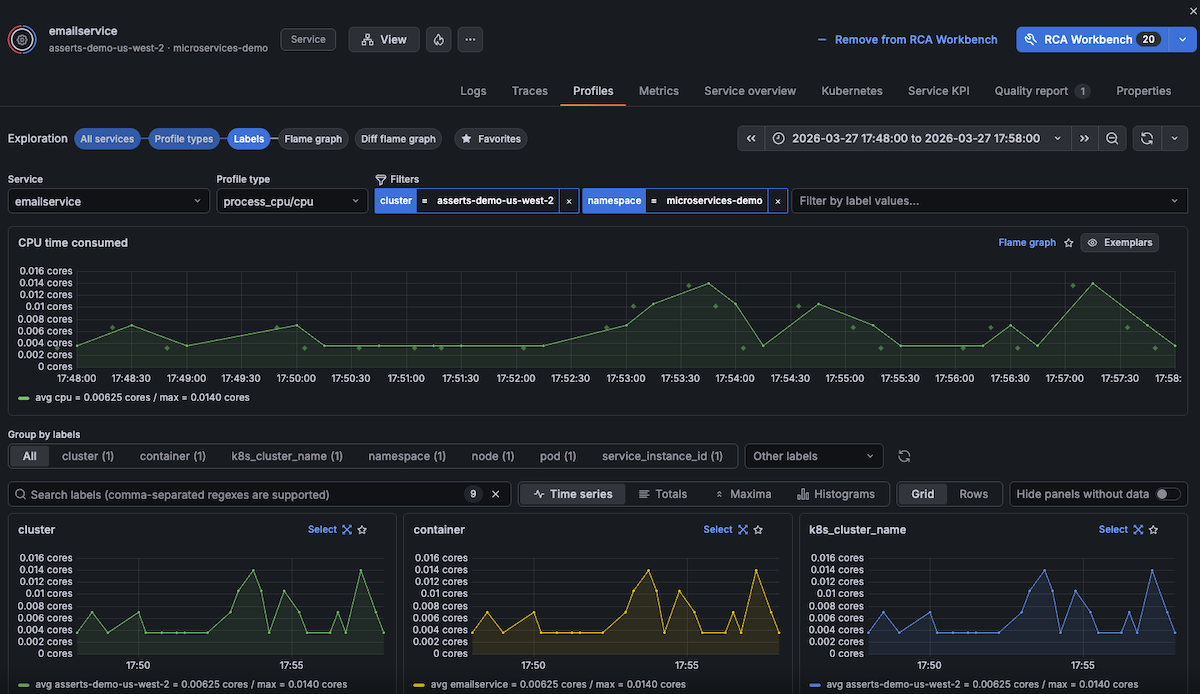
To navigate to profiles, click a point in time on the Timeline and click Profiles.
![Navigate to profiles]()
A drawer opens showing the Profiles tab with continuous profiling data for the selected entity. You can view CPU and memory profiles to identify performance bottlenecks and resource consumption patterns.
![View profile details]()


Understand insight grouping
RCA workbench organizes insights hierarchically to help you identify patterns and relationships between issues. The grouping structure differs between Timeline and Summary views.
Timeline view grouping
The Timeline view uses hierarchical grouping to organize insights by their relationships and context. When you expand an entity, insights are grouped in the following order:
- Insight category - Groups insights by type such as
error,saturation, oranomaly. - Context type - Groups by the source context such as
span_errorsfor trace-based errors. - Request context - Groups by the specific request or operation such as
outbound - flagdorPOST /v1/logs. - Insight name - Shows the specific insight such as
ErrorRatioBreachorLatencyBreach.
This hierarchical structure helps you understand which insights share common contexts.
For example, multiple ErrorRatioBreach insights affecting the same outbound call are grouped together.
To navigate the grouping hierarchy:
Click Timeline.
Expand an entity to reveal the insight category level.
Expand a category to reveal the context type level.
Continue expanding to drill down to specific insights.
Use the Collapse and Collapse all options to collapse groupings and focus on higher-level patterns.
Summary view grouping
The Summary view provides a flatter organization compared to the Timeline view. Insights appear directly under each entity with their request context and insight name combined.
For example, you might see:
flagd.evaluation.v1.Service/EventStream... - ErrorRatioBreachPOST /v1/logs - ErrorRatioBreachmysql - ErrorRatioBreach
This compact format lets you quickly scan all insights across entities without expanding multiple levels. Use the Summary view when you want an overview of all active insights rather than detailed sequencing and patterns.
Manage insights
When you expand an entity in the Timeline view, each insight displays action icons for investigation and configuration.
Entity-level actions (icons to the right of the entity name):
- View properties - Display entity metadata and properties
- View KPIs - Open KPI dashboards for the entity
Insight-level actions (icons next to each insight):
- Open chart - View the insight’s metrics in a detailed chart
- View rules - Display the rule definition for the insight
- View insight details - Show detailed information about the insight
- More options menu (…) - Access additional actions:
- Update threshold - Modify the threshold that triggers the insight
- Notify - Configure notifications for the insight
- Suppress - Temporarily disable the insight from firing
These actions help you investigate individual insights, adjust sensitivity, and manage alerting behavior directly from the Timeline.
Navigate to entity details
From the Timeline or Summary view, you can navigate directly to entity details for deeper investigation.
When you select an entity, action buttons appear:
- Causes - Analyzes the insights on the selected entity and automatically adds related entities that are potential root causes to the workbench
- KPIs - Opens the entity details page:
- For Service entities - Opens the Service overview tab with RED metrics, health targets, and performance indicators
- For Pod or Node entities - Opens the Kubernetes tab with infrastructure metrics, resource utilization, and capacity information
- Show Connected Entities - Adds all entities directly connected to the selected entity to the workbench, helping you expand your investigation to include dependencies and relationships
From entity details, you can access all telemetry tabs (Logs, Traces, Profiles, Metrics, Kubernetes metrics, Properties) and add the entity to RCA workbench for multi-entity investigation.
View an entity graph
From within RCA workbench you can view an entity graph to assess the impact of current issues and spatially correlate them. The Graph view shows all entities as interconnected nodes, helping you understand service dependencies and relationships.
To view the entity graph, click Graph.
Explore entity connections
Click any entity node in the graph to open a details panel showing:
- Entity metadata (discovered date, last updated, namespace)
- Active insights
- Connected entities grouped by relationship type (for example, pods, services)
- Troubleshoot in Workbench button to add the entity to your investigation
Use the zoom controls at the bottom of the graph to adjust the view:
- Zoom slider for precise control
- Plus and minus buttons for incremental zoom
- Full-screen button for expanded view
Preview the entity graph
From the Summary or Timeline view, you can open a graph preview overlay without leaving your current view.
Click Open graph preview to display an entity graph showing all entities and their connections in the current time window. The preview shows entity relationships and health status, allowing you to quickly identify which services are connected.
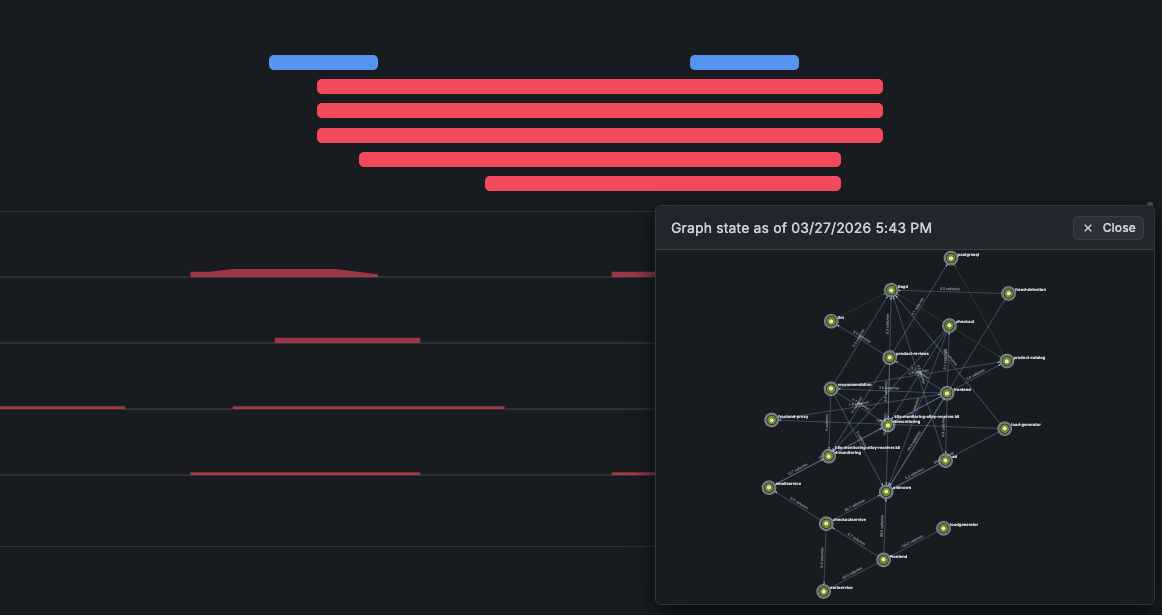
Click Close (×) to return to the Summary or Timeline view.
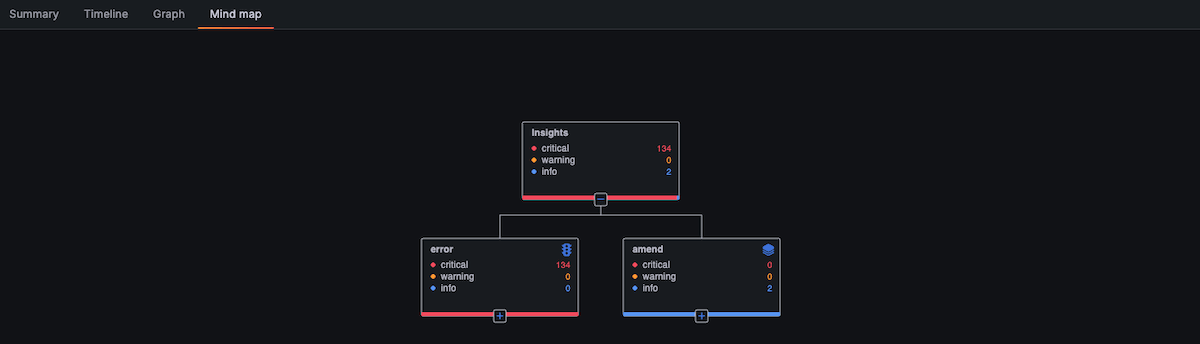
Navigate an insight mind map
Instead of using entities to navigate to insights, you can use a mind map to navigate from insights to entities. This view helps you identify common problems across many different entities.
Within RCA workbench, click Mind map.
Expand the nodes of the mind map to view entities with the same insights.
Get AI-powered analysis
From any view in RCA workbench, you can use Grafana Assistant to analyze the current state of your investigation.
Click Analyze RCA Workbench to open Grafana Assistant with context about:
- Active entities and their insights
- Timeline patterns and correlations
- Suggested investigation paths
Grafana Assistant can help you:
- Identify root causes from insight patterns
- Prioritize which entities to investigate
- Understand relationships between failures
- Generate queries for deeper analysis
The AI analysis considers the current time range, active filters, and entity selection to provide relevant recommendations.
Refer to Grafana Assistant in RCA workbench for details on using @ mentions, natural language queries, best practices, and troubleshooting.
Summary view
The Summary view summarizes all insights at the service or node level which enables you to quickly scan through all insights. Unlike the Timeline, you don’t need to expand each entity to see which insights fired.
On the Summary view, you can:
- View an entity graph together with a timeline view
- Explore relevant metrics in the timeline
- Navigate to metrics, logs, and traces dashboards
- Get a concise view of all the insights firing on problematic entities
Used in these workflows
RCA workbench is the primary tool for:
- Investigate incidents across multiple entities - Correlate insights, metrics, and logs across services and infrastructure
- Track changes and their effects - Analyze correlations between deployments and performance degradation


