
Identify entities for analysis
The Asserts overview page functions like a news feed, allowing you to gather information that’s important to you. With just a quick look, you can gain insight into the current status of your systems and determine which entities require additional analysis.
This feature highlights any critical areas in the system, enabling you to address them promptly. By default, the overview page showcases the health status of the top services and nodes, with a focus on those that have the highest number of assertions and require immediate attention.
The Asserts overview page contains the following sections:
Service Health: The Service Health panel displays the top Service Level Objectives (SLOs) based on the ones experiencing issues. By clicking on a specific SLO, you can access more detailed information within the Service Health dashboard.
Notifications: The Notifications panel displays a list of notifications that are firing. Notifications are set up for each SLO, but you also have the option to create additional notifications.
- My watched queries: You have the option to choose a predefined query or create a custom query to generate a list of all entities that fall within your area of responsibility. By default, the Asserts dashboard displays entities with the highest number of assertions at the top.

Navigate from Service Health to RCA Workbench
Follow these steps to troubleshoot any issues that you identify when reviewing the Service Health panel on the Asserts dashboard.
Before you begin
Before you begin, ensure you have defined SLOs.
Sign in to Grafana Cloud and click Asserts.
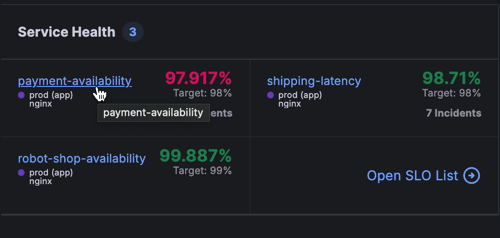
On the Service Health panel, click an SLO that you want to investigate.
![Grafana panel showing SLO below the 98% threshold]()
The SLO opens in the Service Health page.
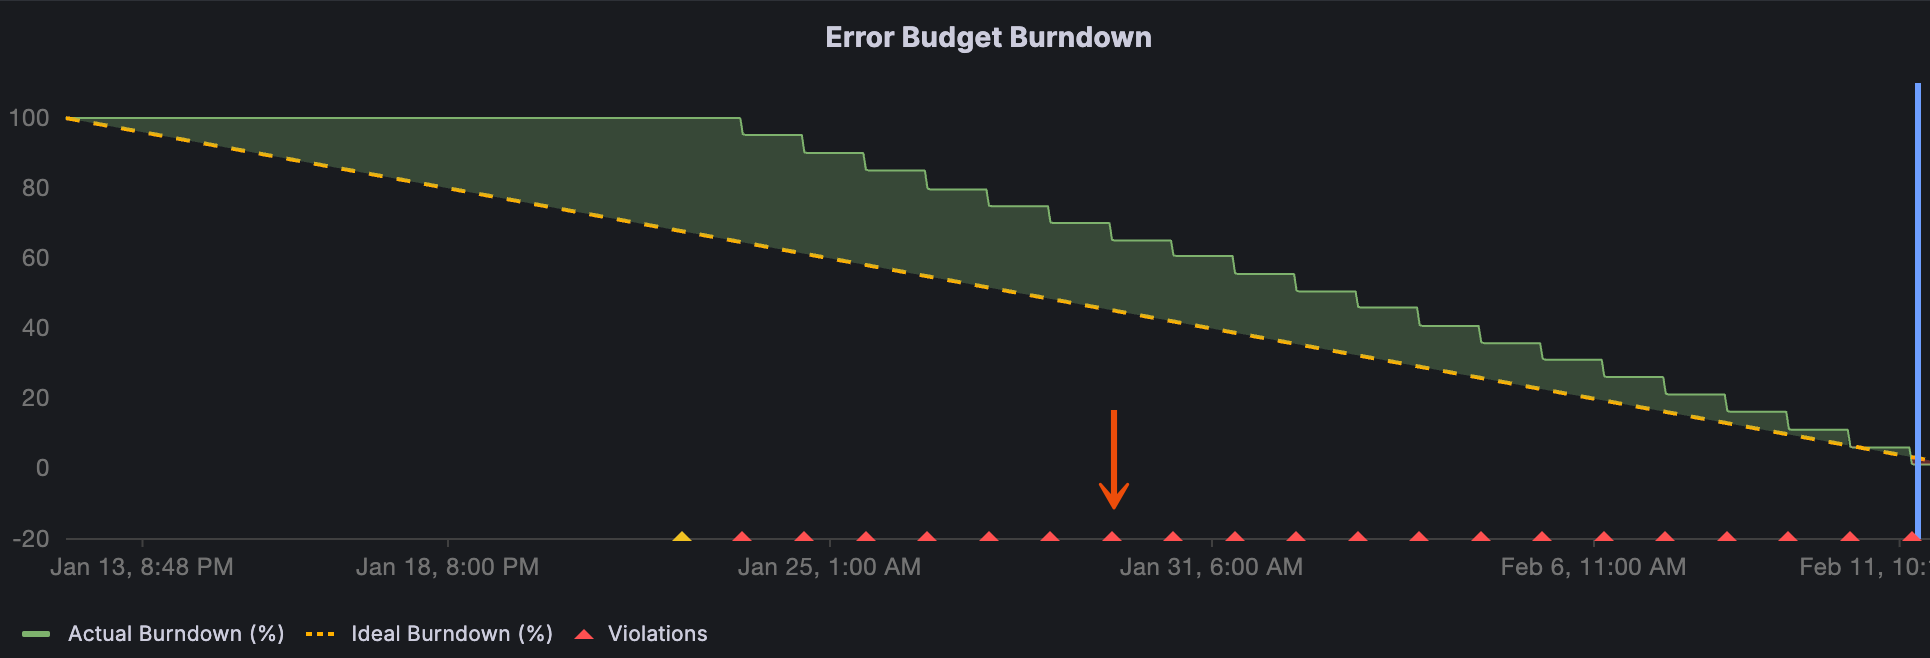
Review the Service Health dashboard and for any anomaly that you want to investigate further in RCA Workbench, click the Violations icon.
![Grafana panel showing Error Budget Burndown chart]()
The selected data appears in RCA Workbench.
Use RCA Workbench to conduct root cause analysis.
Navigate from Notifications to RCA Workbench
Follow these steps to troubleshoot any issues that you identify when reviewing the Notifications panel on the Asserts dashboard.
Sign in to Grafana Cloud and click Asserts.
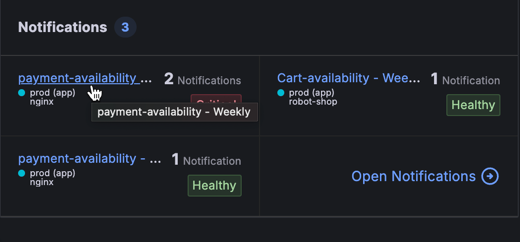
On the Notifications panel, click a notification that you want to investigate.
![Grafana panel showing a critical notification]()
The notification opens in the Notifications page.
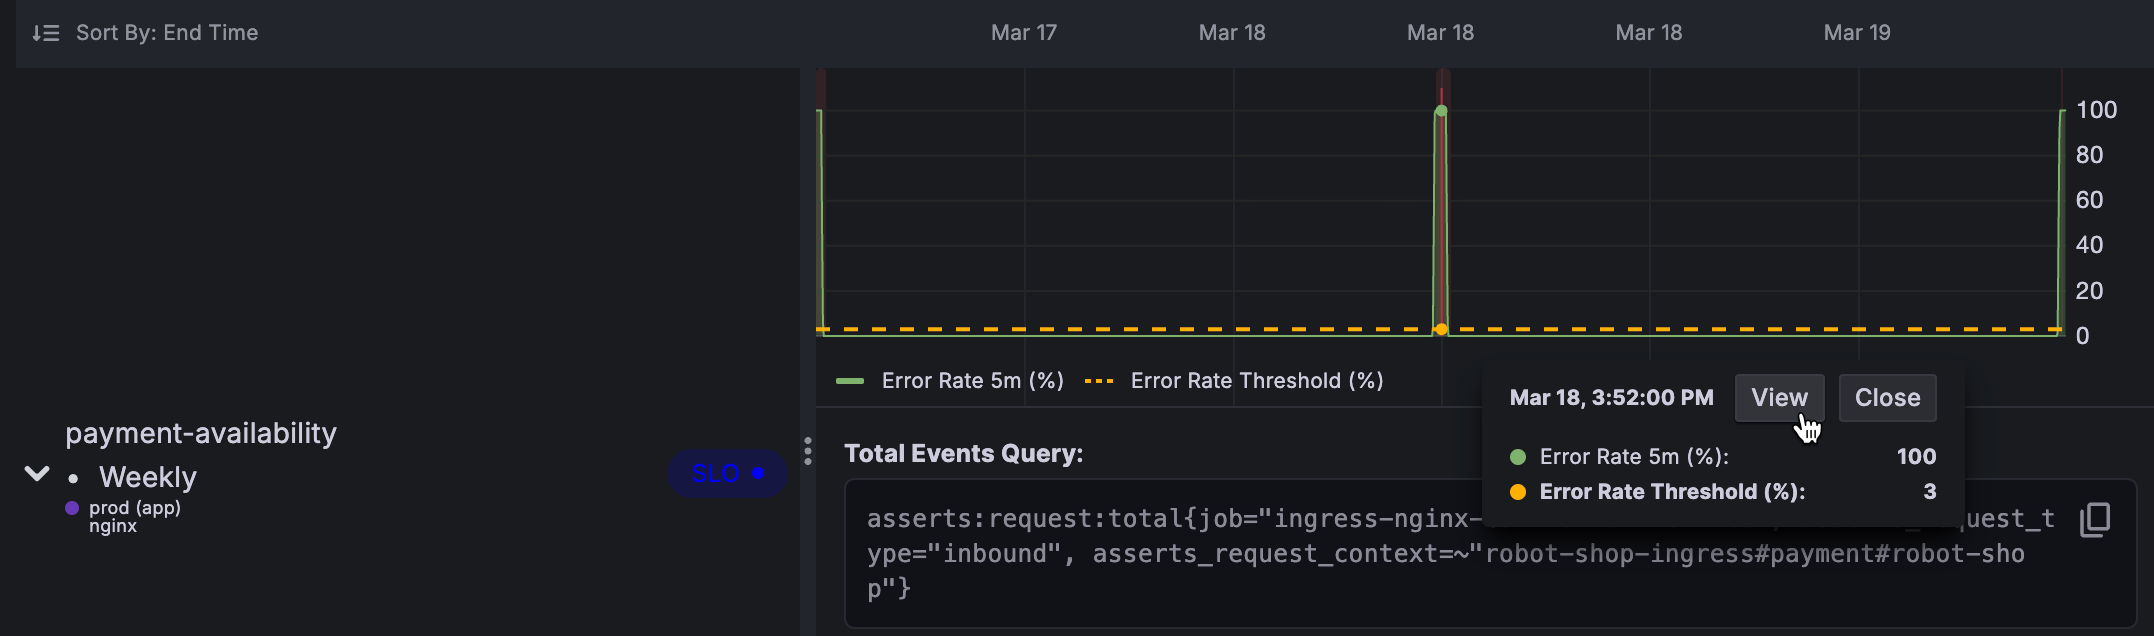
Click a location on the timeline and click View.
![Grafana panel showing a point on the timeline selected]()
Use RCA Workbench to conduct root cause analysis.
Was this page helpful?
Related resources from Grafana Labs


