
Configure Node exporter to generate Prometheus metrics
Documentation Grafana Cloud
Monitor applications
Asserts
Enable metrics collection
Infrastructure
Node
Grafana Cloud
Monitor applications
Asserts
Enable metrics collection
Infrastructure
Node
Grafana Cloud
Configure Node exporter to generate Prometheus metrics
To configure nodes to generate Prometheus metrics, install the the Node Exporter.
Metrics and KPIs
Alerts
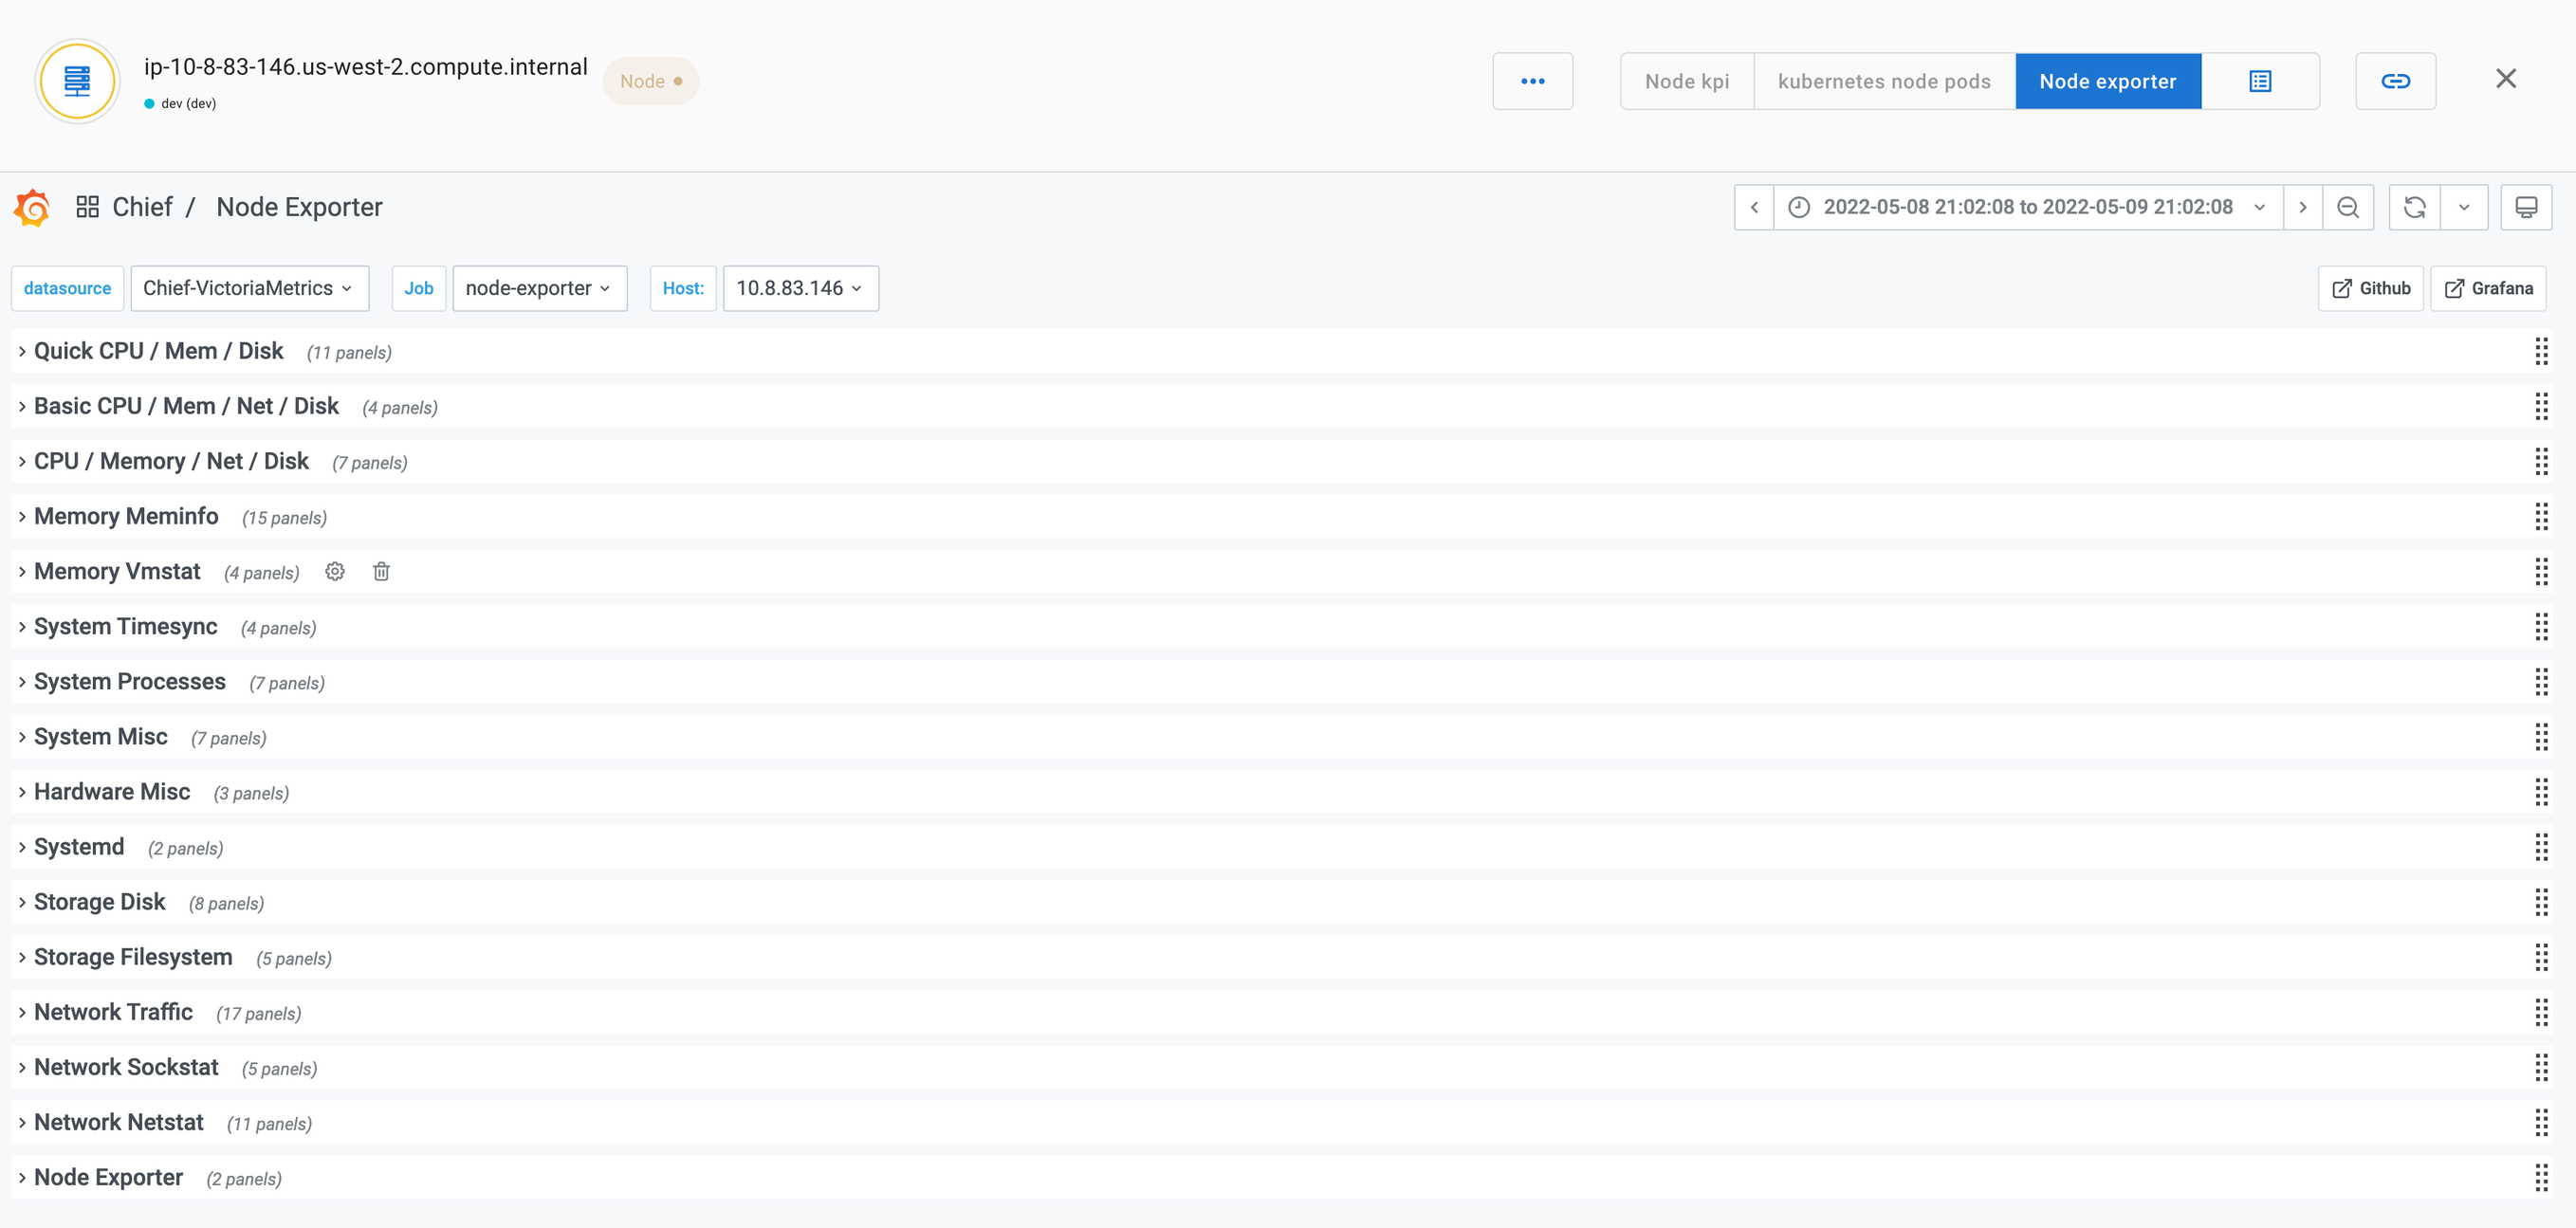
Dashboard
The following dashboard shows Node KPIs.
Was this page helpful?
Related resources from Grafana Labs
5 Mar

Getting started with managing your metrics, logs, and traces using Grafana
In this webinar, we’ll demo how to get started using the LGTM Stack: Loki for logs, Grafana for visualization, Tempo for traces, and Mimir for metrics.
26 Feb

Intro to Kubernetes monitoring in Grafana Cloud
In this webinar you’ll learn how Grafana offers developers and SREs a simple and quick-to-value solution for monitoring their Kubernetes infrastructure.
60 min

Building advanced Grafana dashboards
In this webinar, we’ll demo how to build and format Grafana dashboards.