Configure Redis exporter to generate Prometheus metrics
Use redis exporter to enable Prometheus metrics for Redis. To confirm you configured the exporter correctly, ensure the following metrics are available in Prometheus.
- redis_up
- redis_uptime_in_seconds
Request, error, and latency metrics
Resource metrics
Alerts
Failure alerts
RedisDown: Redis instance is down
1redis_up != 1
RedisUptimeReset: Redis instance restarted
1delta(redis_uptime_in_seconds[5m]) < 0
RedisMasterLinkDown: Redis master link down
1( 2 avg_over_time(redis_master_link_up[10m]) 3 and on (instance) 4 redis_instance_info{role=“slave”} 5) == 0
RedisReplicationBroken: Redis instance lost a replica
1delta(redis_connected_slaves[1m]) < 0
RedisClusterFlapping: Changes have been detected in Redis replica connection
1changes(redis_connected_slaves[5m]) > 2
RedisRejectedConnections: Some connections to Redis have been rejected
1rate(redis_rejected_connections_total[1m]) * 60 > 0
RedisMissingMaster: Redis Master Missing
1count by (job, service, redis_mode, namespace,) 2 (redis_instance_info{role=“master”}) == 0
RedisTooManyMasters: Standalone and HA setup should only have one master
1count by (job, service, namespace) 2 (redis_instance_info{role=“master”, redis_mode=“standalone”}) > 1
RedisTooFewMastersInCluster: Redis cluster mode should have every instance in the role of “master”
1avg by (job, service, namespace) (redis_cluster_size) 2- 3count by (job, service, namespace) 4 (redis_instance_info{role=“master”, redis_mode=“cluster”}) 5> 0
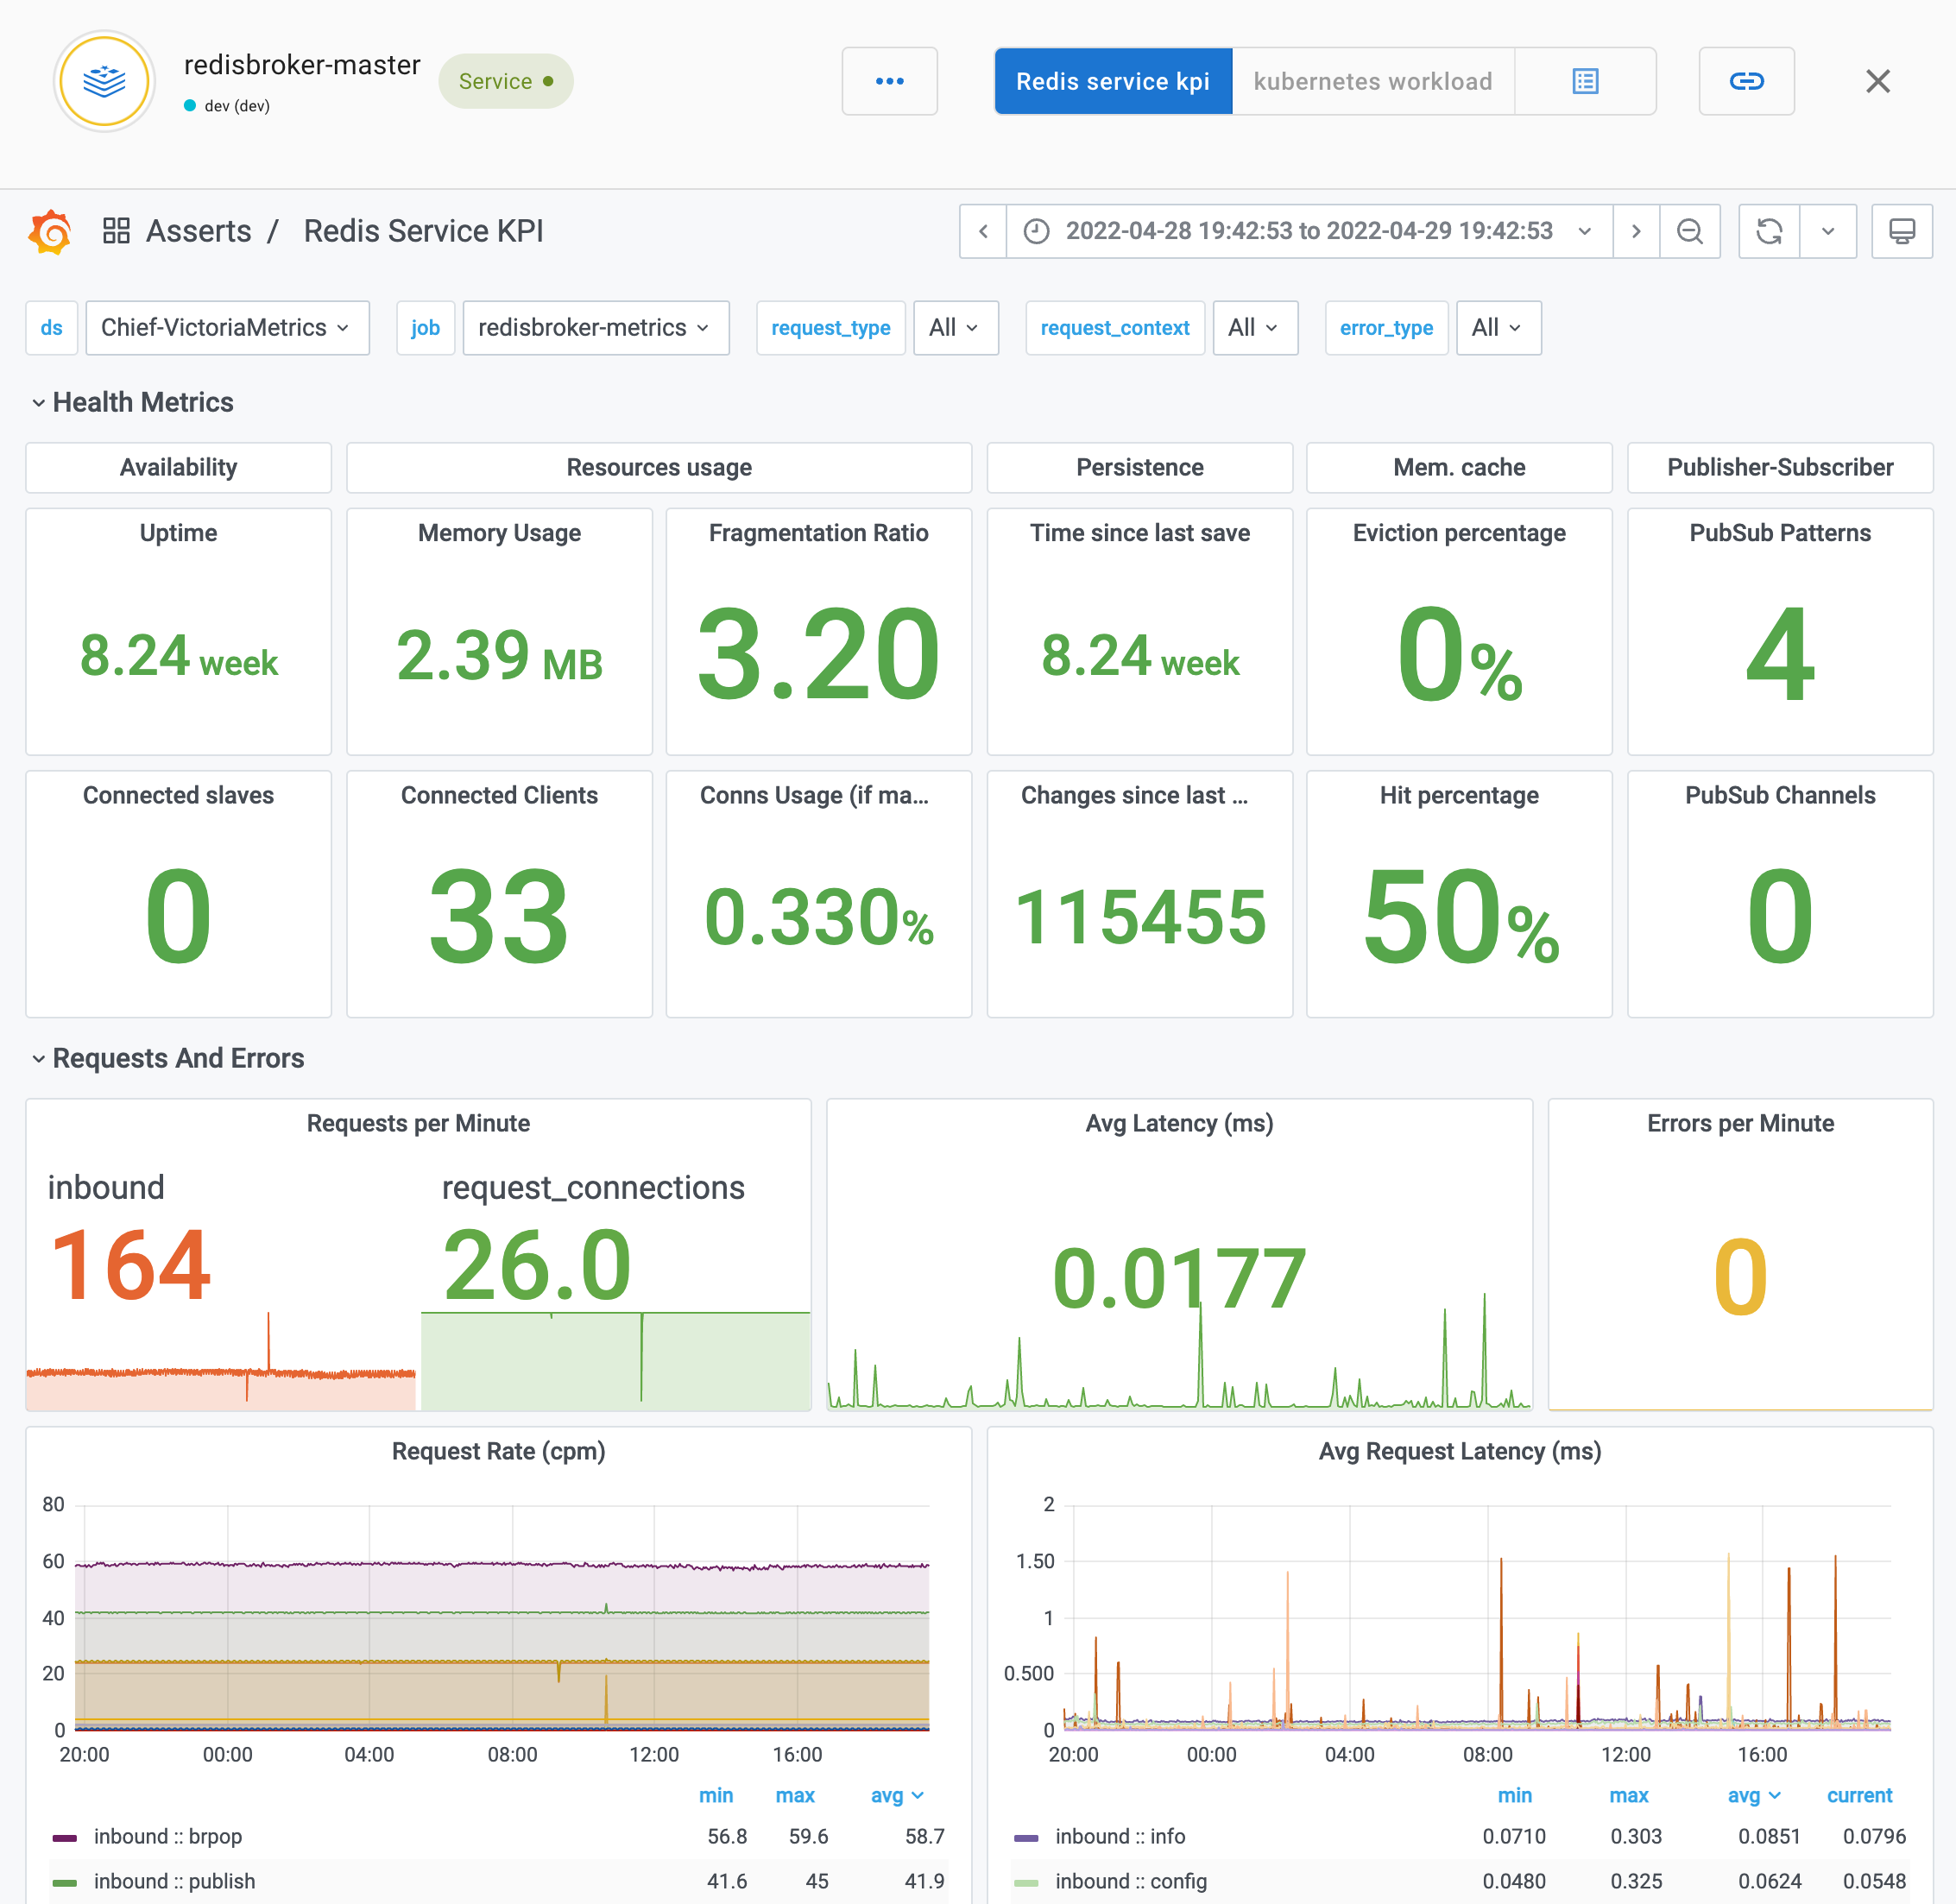
KPI dashboard
The following dashboard shows Redis KPIs.
Was this page helpful?
Related resources from Grafana Labs