Configure the MySQL exporter to generate Prometheus metrics
To enable the Prometheus metric for MySQL, use the mysqld_exporter. You can either run MySQL exporter using an environment variable or using the docker.
To configure MySQL exporter to generate Prometheus metrics, perform the following steps:
To run the MySQL exporter using an environment variable, run the following command.
export DATA_SOURCE_NAME=‘user:password@(hostname:3306)/’
./mysqld_exporterTo run the MySQL exporting using Docker, run the following command.
docker network create my-mysql-network
docker pull prom/mysqld-exporterdocker run -d
-p 9104:9104
--network my-mysql-network
-e DATA_SOURCE_NAME=“user:password@(hostname:3306)/”
prom/mysqld-exporterTo enable flags on the exporter, refer to mysqld_exporter.
To confirm that the exporter is attached to the MySQL server, ensure the following metrics are available in Prometheus.
mysql_version_infomysql_global_status_connections
Request and error metrics
Resource metrics
Alerts
Failure alerts
MySQLDown: MySQL is not running
mysql_up != 1
MySqlRestarted: MySQL server restarted
mysql_global_status_uptime < 60
MySqlSlowQueries: MySQL queries are running slow
rate(mysql_global_status_sloq_queries[1m]) * 60 > 0
MysqlSlaveSqlThreadNotRunning: MySQL slave is not running even though it is enabled
mysql_slave_status_master_server_id > 0 and on (instance, asserts_env, asserts_site) mysql_slave_status_slave_sql_running == 0
Dashboards
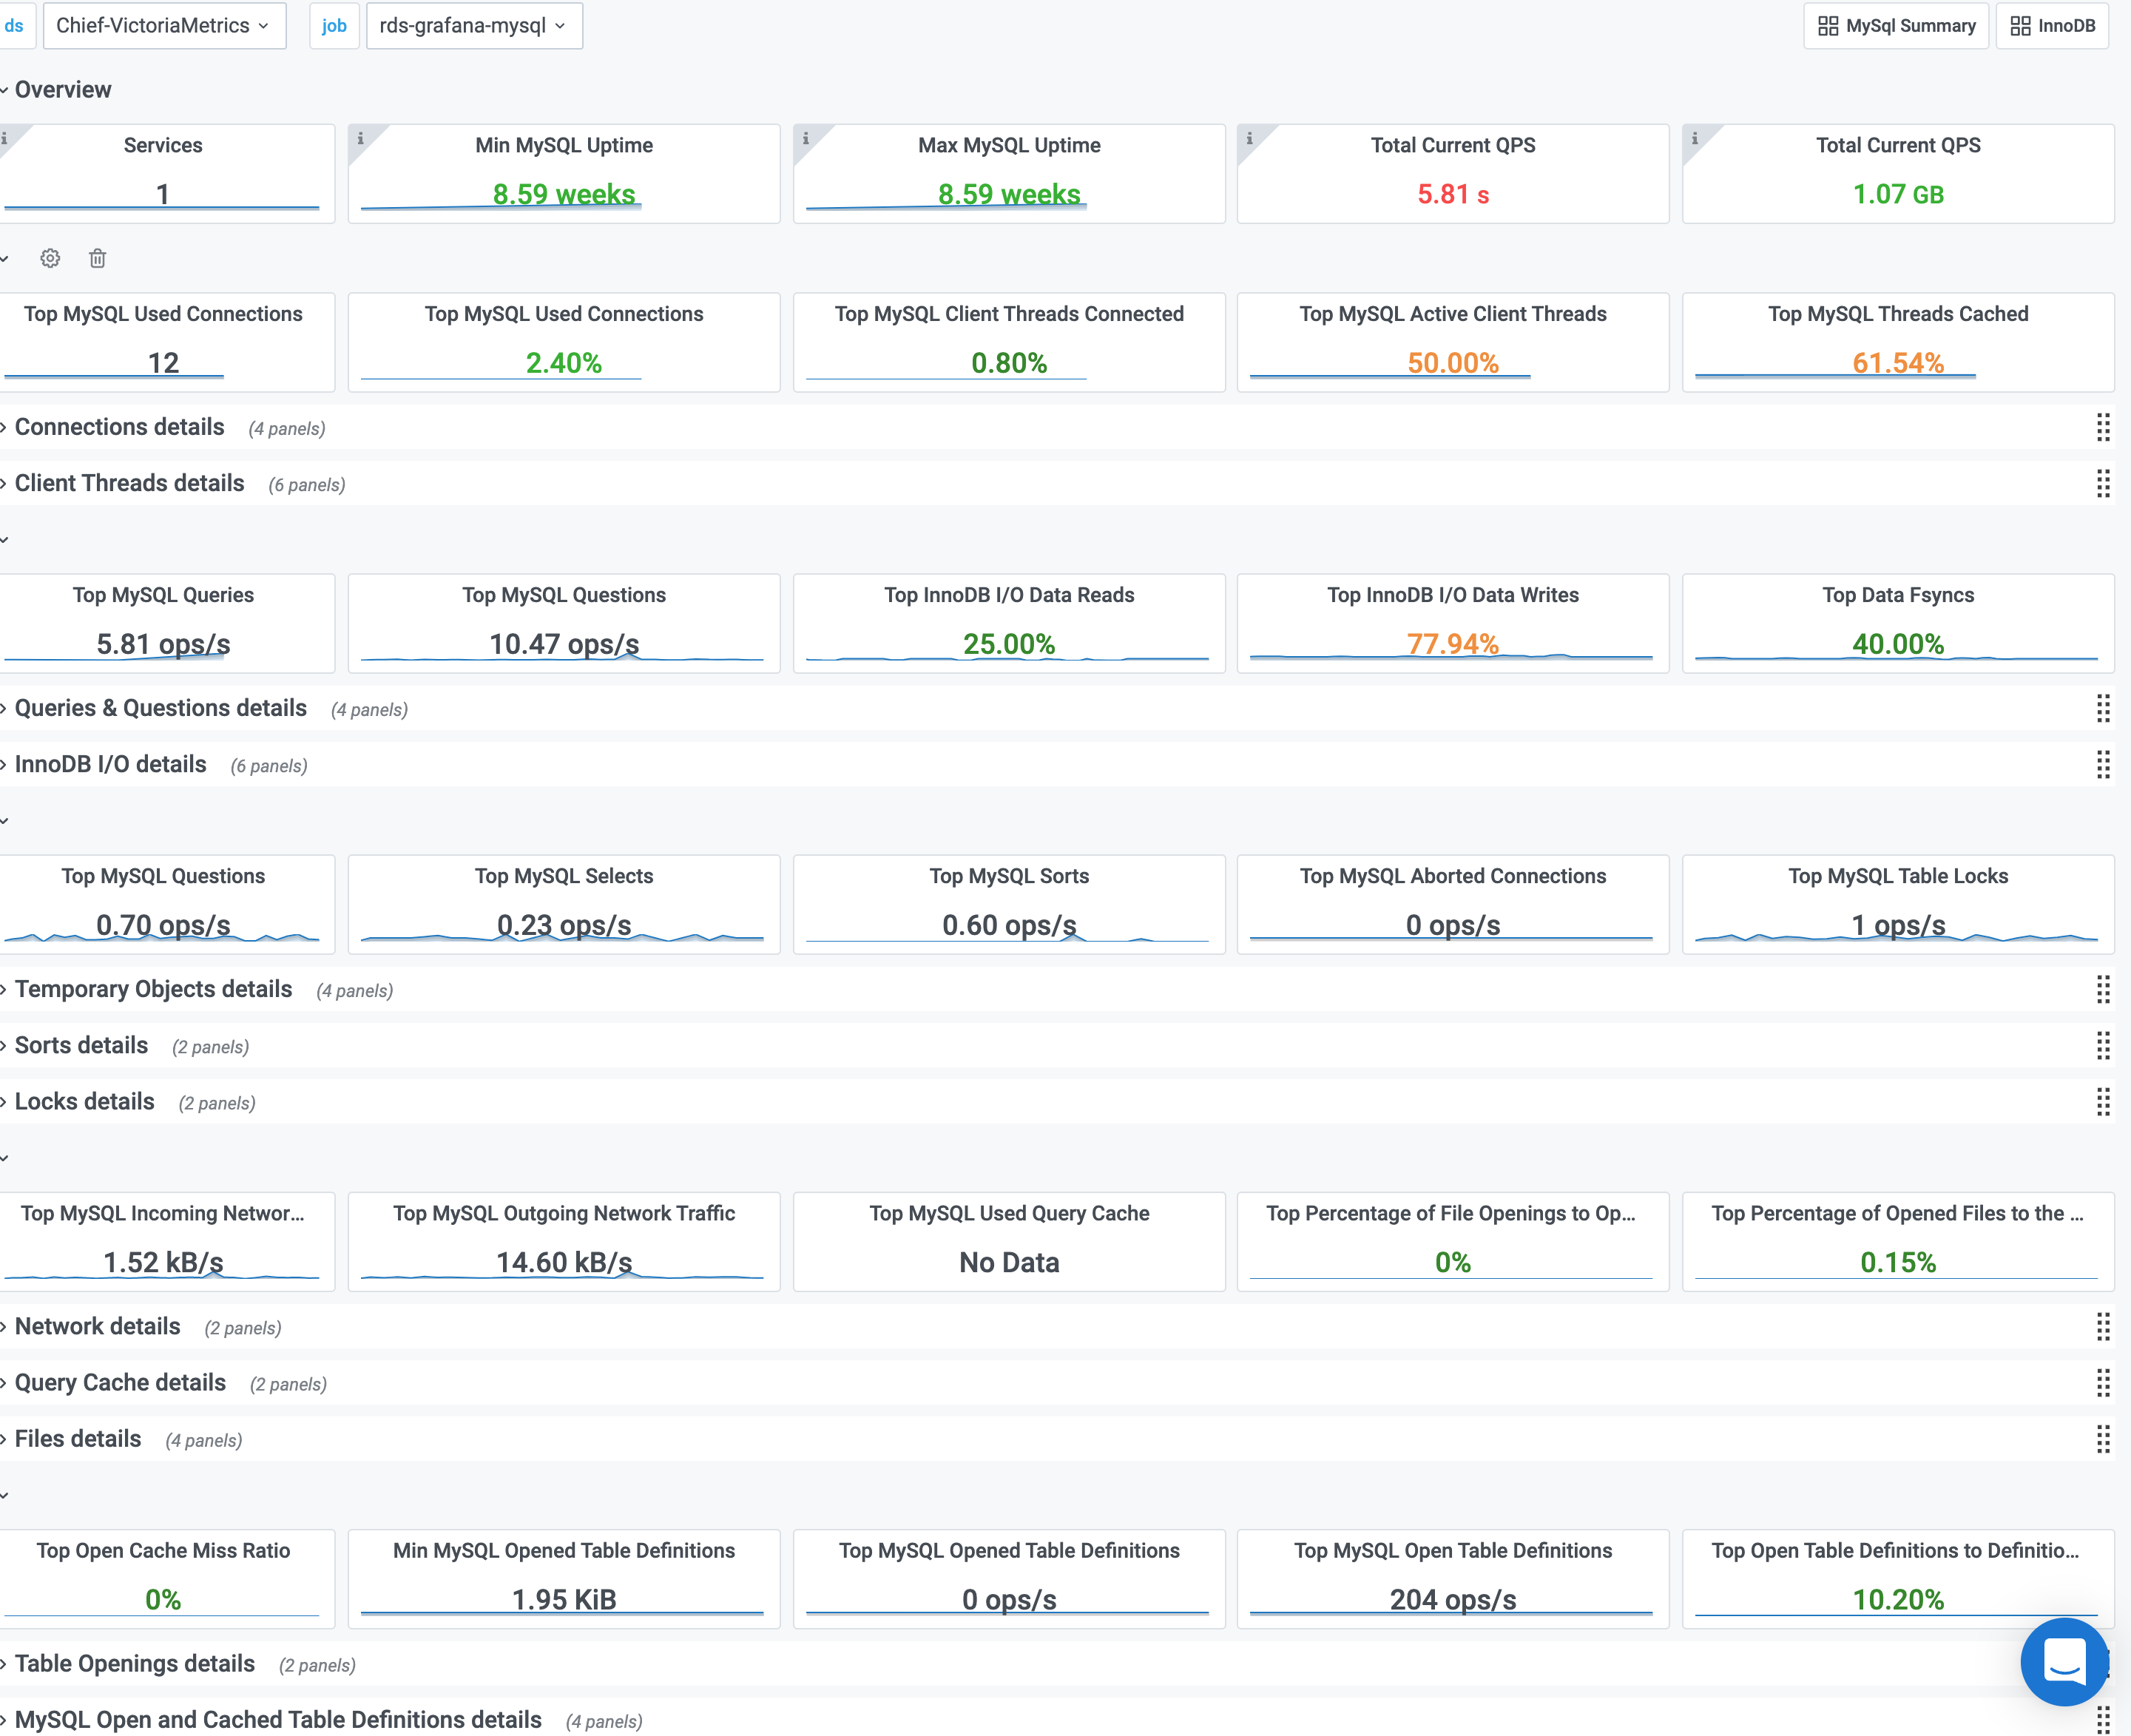
The following MySQL dashboard shows summary level metrics.
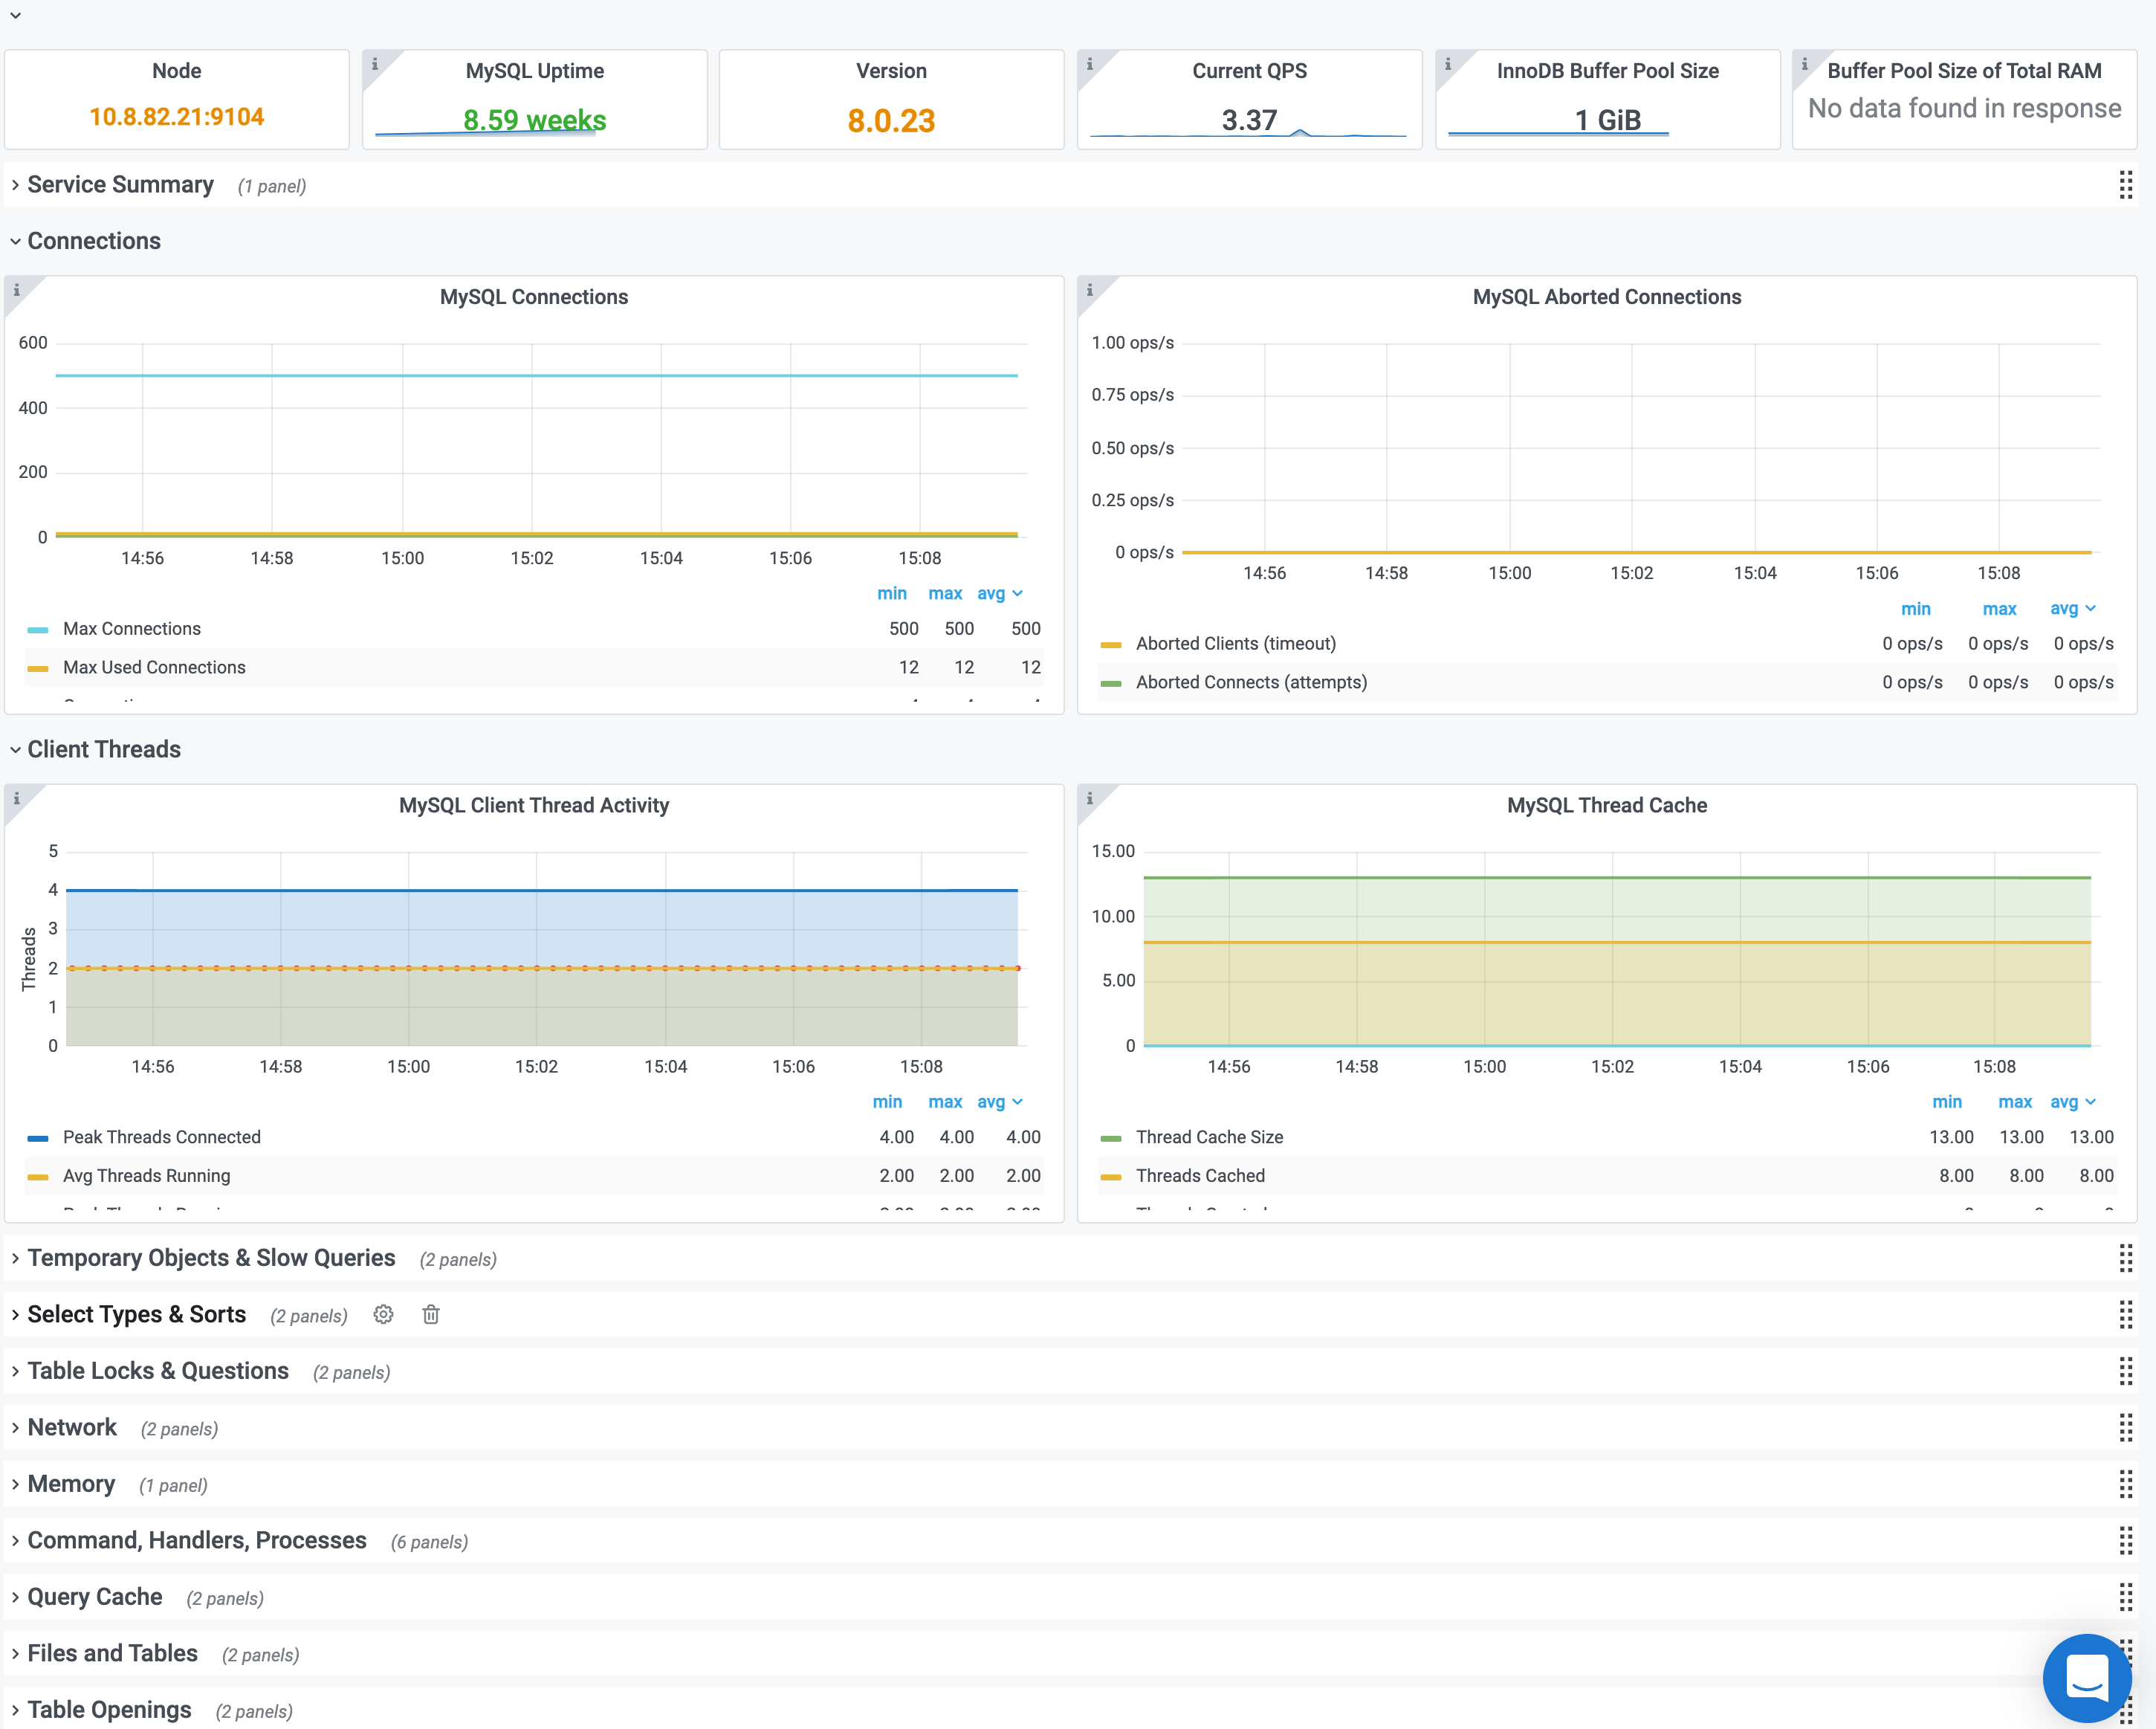
The following dashboard shows additional metric details.
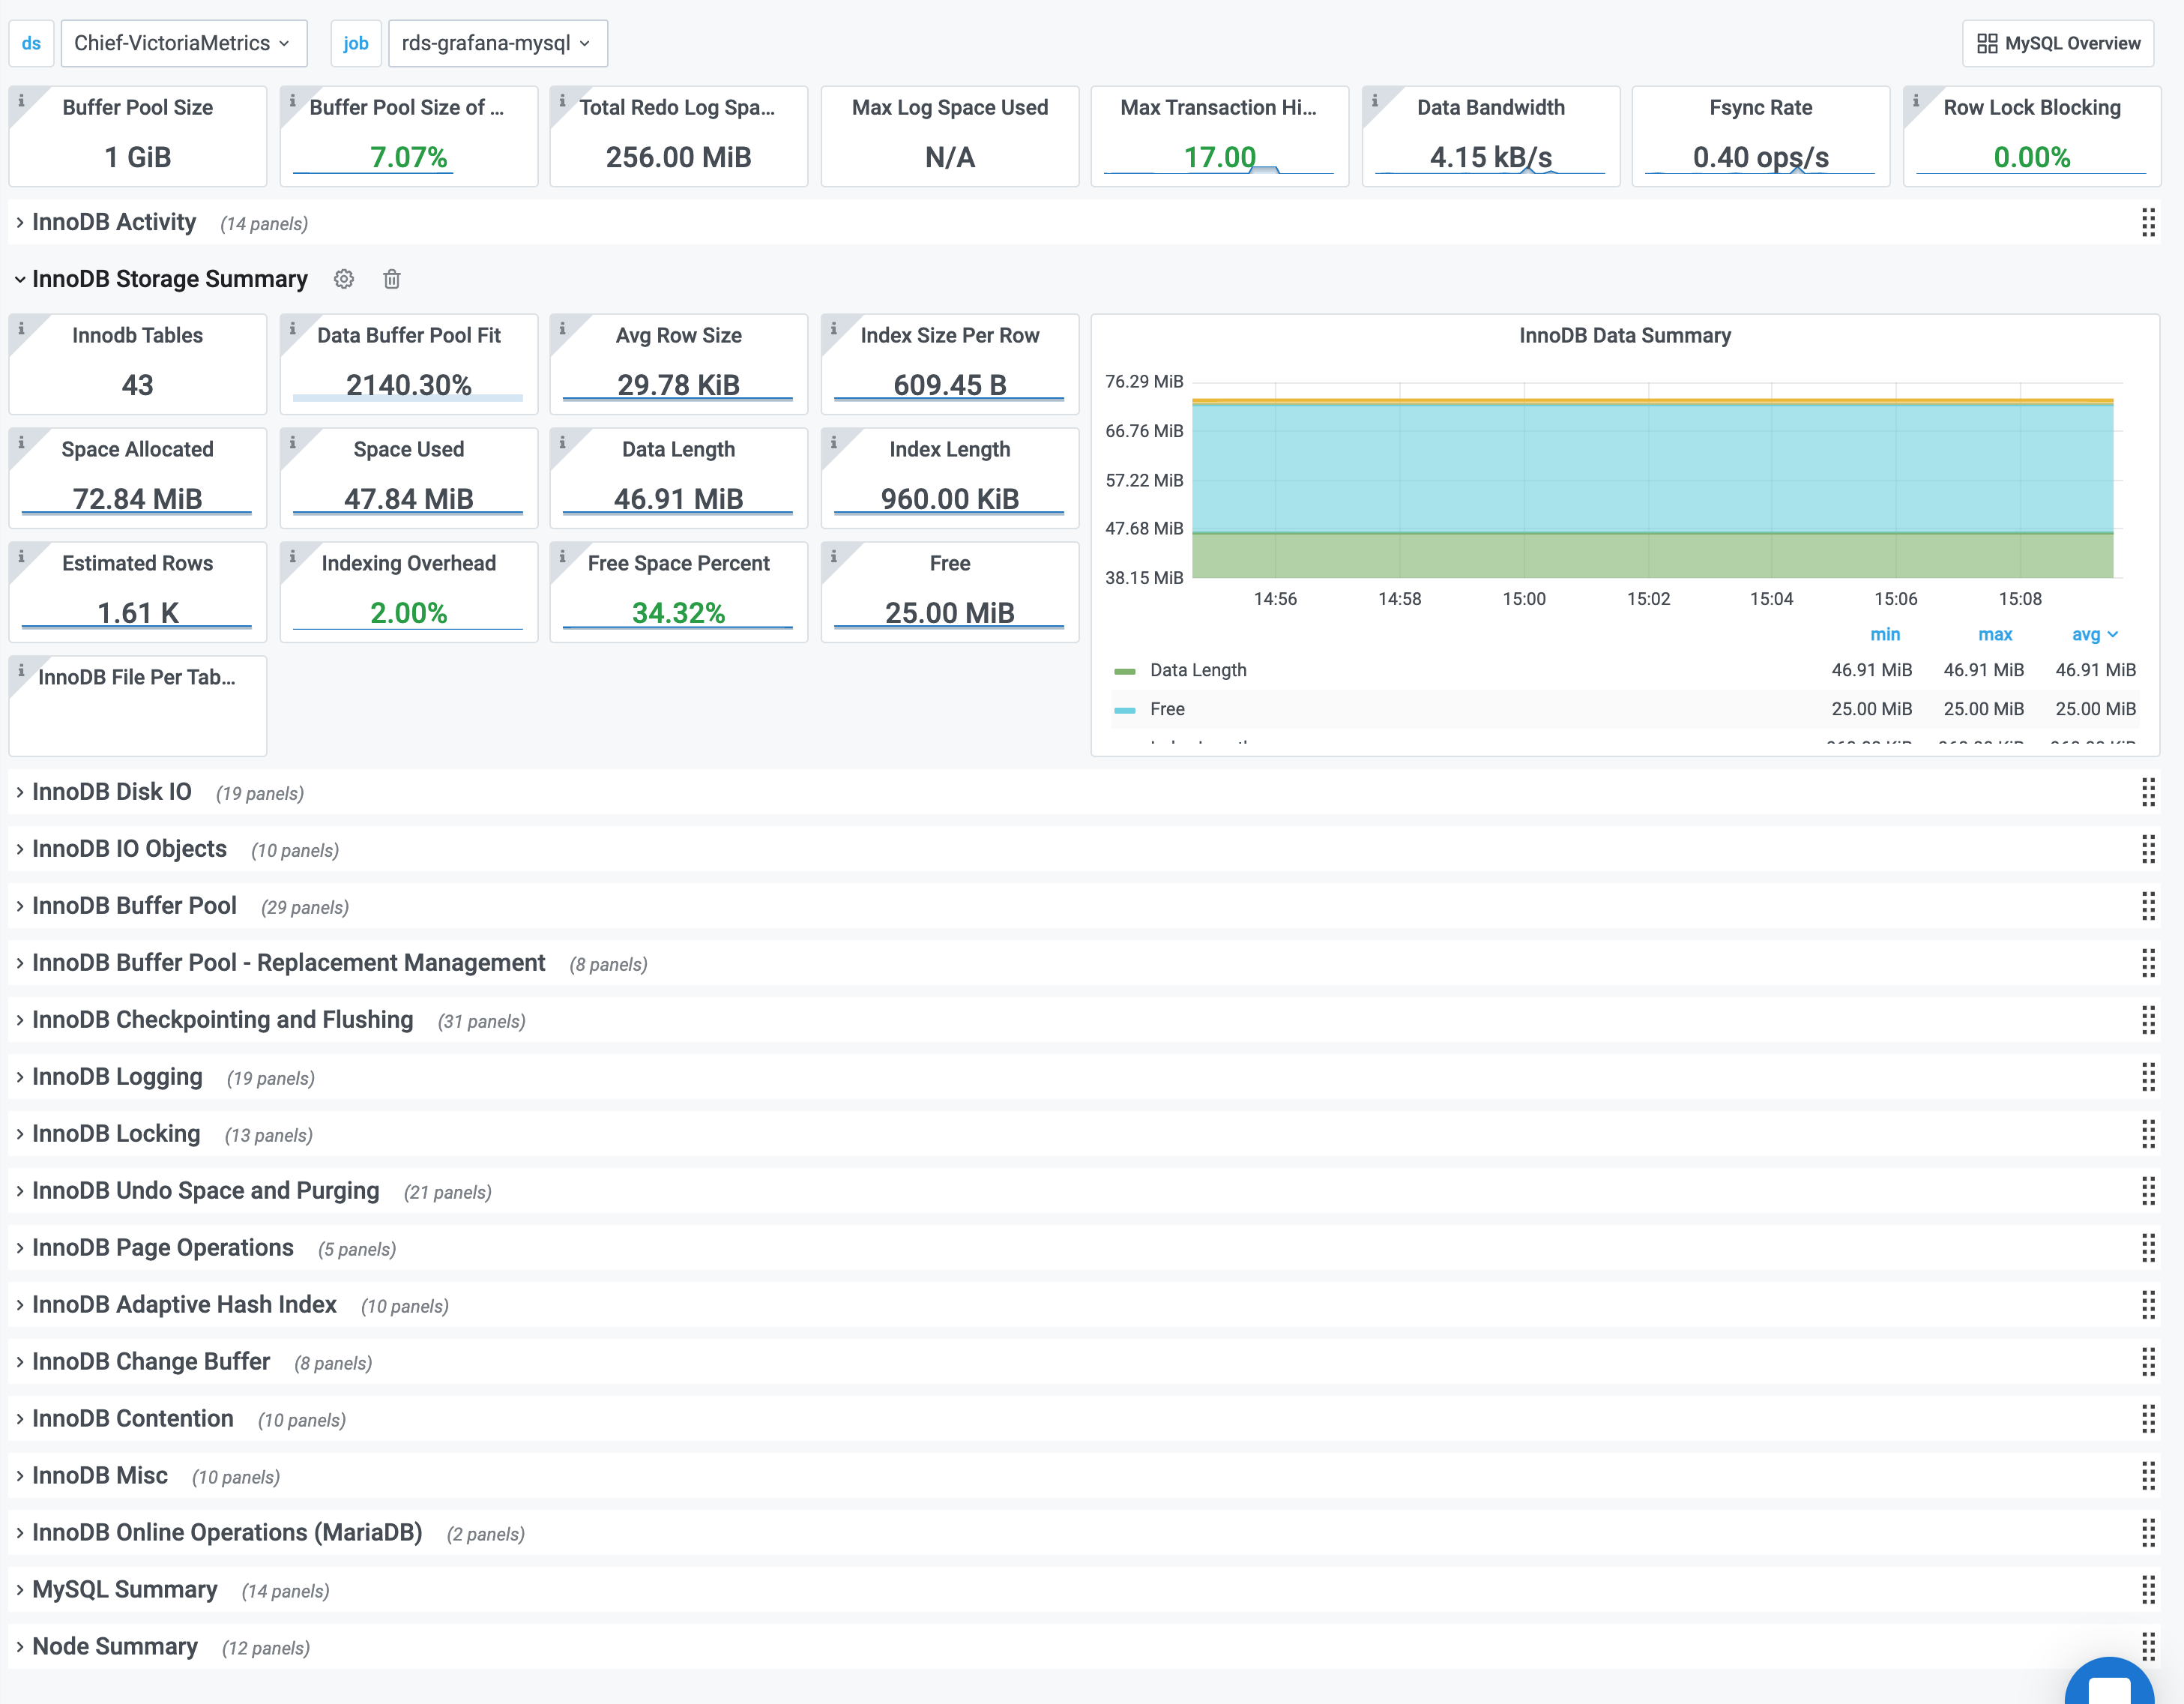
The following dashboard shows InnoDB metrics.