
Application Observability .NET quickstart
Follow these steps to get started quickly with Grafana Application Observability:
- Install the instrumentation library
- Configure an application
- Run the application
- Observe the service in Application Observability
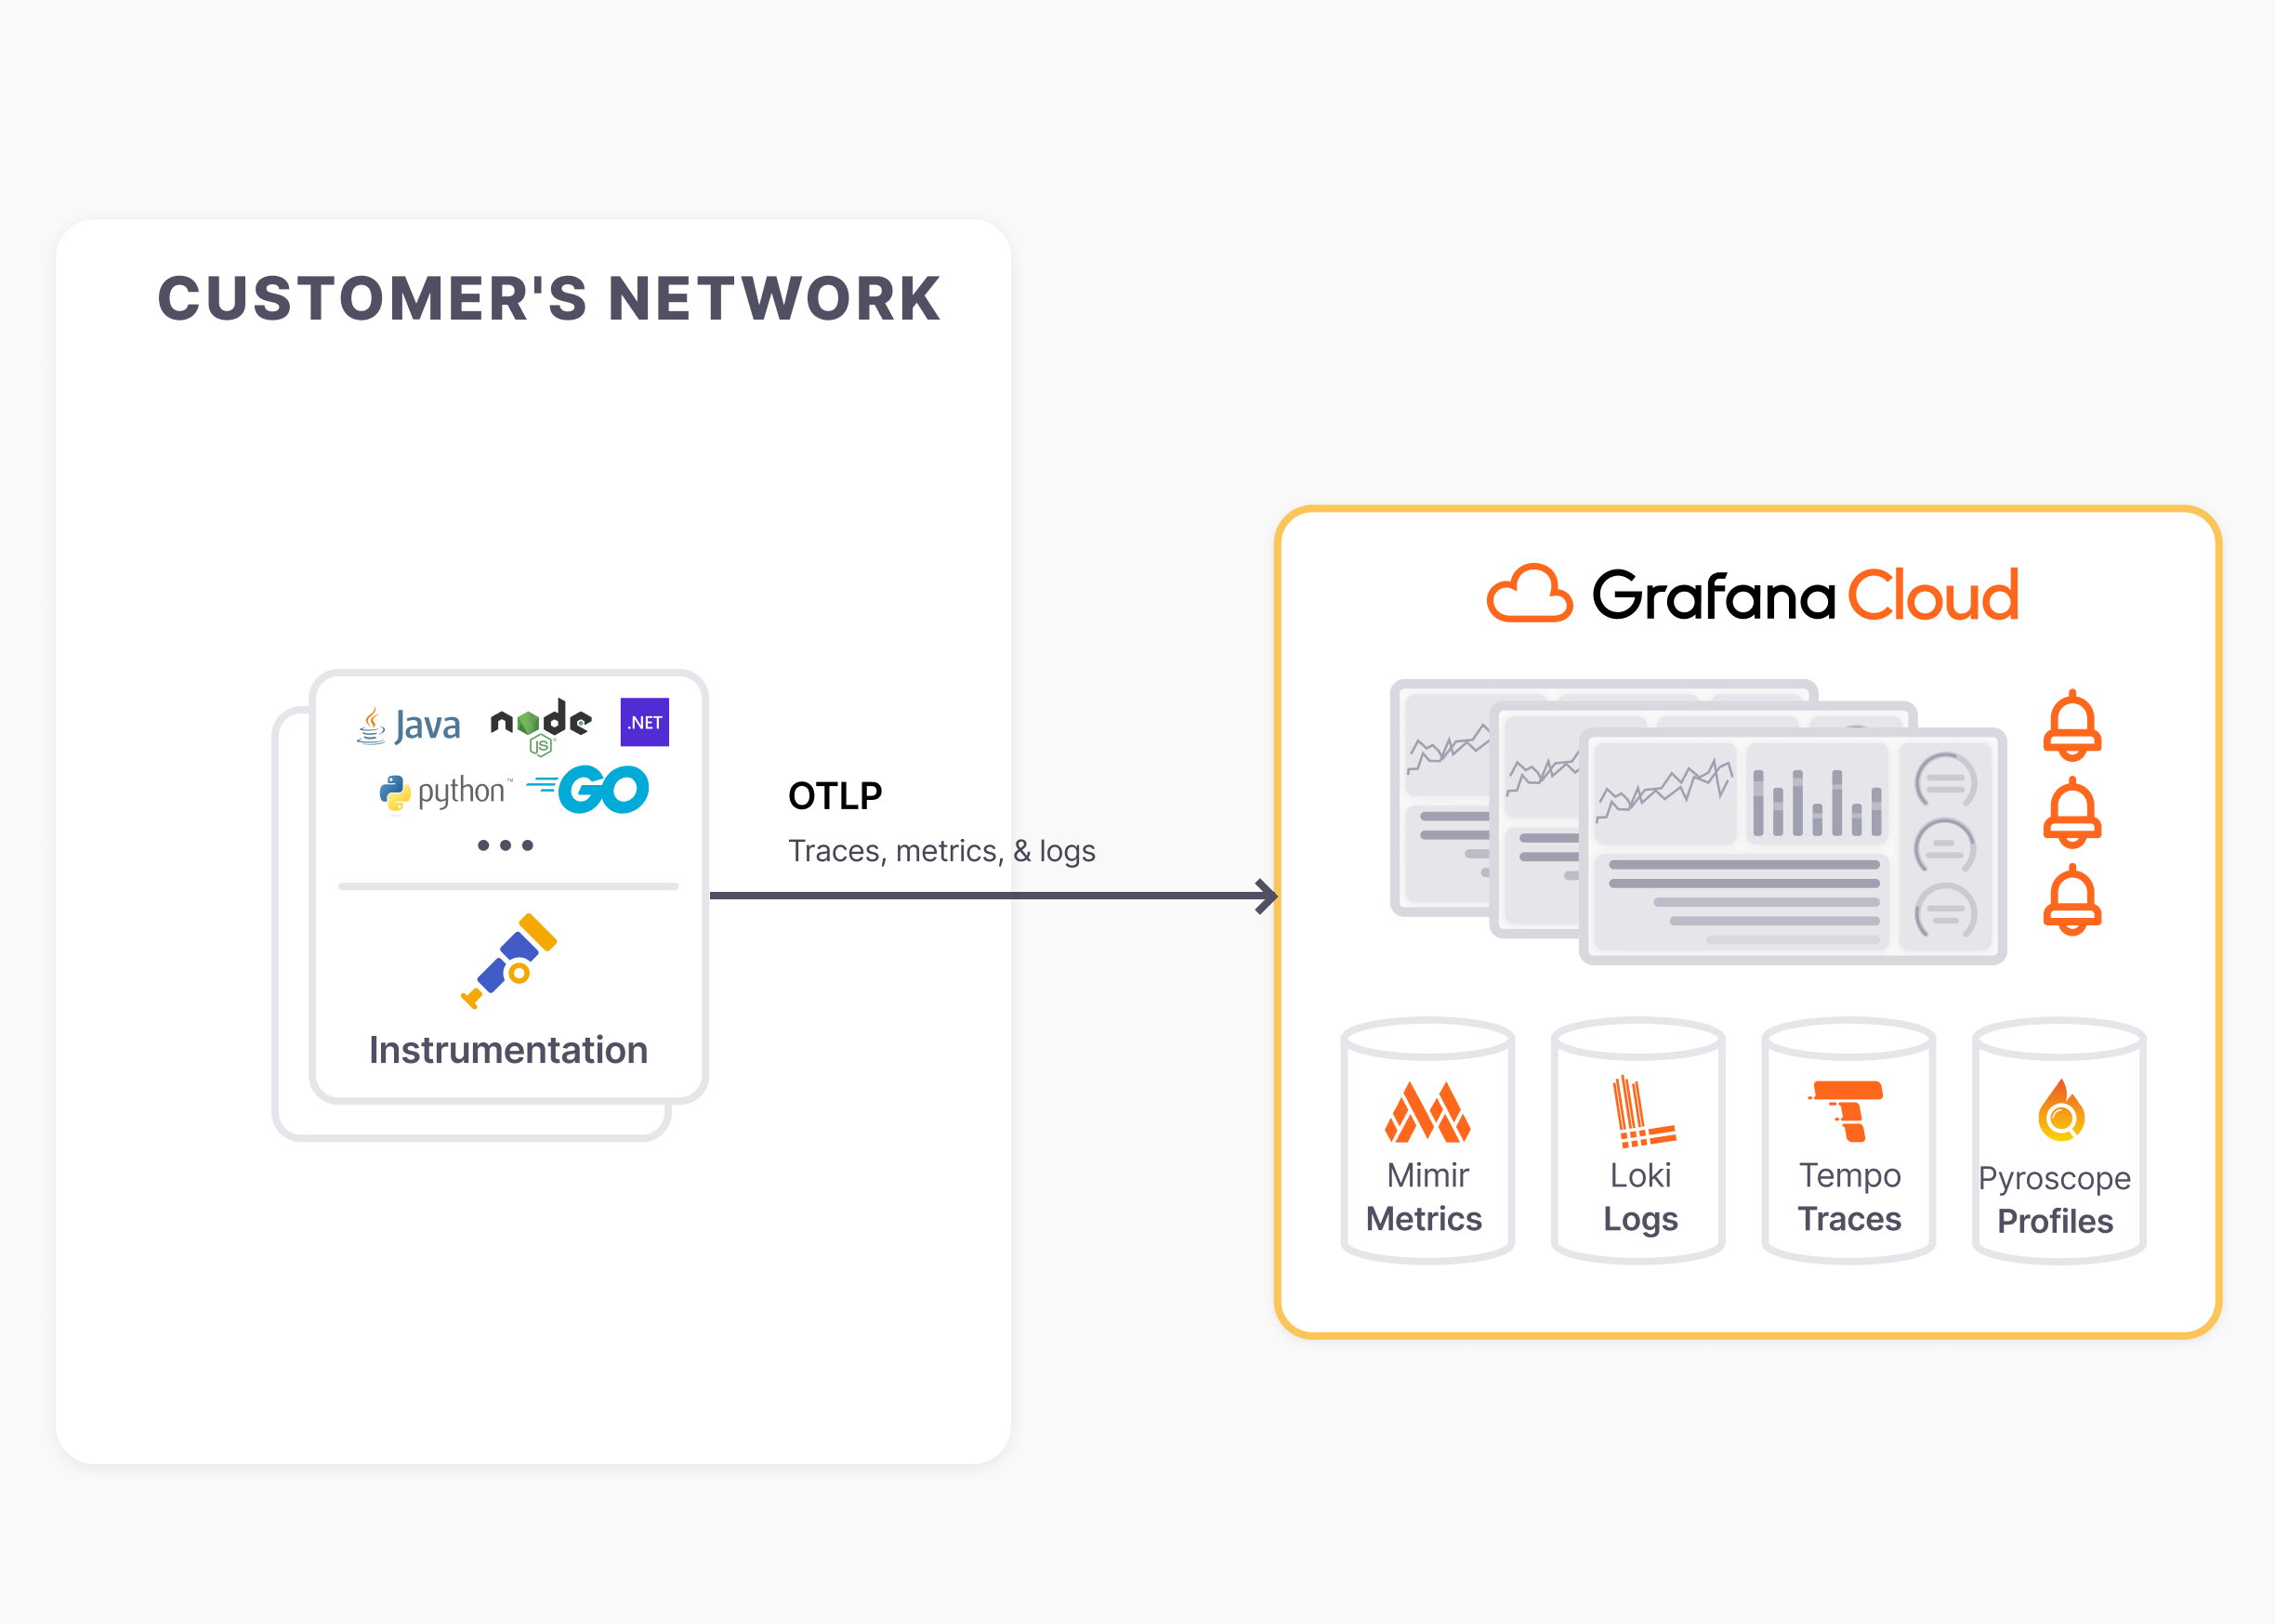
This guide is intended for local development or evaluation setups and sends data directly to Grafana Cloud without a data collector.
Note
For a production setup with a data collector and troubleshooting information, consult the production documentation.
Install the instrumentation library
Install the latest release of the Grafana OpenTelemetry Distribution for .NET.
To install the distribution with the full set of dependencies, add a reference to the Grafana.OpenTelemetry package to a project.
dotnet add package --prerelease Grafana.OpenTelemetryNote
If installing using Visual Studio, be sure to select “Include prelease” in the NuGet Package Manager.
Configure an application to use the UseGrafana extension method on a TracerProviderBuilder and a MetricProviderBuilder:
Caution
Always dispose the trace and meter providers withusingor via dependency injection. Failure to do so may cause telemetry data to be lost when the process shuts down.
using OpenTelemetry;
using OpenTelemetry.Metrics;
using OpenTelemetry.Trace;
using Grafana.OpenTelemetry;

public class Program
{
    public static void Main(string[] args)
    {
        using var tracerProvider = Sdk.CreateTracerProviderBuilder()
            .UseGrafana()
            .Build();
        using var meterProvider = Sdk.CreateMeterProviderBuilder()
            .UseGrafana()
            .Build();
        using var loggerFactory = LoggerFactory.Create(builder =>
        {
            builder.AddOpenTelemetry(logging =>
            {
                logging.UseGrafana();
            });
        });
    }
}
Configure an application
Next, customize the following shell script to configure an application:
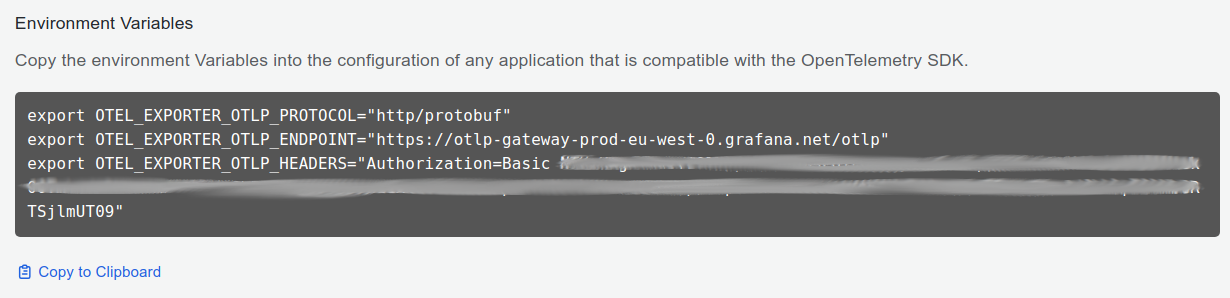
<authentication environment variables from step 3>
export OTEL_SERVICE_NAME=<Service Name>
Follow these steps to get necessary information for the shell script:
Sign in to Grafana Cloud, register for a Free Grafana Cloud account if required, the browser will navigate to the Grafana Cloud Portal page https://grafana.com/profile/org.
If the account has access to multiple Grafana Cloud Organizations, select an organization from the top left organization dropdown.
If the organization has access to multiple Grafana Cloud Stacks, navigate to a stack from the left side bar or the main Stacks list.
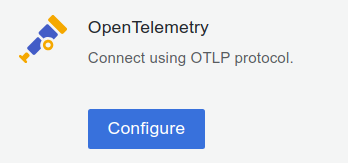
With a stack selected, or in the single stack scenario, below Manage your Grafana Cloud Stack, click Configure in the OpenTelemetry section:
![]()
In the Password / API Token section, click on Generate now to create a new API token:
- Give the API token a name, for example
cart-service - Click on Create token
- Click on Close without copying the token
- Click on Copy to Clipboard to copy the environment variables to the clipboard
![]()
- Give the API token a name, for example
- Pick a Service Name to identify the service, for example
cart
Run the application
Finally, run the application with the shell script and make some requests to the service to send data to Grafana Cloud.
Observe the service in Application Observability
Open Application observability:
- Navigate to a stack
https://<your-stack-name.>grafana.net - Expand the top left menu below the Grafana logo
- Click on Application
Activate metrics generation
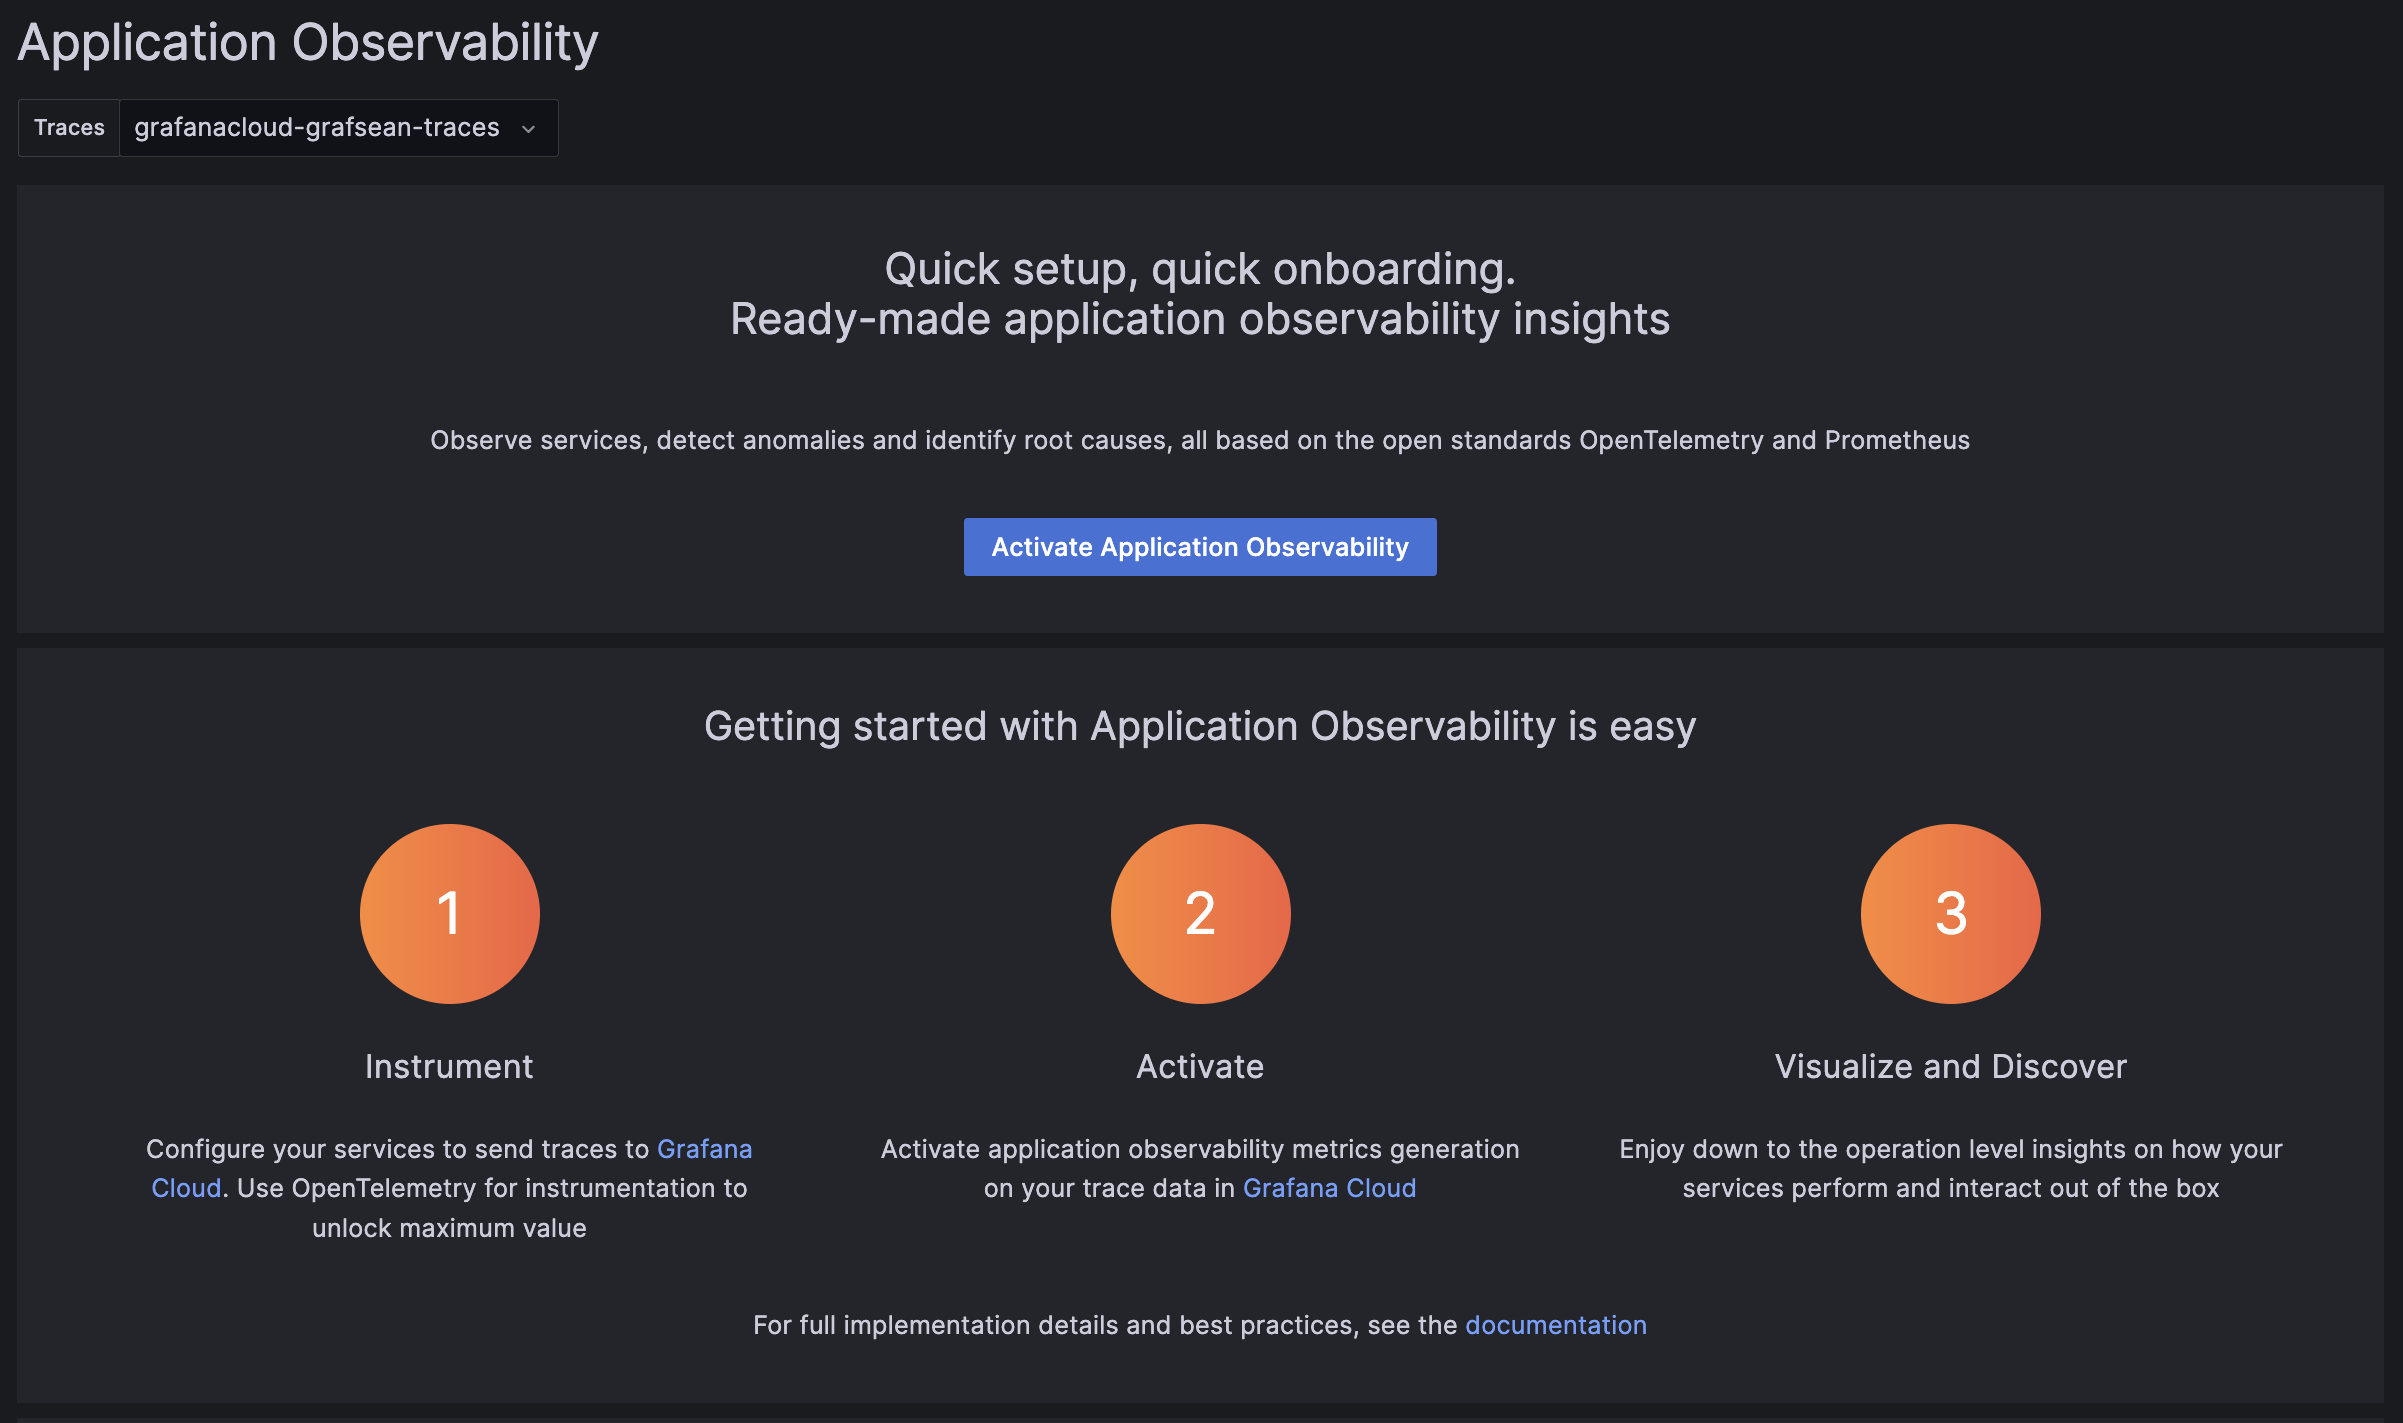
Application Observability relies on metrics generated from traces already sent to Grafana Cloud Traces.
Metrics generation is self-serve, and can be enabled during onboarding and disabled from Application Observability configuration.
To complete the setup, click Activate Application Observability to enable metrics generation.
Note
After activating Application Observability and enabling metrics generation, it might take up to five minutes to generate metrics and show graphs.
Visualize and discover
Discover more about Application Observability in the documentation:
- Service Inventory: filter, and search services and view RED metrics.
- Service Overview: traces, logs, RED metrics, operations, and runtime information.
- Service Map: graph of connected services, service dependencies, and data flow.
Was this page helpful?
Related resources from Grafana Labs


