Grafana Cloud setup guides
Grafana Cloud provides two sets of pre-configured guides to help you set up and configure OpenTelemetry components for Grafana Cloud, including OpenTelemetry instrumentation, an OpenTelemetry Collector distribution, and cloud applications like Application Observability and Drilldown Apps.
OpenTelemetry setup guide
Get started quickly with OpenTelemetry and Grafana Cloud using the OpenTelemetry setup guide. This guide helps you instrument applications, assemble data pipelines, ingest OTLP data, and gain application insights.
To access the OpenTelemetry setup guide, follow these steps:
- Sign In to the Grafana Cloud Portal.
- From your organization Overview, select or click Launch to open a Grafana Cloud stack.
- With a stack selected, click Launch from the Grafana tile to launch Grafana Cloud.
- From the left navigation, click or expand Home.
- With the Home screen selected or expanded, click Setup guide.
- From the setup guide screen, click OpenTelemetry.
The guide offers options for Quickstart and Production setups.
Quickstart:
The Quickstart guide configures instrumentation to send OTLP data directly to the Grafana Cloud OTLP endpoint, without setting up a data pipeline with an OpenTelemetry Collector.
This setup is ideal for getting started quickly, as you don’t need to configure or manage an OpenTelemetry Collector.
While you can use this architecture in production, it is not as robust or scalable as Collector-based setups. For production use of Application Observability, you must send specific host information from a Collector for billing. For more information on Application Observability host-hours pricing, refer to the Application Observability documentation.
Production:
The Production guide sets up everything you need to use OpenTelemetry in production with all supported features of Grafana Cloud, including Application Observability.
This setup is ideal for robust and scalable production data pipelines. For more information on production data pipelines, refer to our OpenTelemetry Collector documentation.
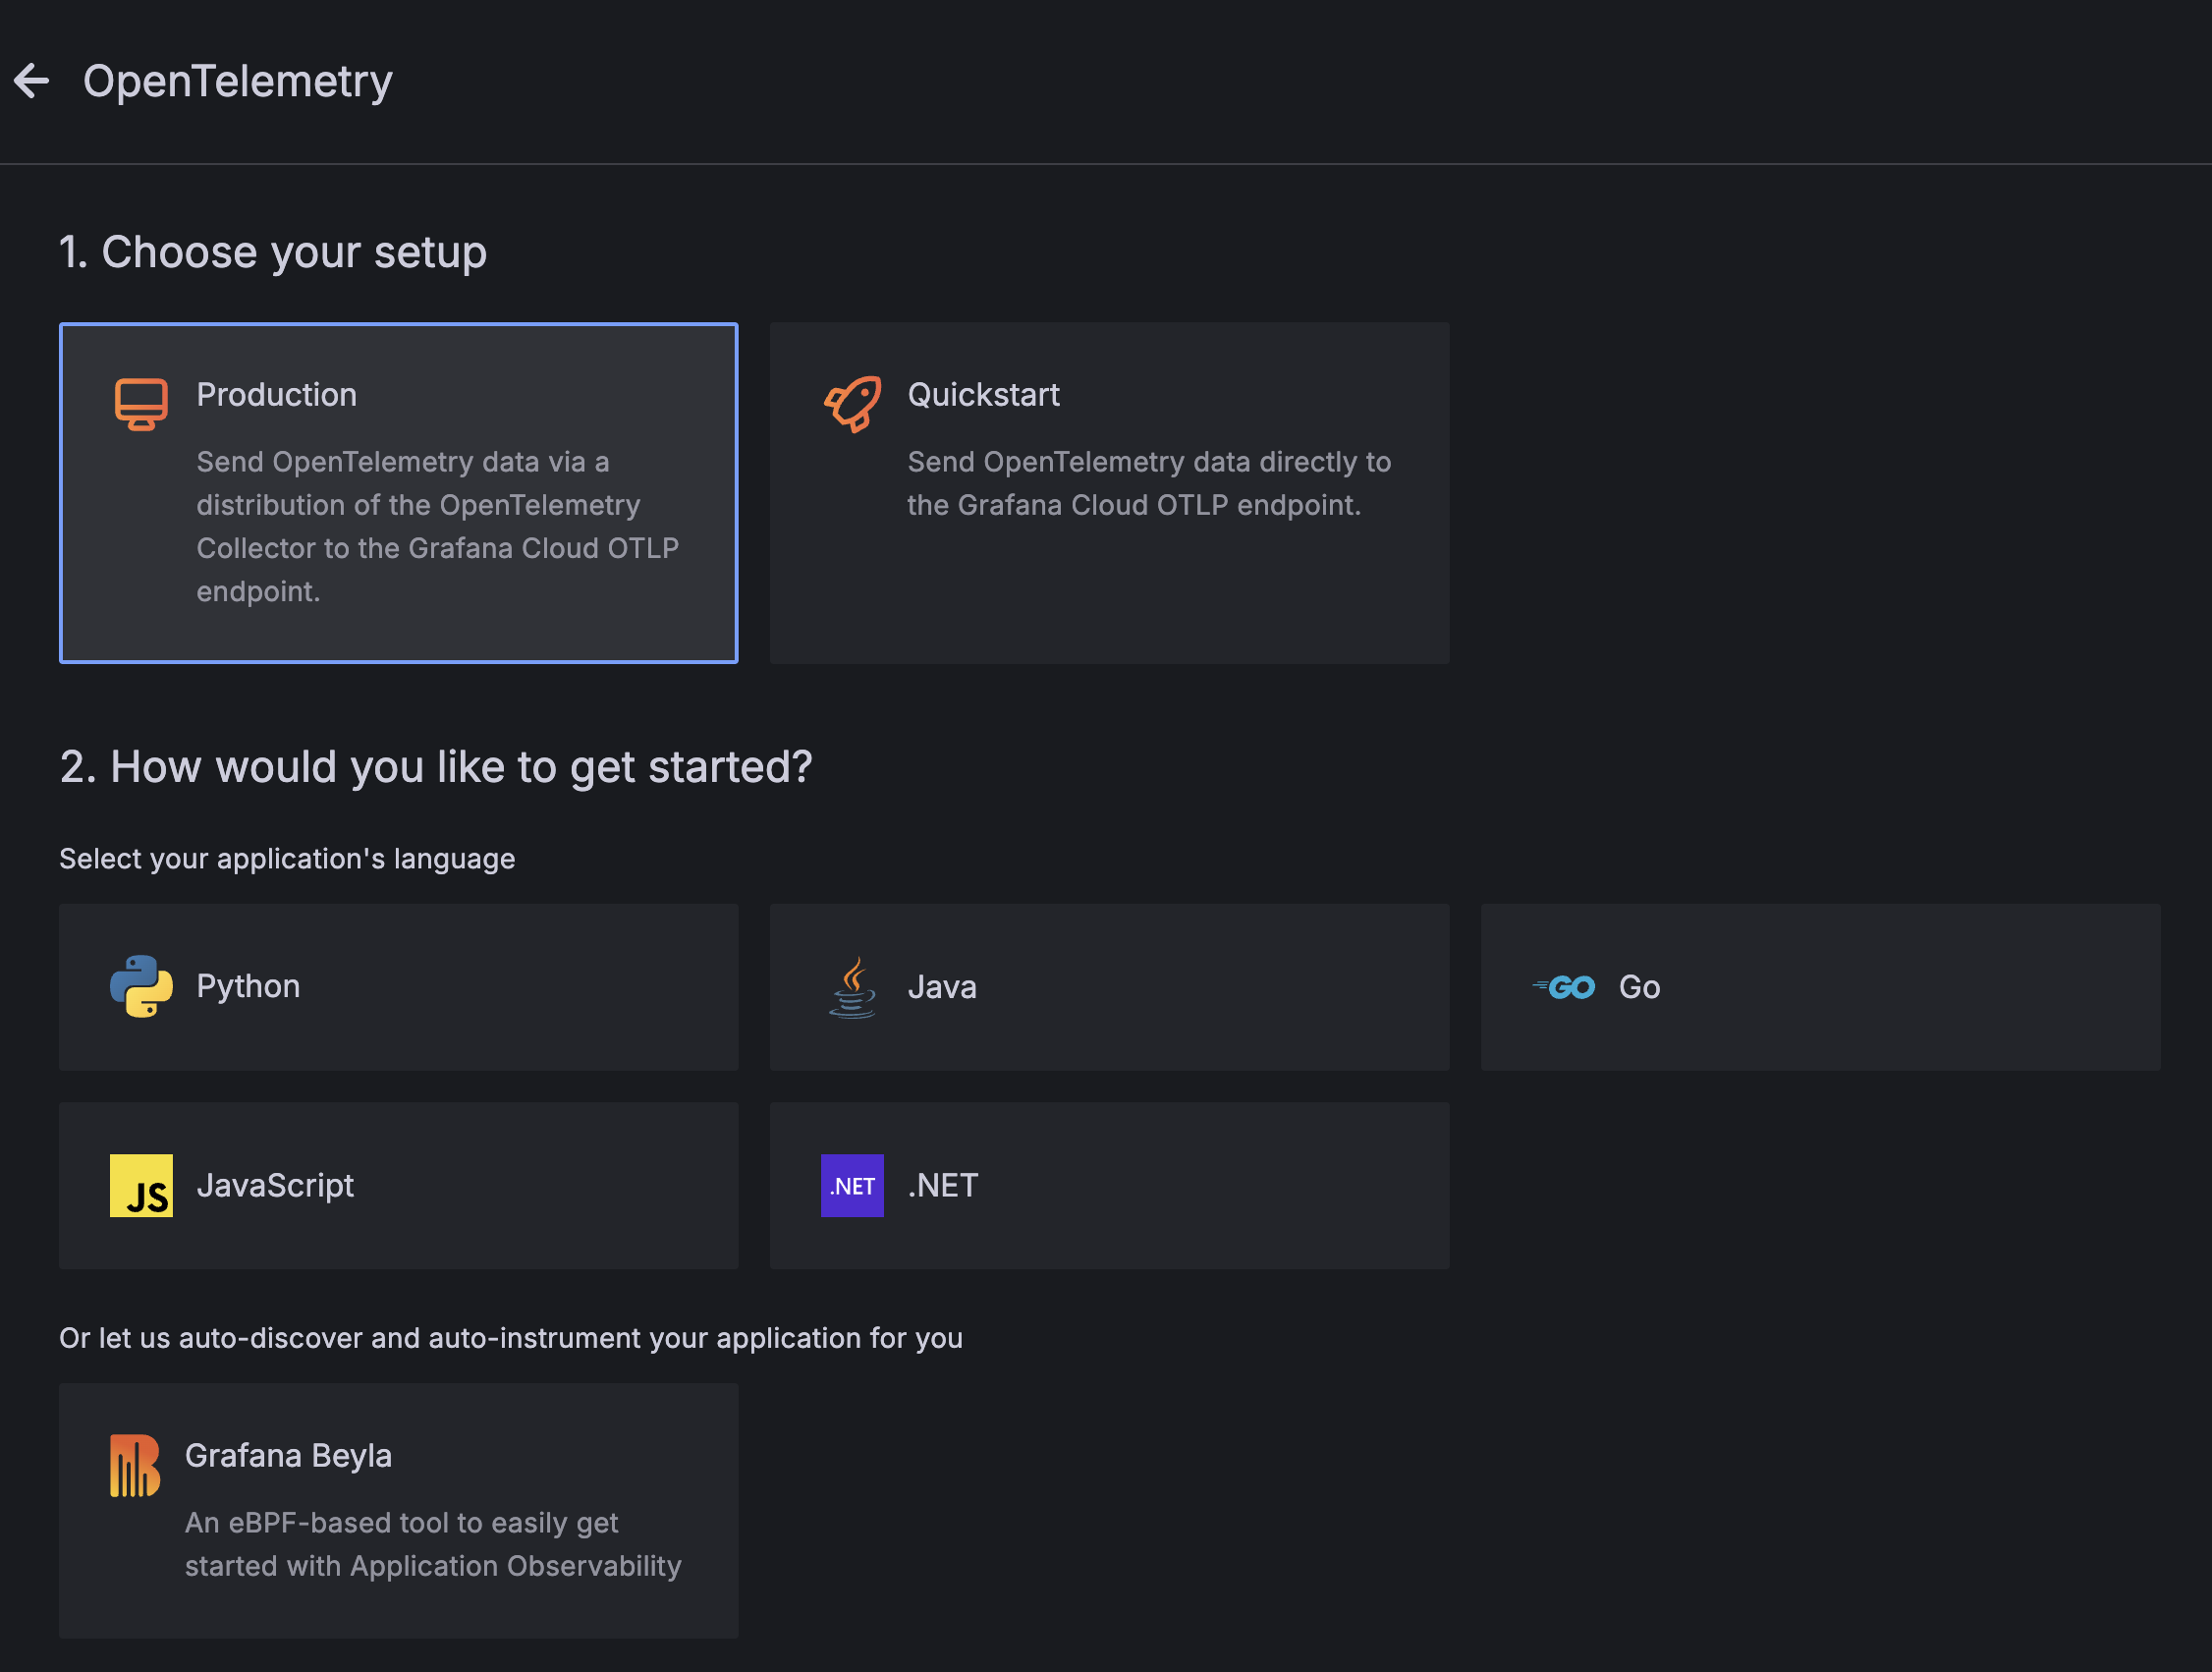 Grafana Cloud setup guide for OpenTelemetry
Integration connection tiles
If you are familiar with Grafana Cloud, you can use the Grafana Cloud integration connection tiles to set up specific parts of your OpenTelemetry stack, including instrumentation and data pipelines.
Integration connection tiles are available to set up the following OpenTelemetry components:
- Grafana auto-instrumentation agent for Java (JVM) and Grafana Alloy
- Grafana instrumentation SDK for .NET and Grafana Alloy
- Grafana Beyla eBPF auto-instrumentation and Grafana Alloy
- OpenTelemetry (OTLP) with Grafana Alloy, for an application already instrumented with OpenTelemetry
- The upstream OpenTelemetry Collector published by the OpenTelemetry Community, for an application already instrumented with OpenTelemetry
To use a Grafana Cloud connection tile to set up OpenTelemetry components, follow these steps:
- Sign In to the Grafana Cloud Portal.
- From your organization Overview, select or click Launch to open a Grafana Cloud stack.
- With a stack selected, click Launch from the Grafana tile to launch Grafana Cloud.
- With Grafana Cloud launched, click Connections, or expand, then click Add new connection.
- Search for “OpenTelemetry” and press enter to filter the connection options.
- Select the desired OpenTelemetry connection tile and follow the instructions.
 Grafana Cloud connection tiles for OpenTelemetry