Detect anomalies outside the forecast
Forecasts can also be used for anomaly detection by identifying when real observed values fall outside the prediction interval.
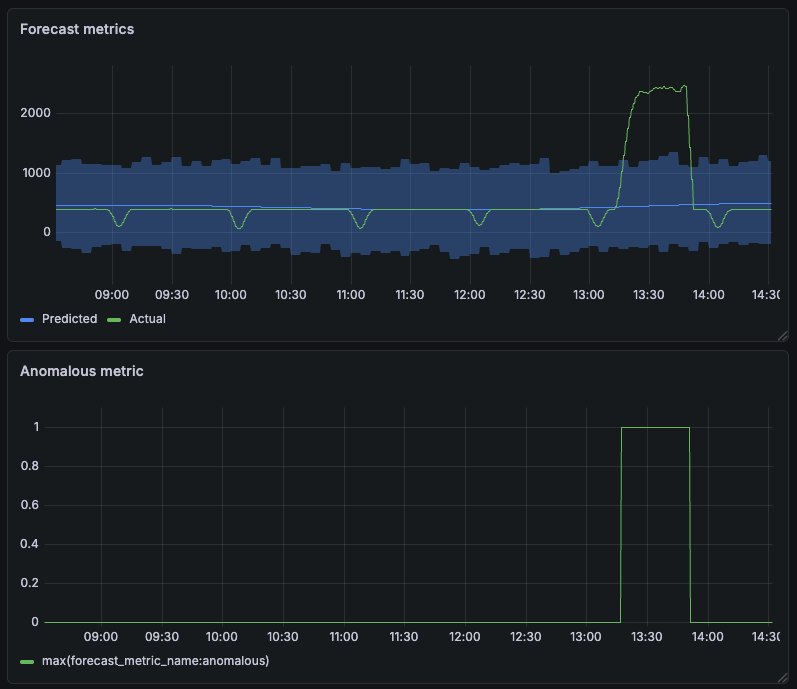
In addition to the :predicted and :actual metrics, Grafana Machine Learning generates an :anomalous metric that reports whether the real values are outside the forecast bounds.
The anomalous metric
The :anomalous metric evaluates the real observed values against the forecast prediction interval and returns a single series with the following values:
1when:actual > :predicted{ml_forecast="yhat_upper"}. The actual value is above the predicted upper bound.-1when:actual < :predicted{ml_forecast="yhat_lower"}. The actual value is below the predicted lower bound.0when the actual value is within the prediction interval.
The :anomalous metric simplifies anomaly detection by returning a single series and encoding the anomaly direction directly in the metric value.
The anomalous metric is recommended for basic alerting scenarios because it provides a simpler query interface. For example, the following query detects all anomalous values:
forecast_metric_name:anomalous != 0Query anomalous values
You can use Explore to visualize the anomalous metric (forecast_metric_name:anomalous):
The anomalous metric only returns -1, 0, or 1 values. To display the real anomalous values, use the following query:
forecast_metric_name:actual and
ignoring (ml_forecast) (forecast_metric_name:anomalous != 0)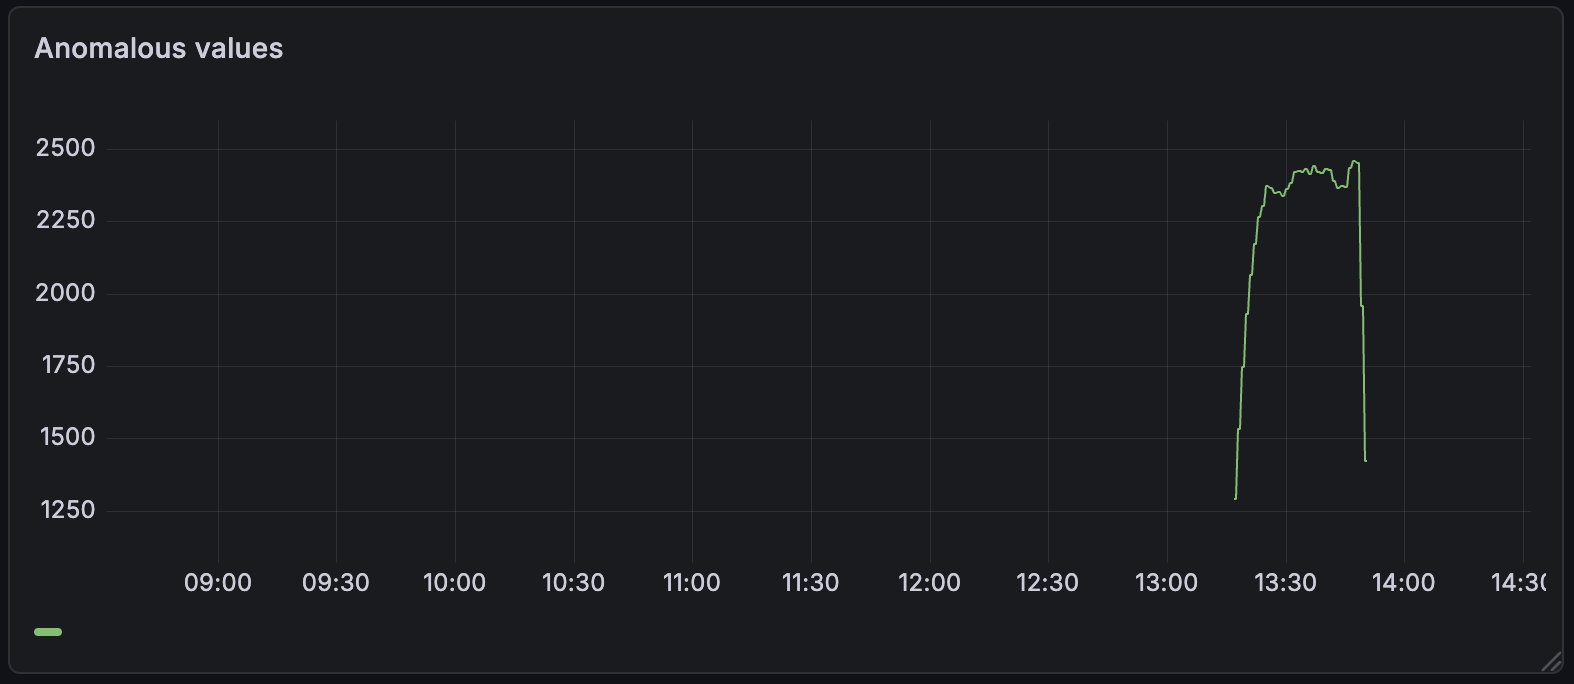
To display only anomalies above the predicted upper bound, use one of the following queries:
forecast_metric_name:actual and
ignoring (ml_forecast) (forecast_metric_name:anomalous == 1)

# or the predicted alternative
forecast_metric_name:actual >
ignoring (ml_forecast) forecast_metric_name:predicted{ml_forecast="yhat_upper"}
To display only anomalies below the predicted lower bound:
forecast_metric_name:actual and
ignoring (ml_forecast) (forecast_metric_name:anomalous == -1)

# or the predicted alternative
forecast_metric_name:actual <
ignoring (ml_forecast) forecast_metric_name:predicted{ml_forecast="yhat_lower"}
You can use the :predicted metric when more advanced comparison logic is required. For example, the following query detects values more than 10% above the predicted upper bound:
forecast_metric_name:actual >
ignoring(ml_forecast)
(
  forecast_metric_name:predicted{ml_forecast="yhat_upper"} * 1.1
)
Create alerts
In Grafana Alerting, you can create custom forecast alerts by quering the forecast metrics.
In Grafana Machine Learning, you can also create forecast alerts directly from the UI using these options:
- The Create forecast alert toggle in the Edit metric forecast view provisions a predefined alert rule.
- In the forecast view, the Create Alert button redirects you to the alert rule form in Grafana Alerting and pre-populates the rule settings with forecast data. This option provides more flexibility.
Alert rules created from the forecast UI use the :anomalous metric and configure custom annotations and labels that link the forecast to the alert rule.
Note
Like the predicted metric, the anomalous metric is recalculated whenever the forecast retrains, including historical values. As a result, past alert evaluations might not exactly reflect the current state of the metric.
For additional details, refer to:


