
 Grafana Cloud
Learn and build
Visualize data
Panels and visualizations
The panel inspect view
Grafana Cloud
Learn and build
Visualize data
Panels and visualizations
The panel inspect viewThe panel inspect view
The panel inspect view, which you can open from the panel menu, helps you understand and troubleshoot your panels. You can inspect the raw data for any Grafana panel, export that data to a comma-separated values (CSV) file, view query requests, review errors and notices, and export panel and data JSON. You can also resize the drawer.
The panel inspector includes the following tabs:
- Data: Shows the raw data returned by the query with transformations applied. Field options such as overrides and value mappings are not applied by default.
- Stats: Shows how long your query takes and how much it returns.
- Query: Shows you the requests to the server sent when Grafana queries the data source.
- Error and notices: Shows errors and notices. Only visible when query returns an error or notice.
- JSON: Allows you to view and copy the panel JSON, panel data JSON, and data frame structure JSON. This is useful if you are provisioning or administering Grafana.
Not all panel types include all tabs. For example, dashboard list panels don’t have raw data to inspect, so they don’t display the Stats, Data, or Query tabs.
Download raw query results
Grafana generates a CSV file that contains your data, including any transformations to that data. You can choose to view the data before or after the panel applies field options or field option overrides.
Edit the panel that contains the query data you want to download.
In the query editor, click Query inspector.
Click the Data tab.
If your panel contains multiple queries or queries multiple nodes, then you have additional options.
- Select result: Choose which result set data you want to view.
- Transform data
- Join by time: View raw data from all your queries at once, one result set per column. Click a column heading to reorder the data.
To see data before the system applies field overrides, click the Formatted data toggle.
To download a CSV file specifically formatted for Excel, click the Download for Excel toggle .
Click Download CSV.
Inspect query performance
The Stats tab displays statistics that tell you how long your query takes, how many queries you send, and the number of rows returned. This information can help you troubleshoot your queries, especially if any of the numbers are unexpectedly high or low.
- Edit the panel that contains the query with performance you want to inspect.
- In the query editor, click Query inspector.
- Click Stats.
Statistics display in read-only format.
Inspect query request and response data
Inspect query request and response data when you want to troubleshoot a query that returns unexpected results, or fails to return expected results.
Edit the panel that contains the query you want to export.
In the query editor, click Query inspector.
Click Refresh.
The panel populates with response data.
Make adjustments, as necessary and re-run the query.
To download the query request and response data, click the Copy to clipboard icon and paste the results into another application.
Inspect errors and notices
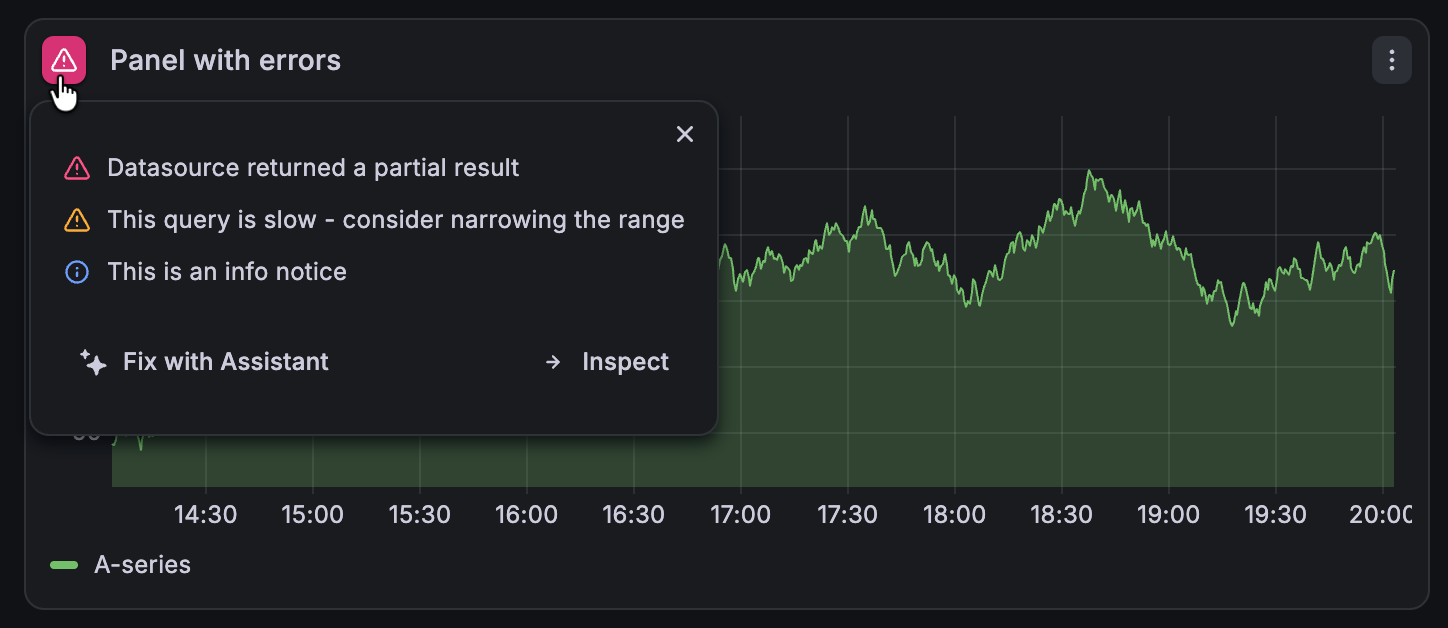
Panels with errors or notices display an icon in the top-left corner, before the panel title. The icon is dynamic, reflecting the highest severity notice on a panel.
To inspect errors and notices, follow these steps:
Navigate to the panel you want to view.
Click the icon to display a tooltip that shows all the panel errors and notices, sorted by severity:
![Errors and notices tooltip displayed on a panel]()
Click Inspect to open the drawer where you can see the full text of errors and notices.
Was this page helpful?
Related resources from Grafana Labs



