
 Grafana Cloud
Learn and build
Visualize data
Dashboards
Build dashboards
Annotate visualizations
Grafana Cloud
Learn and build
Visualize data
Dashboards
Build dashboards
Annotate visualizationsAnnotate visualizations
Annotations provide a way to mark points on a visualization with rich events. They are visualized as vertical lines and icons on all graph panels. When you hover over an annotation, you can get event description and event tags. The text field can include links to other systems with more detail.
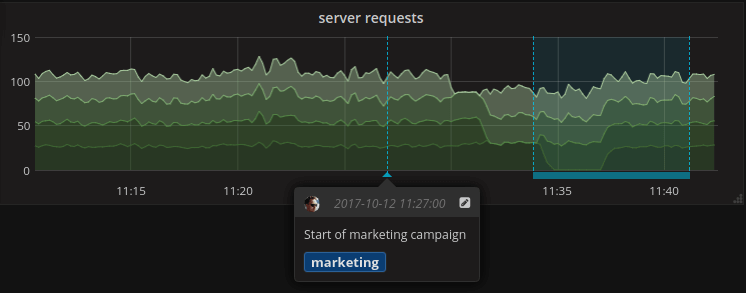
You can annotate visualizations in three ways:
- Directly in the panel, using the built-in annotations query
- Using the HTTP API
- Configuring annotation queries
In the first two cases, you’re creating new annotations, while in the last you’re querying existing annotations from data sources. The built-in annotation query also supports this.
This page explains the first and third options; for information about using the HTTP API, refer to Annotations API.
Annotations are supported for the following visualization types:
- Time series
- State timeline
- Candlestick
Create annotations in panels
Grafana comes with the ability to add annotation events directly from a panel using the built-in annotation query that exists on all dashboards. Annotations that you create this way are stored in Grafana.
To add annotations directly in the panel:
- The dashboard must already be saved.
- The built-in query must be enabled. Learn more in Built-in query.
Watch the following video for a quick tutorial on creating annotations:
Add an annotation
To add an annotation, complete the following steps:
- If you’ve just saved a dashboard, refresh the page.
- Click a data point in a panel to open the tooltip.
- In the tooltip, click Add annotation.
![Add annotation context menu]()
- Add an annotation description and tags (optional).
- Click Save.
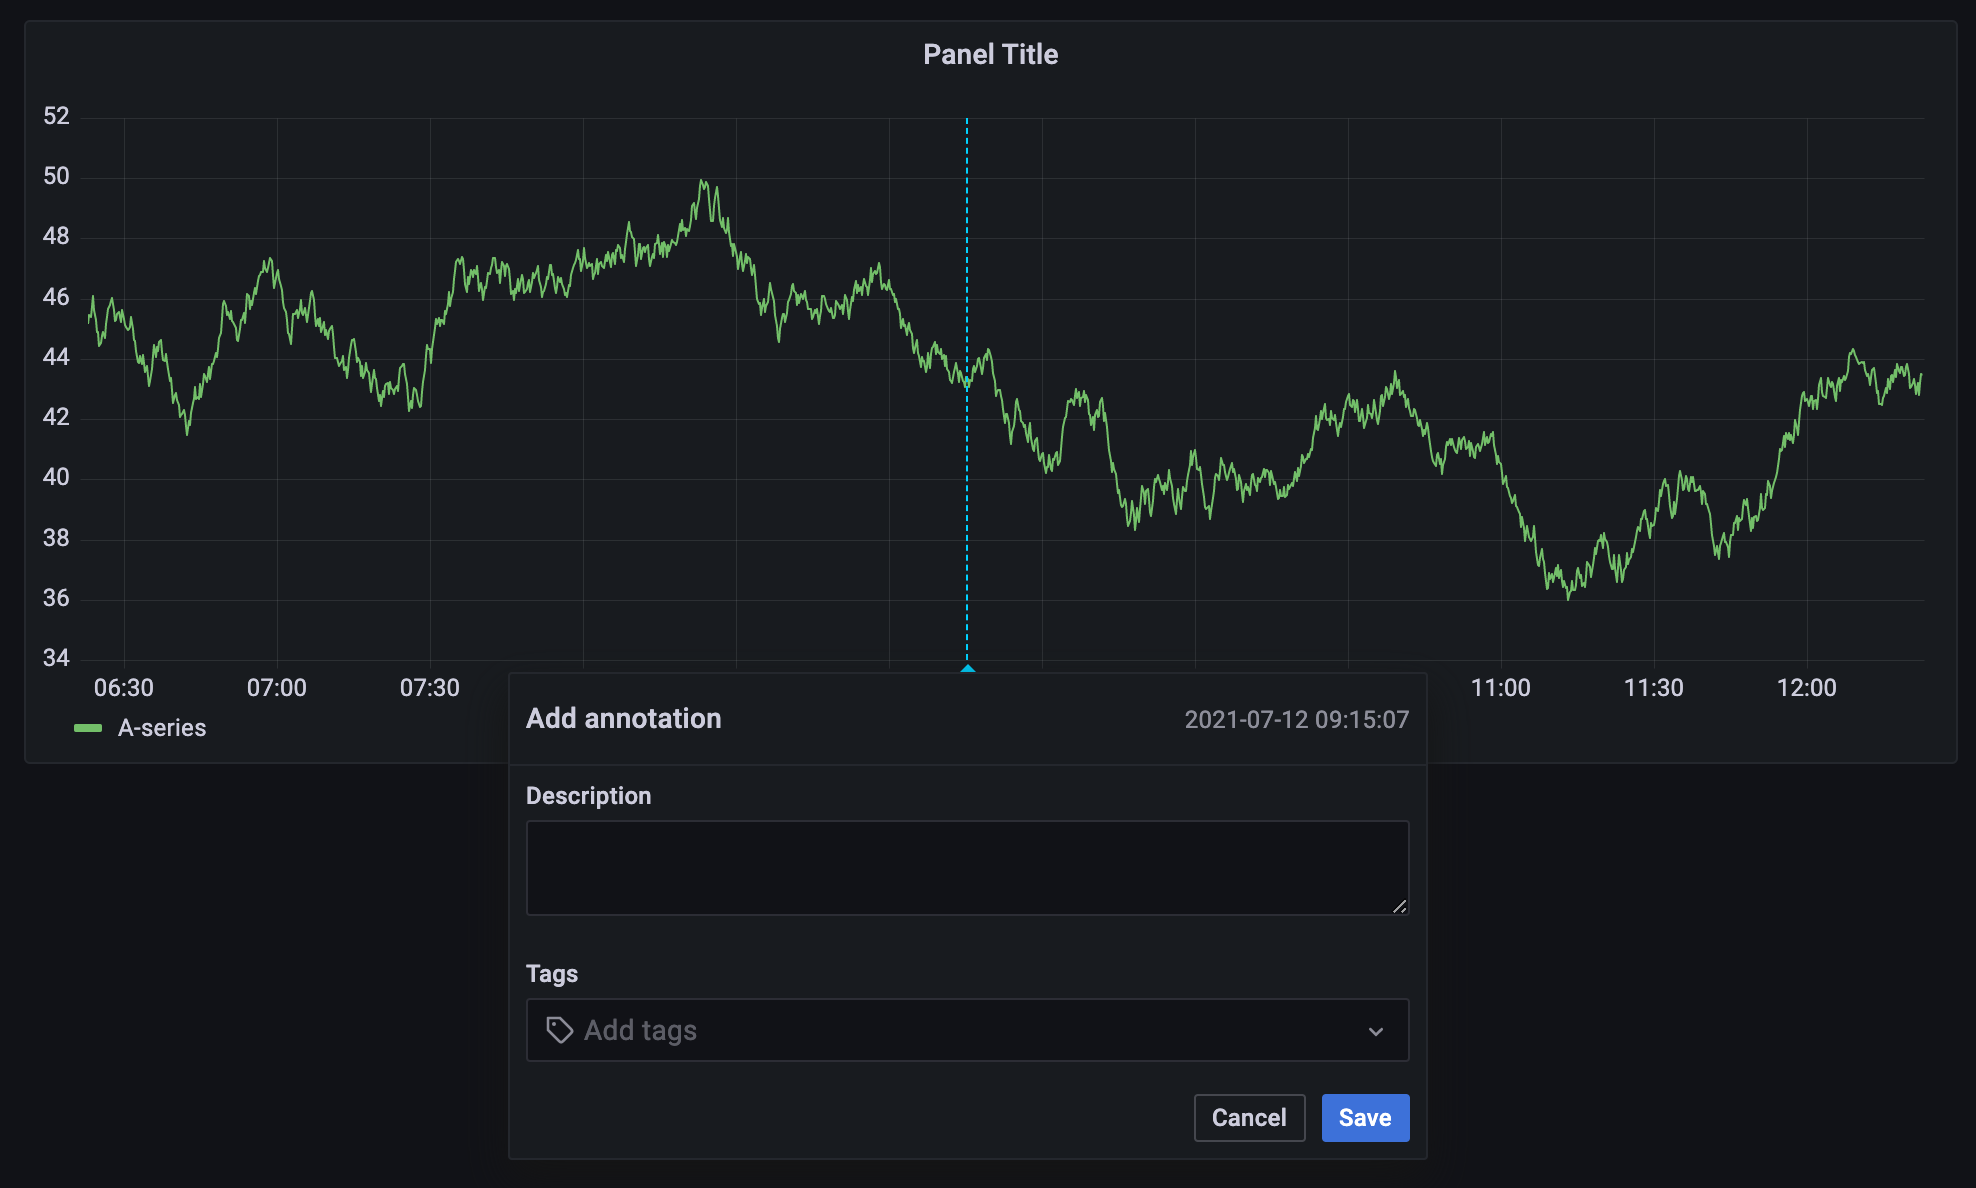
Alternatively, to add an annotation, press Ctrl/Cmd and click anywhere on the panel, and the Add annotation tooltip appears.
Add a region annotation
- If you’ve just saved a dashboard, refresh the page.
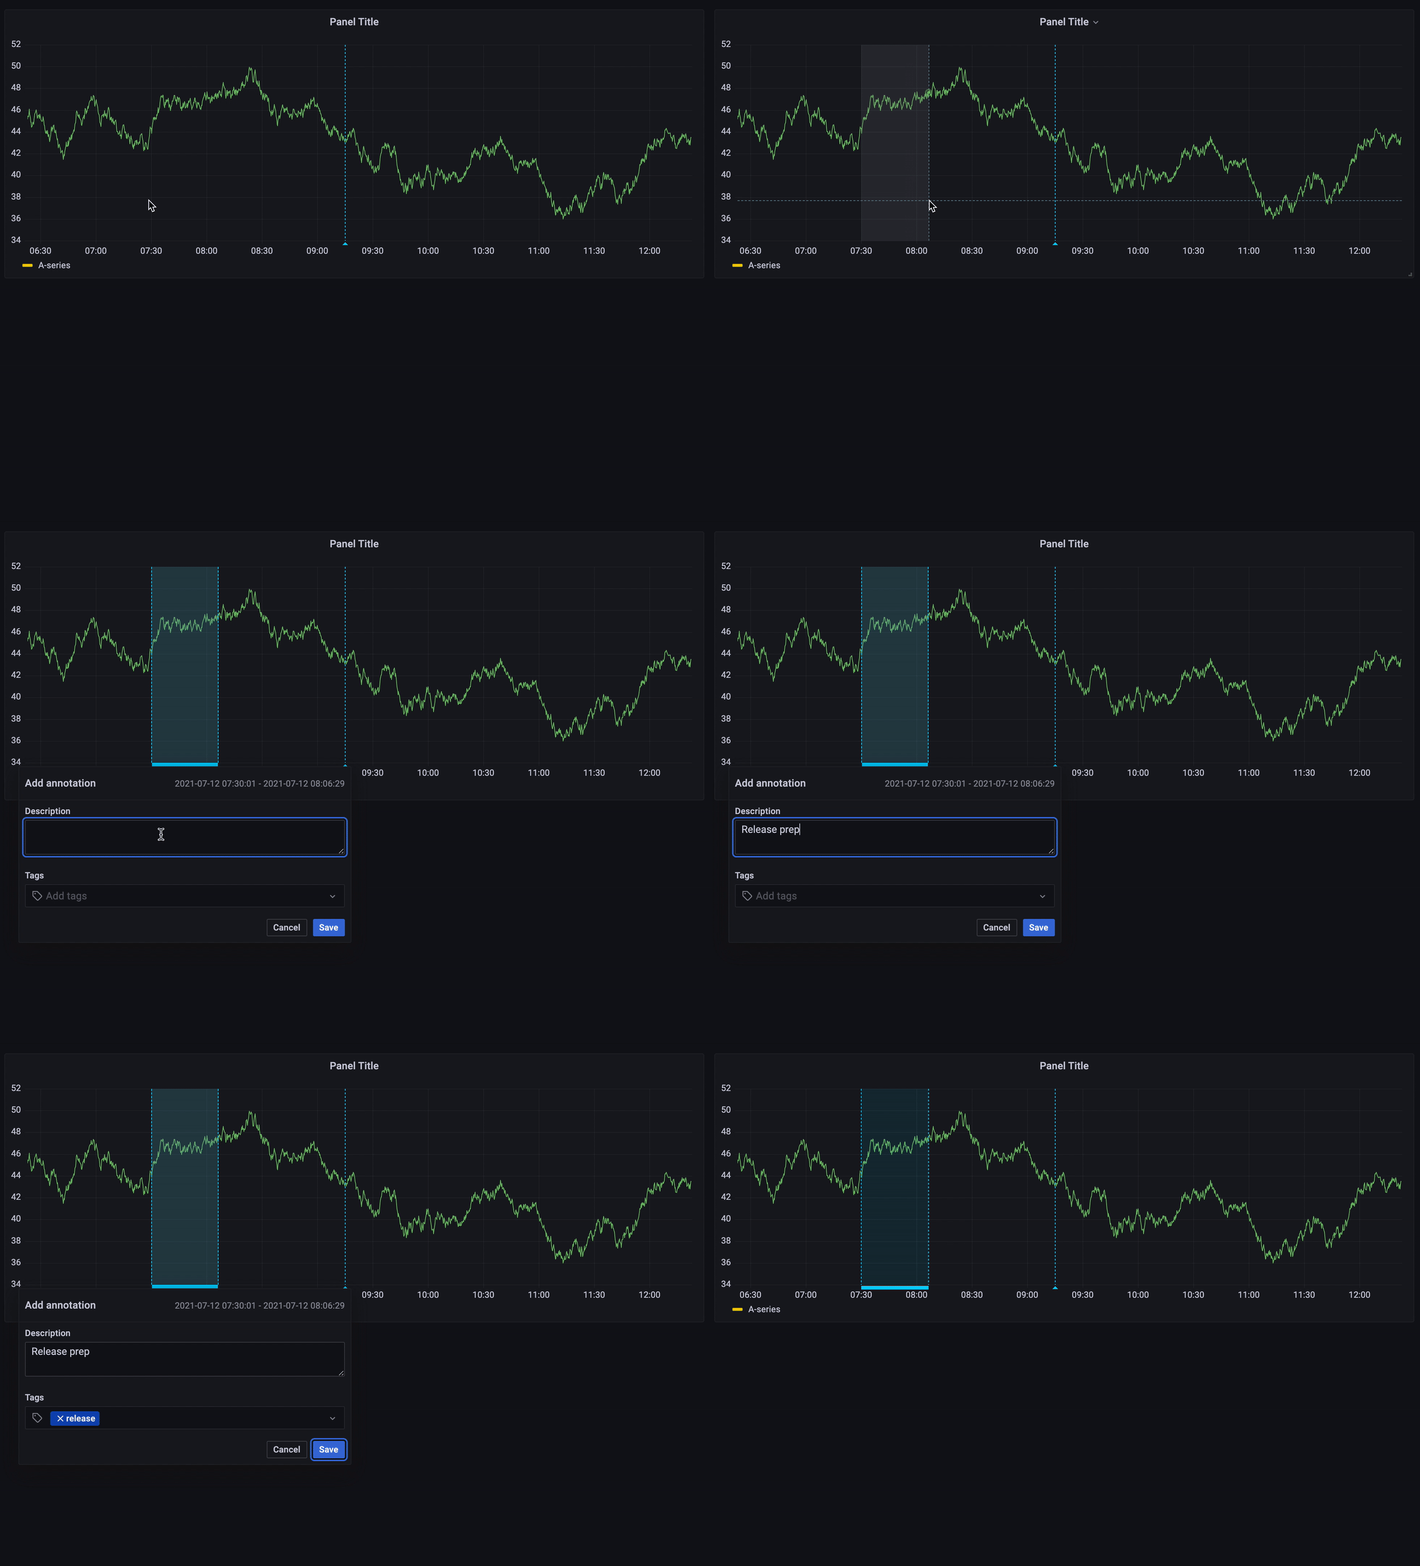
- Press Ctrl/Cmd and click and drag on the panel to open the Add annotation dialog box.
![Add annotation dialog box]()
- Add an annotation description and tags (optional).
- Click Save
Edit an annotation
- Hover over the annotation indicator at the bottom of the panel to open the tooltip.
- Click the pencil icon to open the annotation dialog box.
- Modify the description and tags.
- Click Save.
Delete an annotation
- Hover over the annotation indicator at the bottom of the panel to open the tooltip.
- Click the trash icon to open the annotation dialog box.
Annotation queries
You can add new queries to fetch annotations using any data source, including the built-in data annotation data source. Annotation queries return events that can be visualized as event markers in graphs across the dashboard.
Check out the video below for a quick tutorial.
Add annotation queries
To add an annotation query to a dashboard, follow these steps:
Navigate to the dashboard you want to update.
Click Edit.
Click the Add new element icon (blue plus sign).
Click Annotation query.
Enter a name for the annotation query.
This name is given to the toggle that allows you to enable/disable showing annotation events from this query.
If you don’t want to use the annotation query right away, clear the Enabled checkbox.
Select a color for the annotation event markers.
Select one of the following options in the Show annotation controls in drop-down list to control where the annotation is displayed:
- Above dashboard - The annotation toggle is displayed above the dashboard. This is the default.
- Controls menu - The annotation toggle is displayed in the dashboard controls menu instead of above the dashboard. The dashboard controls menu appears as a button in the dashboard toolbar.
- Hidden - The annotation toggle isn’t displayed on the dashboard.
Select one of the following options in the Show in drop-down list to control the panels in which the annotation is displayed:
- All panels - The annotations are displayed on all panels that support annotations.
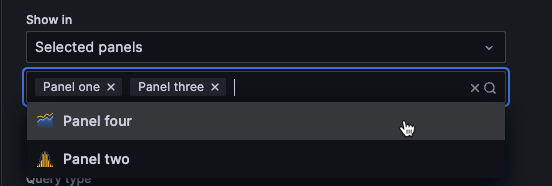
- Selected panels - The annotations are displayed on all the panels you select.
- All panels except - The annotations are displayed on all panels except the ones you select.

Annotation filtering To add a query, do one of the following:
- Click Open query editor to open the Annotation Query dialog box, select an option in the Data source drop-down list, and write or construct a query. The annotation query options are different for each data source. For information about annotations in a specific data source, refer to the specific data source topic. Proceed to the next step.
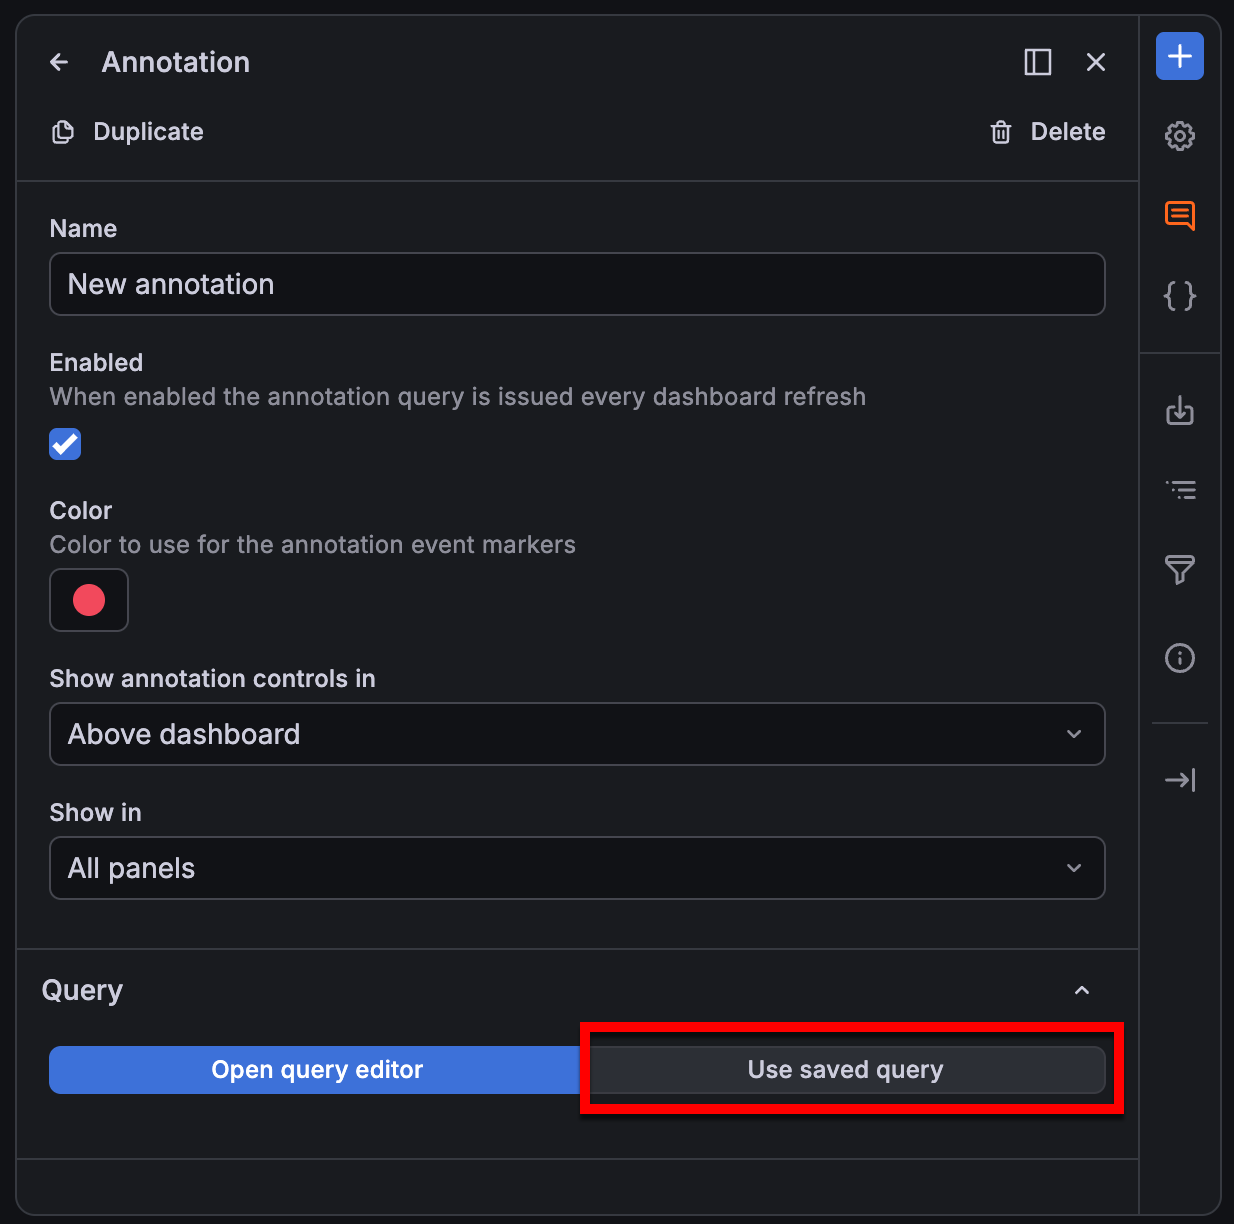
- Click Use saved query to open the Saved queries drawer. Choose a saved query to reuse, click Select query, and proceed to step 13.
- (Optional) Click Test annotation query to ensure that the query is working properly.
- Click Close when you’ve completed the query setup.
- Click Save.
- (Optional) Enter a description of the changes you’ve made.
- Click Save.
- Click Exit edit.
Note
Saved queries is only available on Grafana Enterprise and Grafana Cloud.
Saved queries
Note
Saved queries is only available on Grafana Enterprise and Grafana Cloud.
You can reuse queries you and others in your organization have saved in annotations. This helps users across your organization create annotations without having to create their own queries or know a query language. It also helps you avoid having several users build the same queries for the same data sources multiple times.
Saved queries are supported in:
Learn more about saved queries:
- Saved queries dialog box
- Roles, permissions, and RBAC
- Variables in saved queries
- Manage saved queries as code
- Known limitations
Saved queries dialog box
The Saved queries dialog box gives you access to all the saved queries in your organization:
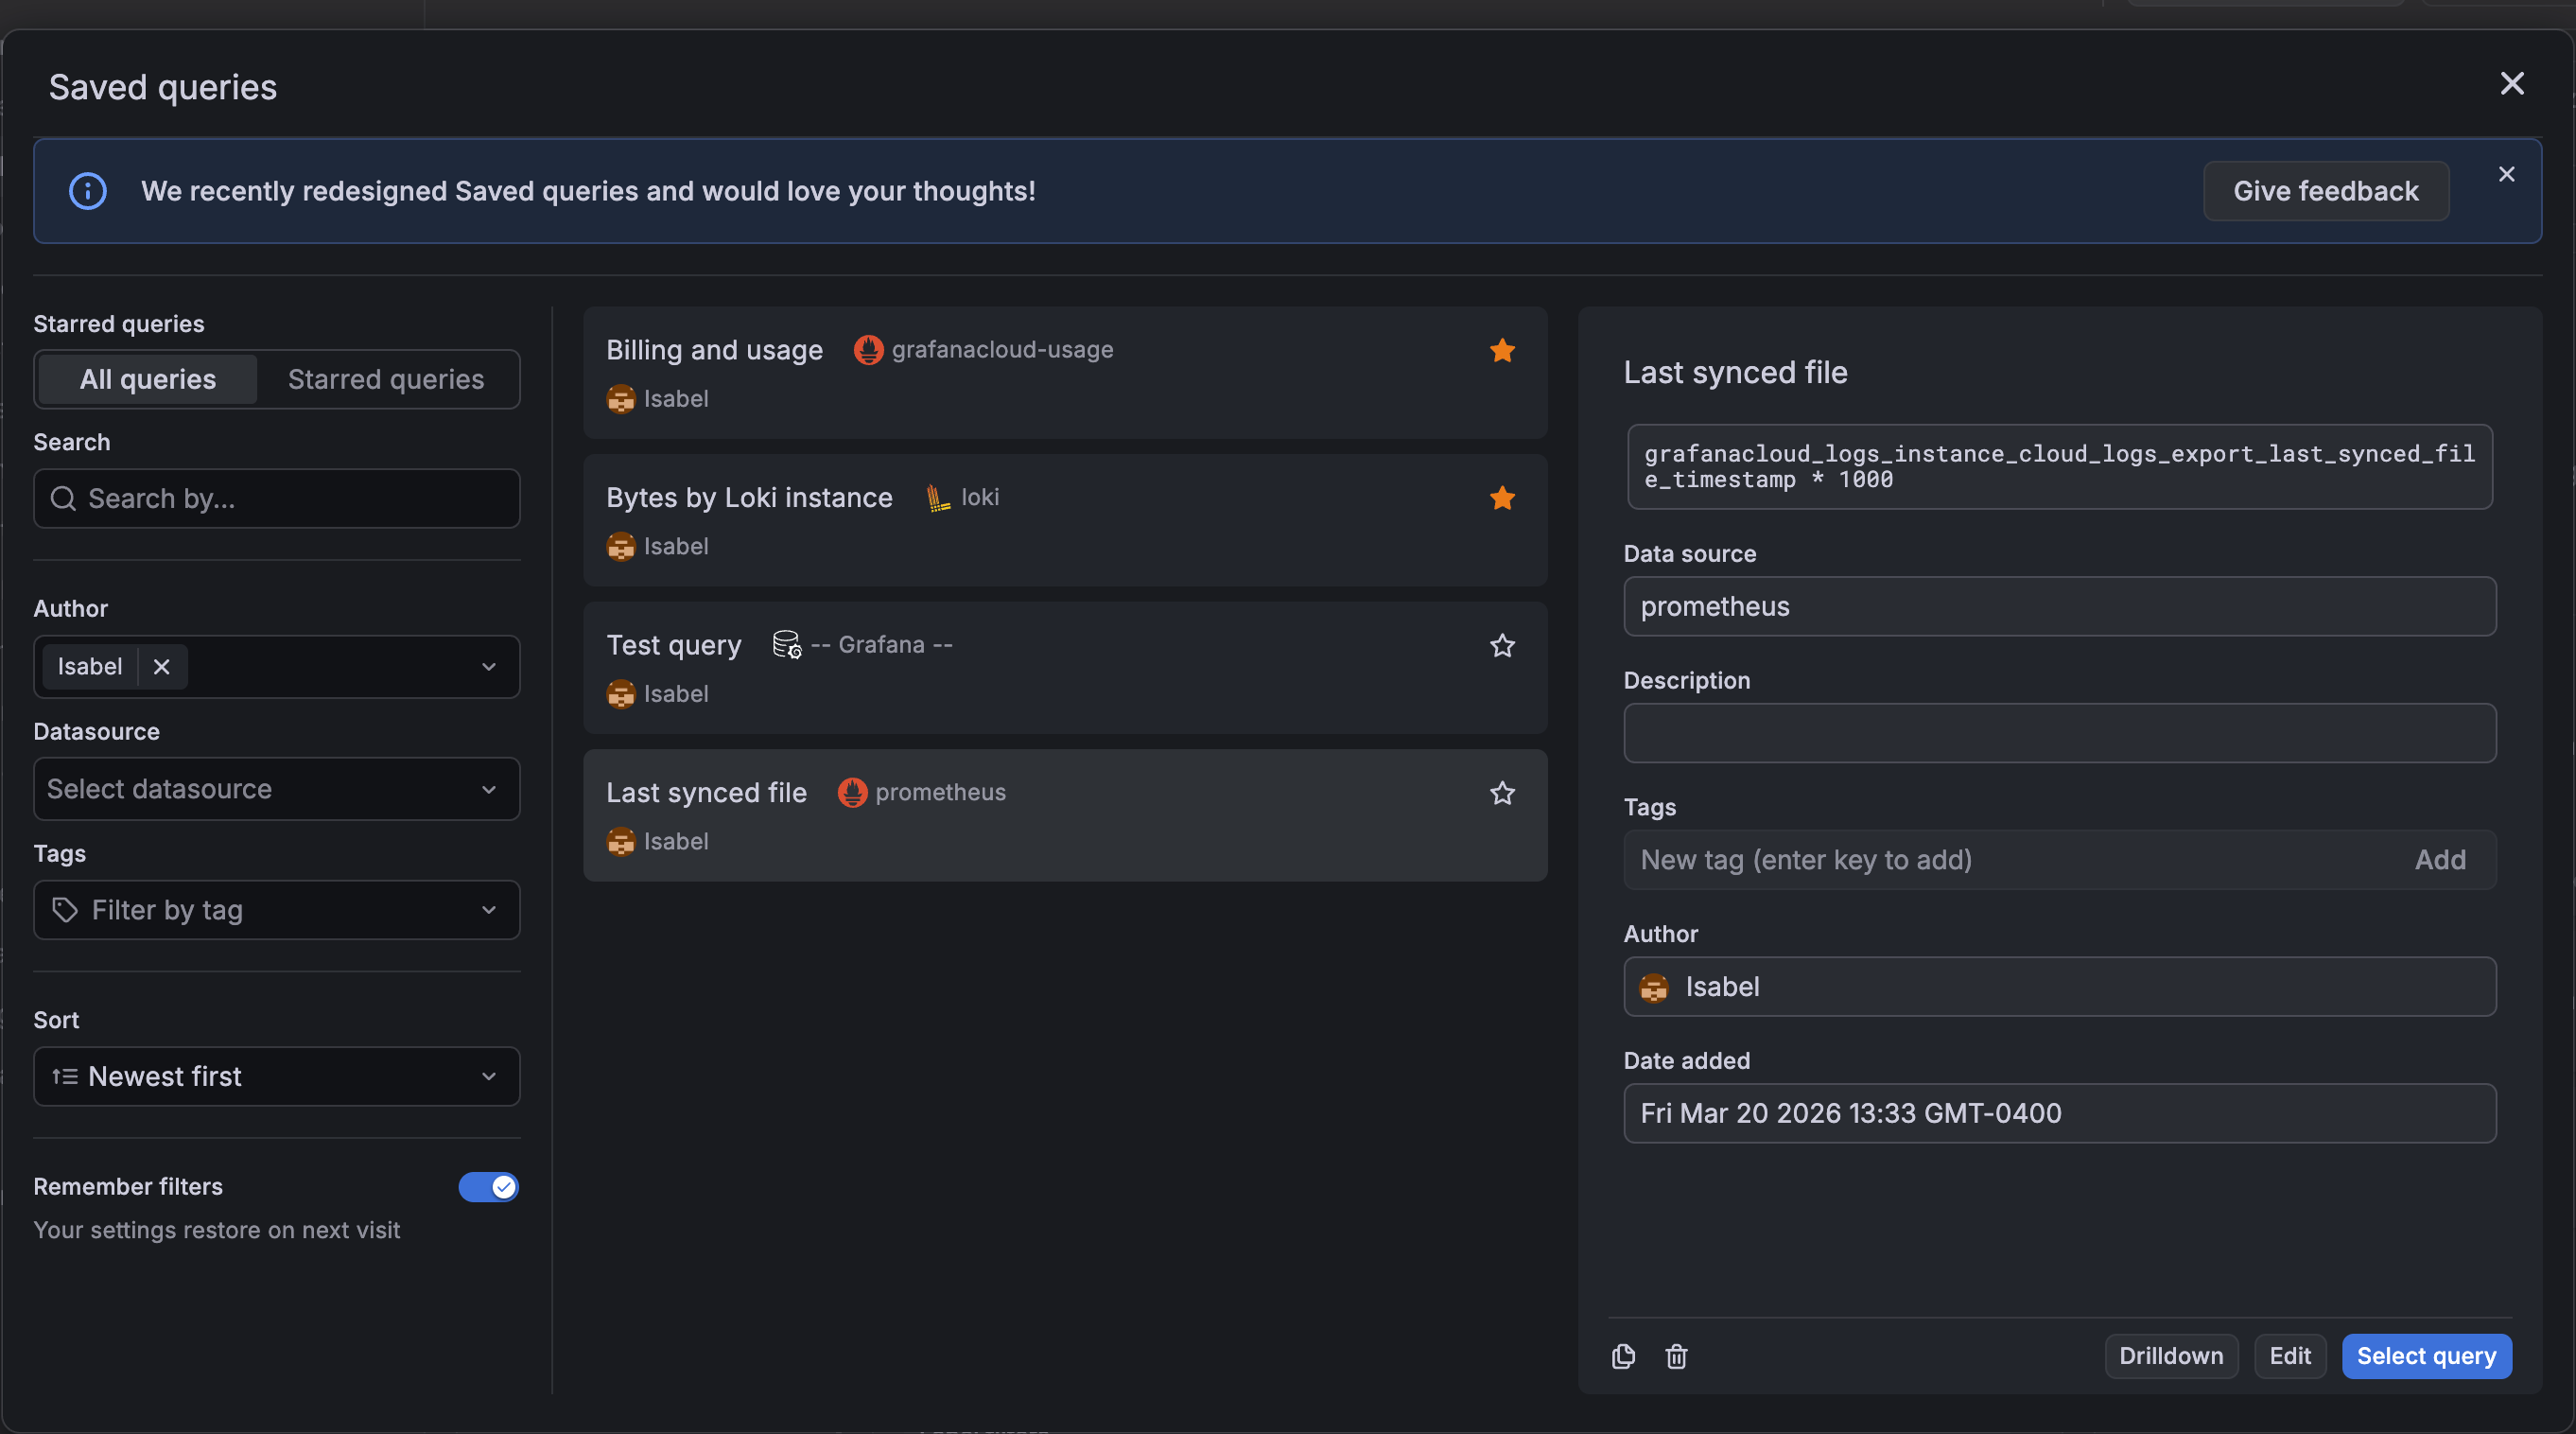
To access saved queries, click Use saved query in the annotations configuration.
Note
To review your saved queries, press
Ctrl + KorCmd + Kto open the command palette and search “Saved queries”. From this view, you can also select a query to open in Explore.
From the Saved queries dialog box, you can:
- Search for queries by data source name, query content, title, or description.
- Sort queries alphabetically or by creation date.
- Filter by data source name, author name, and tags. The tag filter uses the
ORoperator, while the others use theANDoperator. Use the Remember filters switch to persist your filter selections across sessions in your local storage. - Star queries so that they appear in the Starred queries filter view.
- Duplicate or delete a saved query.
- Edit a query title, description, or tags.
You can apply all the same search, filter, and sort options in the Starred queries filter view.
Tip
When you select a query with a Loki, Mimir, Tempo, or Pyroscope data source, the Saved queries dialog box displays a Drilldown button. Click the button to open the associated Drilldown app, while maintaining the context of the query. Learn more about these apps in the Drilldown documentation.
Roles, permissions, and RBAC
Saved queries support role-based access controls. By default, saved queries have two RBAC roles:
- Writer: Create, update, and delete all saved queries.
- Reader: Reuse saved queries.
If you used saved queries prior to the addition of RBAC support in Grafana v12.4, Grafana user roles are mapped as follows:
- Admin > Writer
- Editor > Writer
- Viewer > Reader
Variables in saved queries
If a saved query includes variables, you can substitute the variables in the query without modifying it. This is useful in environments where variable names or available values differ between dashboards.
You can map the original variables to either:
- A variable in your dashboard
- A custom value that you enter
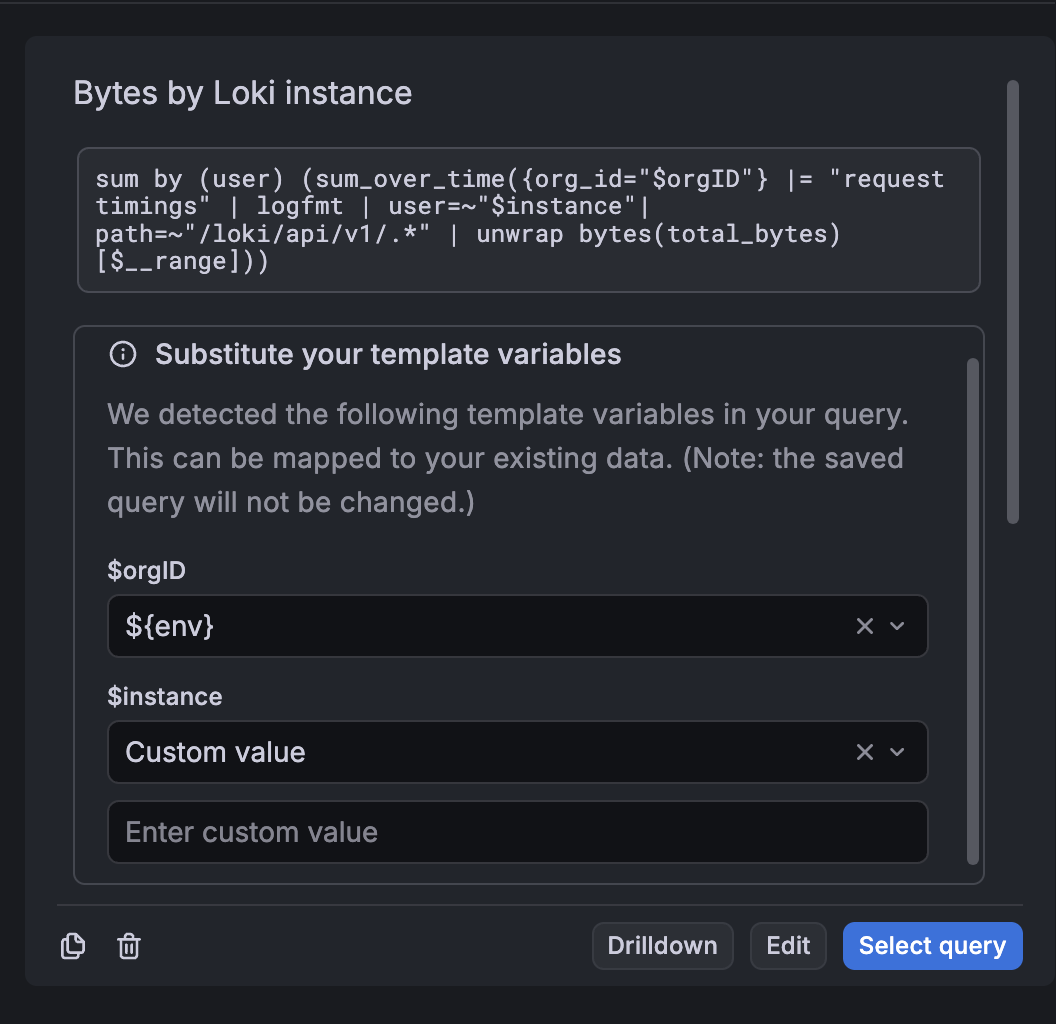
Grafana applies your selections to the query before inserting it into the dashboard. However, the substitutions only apply to the query when it’s reused, and the original saved query remains unchanged.
Manage saved queries as code
You can manage saved queries as code with the Grafana Terraform provider, which lets you version-control your query library and keep it consistent across instances. For more information, refer to Manage saved queries using Terraform.
Known limitations
- No validation is performed when you save a query, so it’s possible to save an invalid query. You should confirm the query is working properly before you save it.
- You can save a maximum of 1000 queries.
Built-in query
After you add an annotation, they are still visible. This is due to the built-in annotation query that exists on all dashboards. This annotation query fetches all annotation events that originate from the current dashboard, which are stored in Grafana, and show them on the panel where they were created. This includes alert state history annotations.
By default, the built-in annotation query uses the -- Grafana -- special data source, and manual annotations are only supported using this data source. You can use another data source in the built-in annotation query, but you’ll only be able to create automated annotations using the query editor for that data source.
To add annotations directly to the dashboard, this query must be enabled.
To confirm if the built-in query is enabled, take the following steps:
Click Edit in the top-right corner of the dashboard.
Click the Dashboard options icon in the toolbar.
In the sidebar, expand the Annotations section.
Expand the Hidden section of annotations.
Select the Annotations & Alerts (Built-in).
Check if the Enabled checkbox is selected.
If you don’t want annotations to be fetched and drawn, clear the checkbox.
Click Save.
Enter an optional description of your changes and click Save.
Click Exit edit.
When you copy a dashboard using the Save As feature it gets a new dashboard id, so annotations created on the source dashboard is no longer be visible on the copy. You can still show them if you add a new Annotation Query and filter by tags. However, this only works if the annotations on the source dashboard had tags to filter by.
Following are some query options specific to the built-in annotation query.
Filter queries by tag
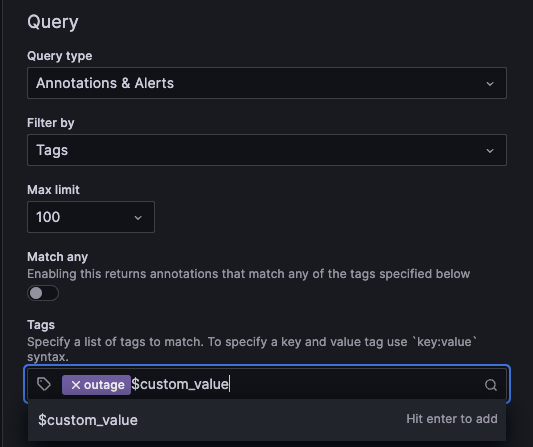
You can create new queries to fetch annotations from the built-in annotation query using the -- Grafana -- data source by setting Filter by to Tags.
Grafana also supports typeahead of existing tags, provide at least one tag.
For example, create an annotation query name outages and specify a tag outage. This query shows all annotations (from any dashboard or via API) with the outage tag. If multiple tags are defined in an annotation query, then Grafana only shows annotations matching all the tags. To modify the behavior, enable Match any, and Grafana shows annotations that contain any one of the tags you provided.
Warning
If you enable Display annotations on an externally shared dashboard that uses tag-based annotation queries, those queries return matching annotations from all dashboards in the organization. This means annotations from dashboards that are not shared externally are visible to anyone with access to the shared dashboard. This is by design. Review which annotations might match your tags before enabling this option on a shared dashboard.
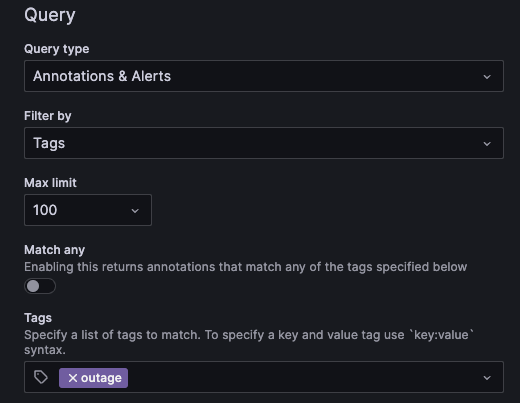
You can also use template variables in the tag query. This means if you have a dashboard showing stats for different services and a template variable that dictates which services to show, you can use the same template variable in your annotation query to only show annotations for those services.
Add time regions
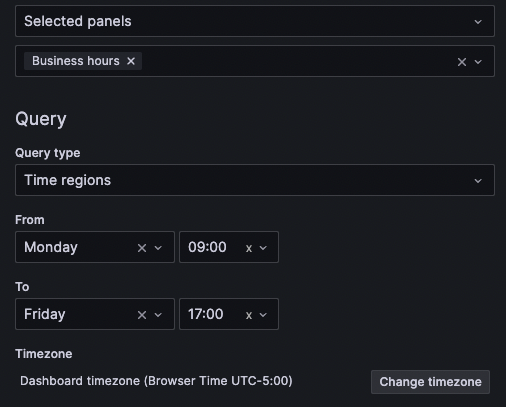
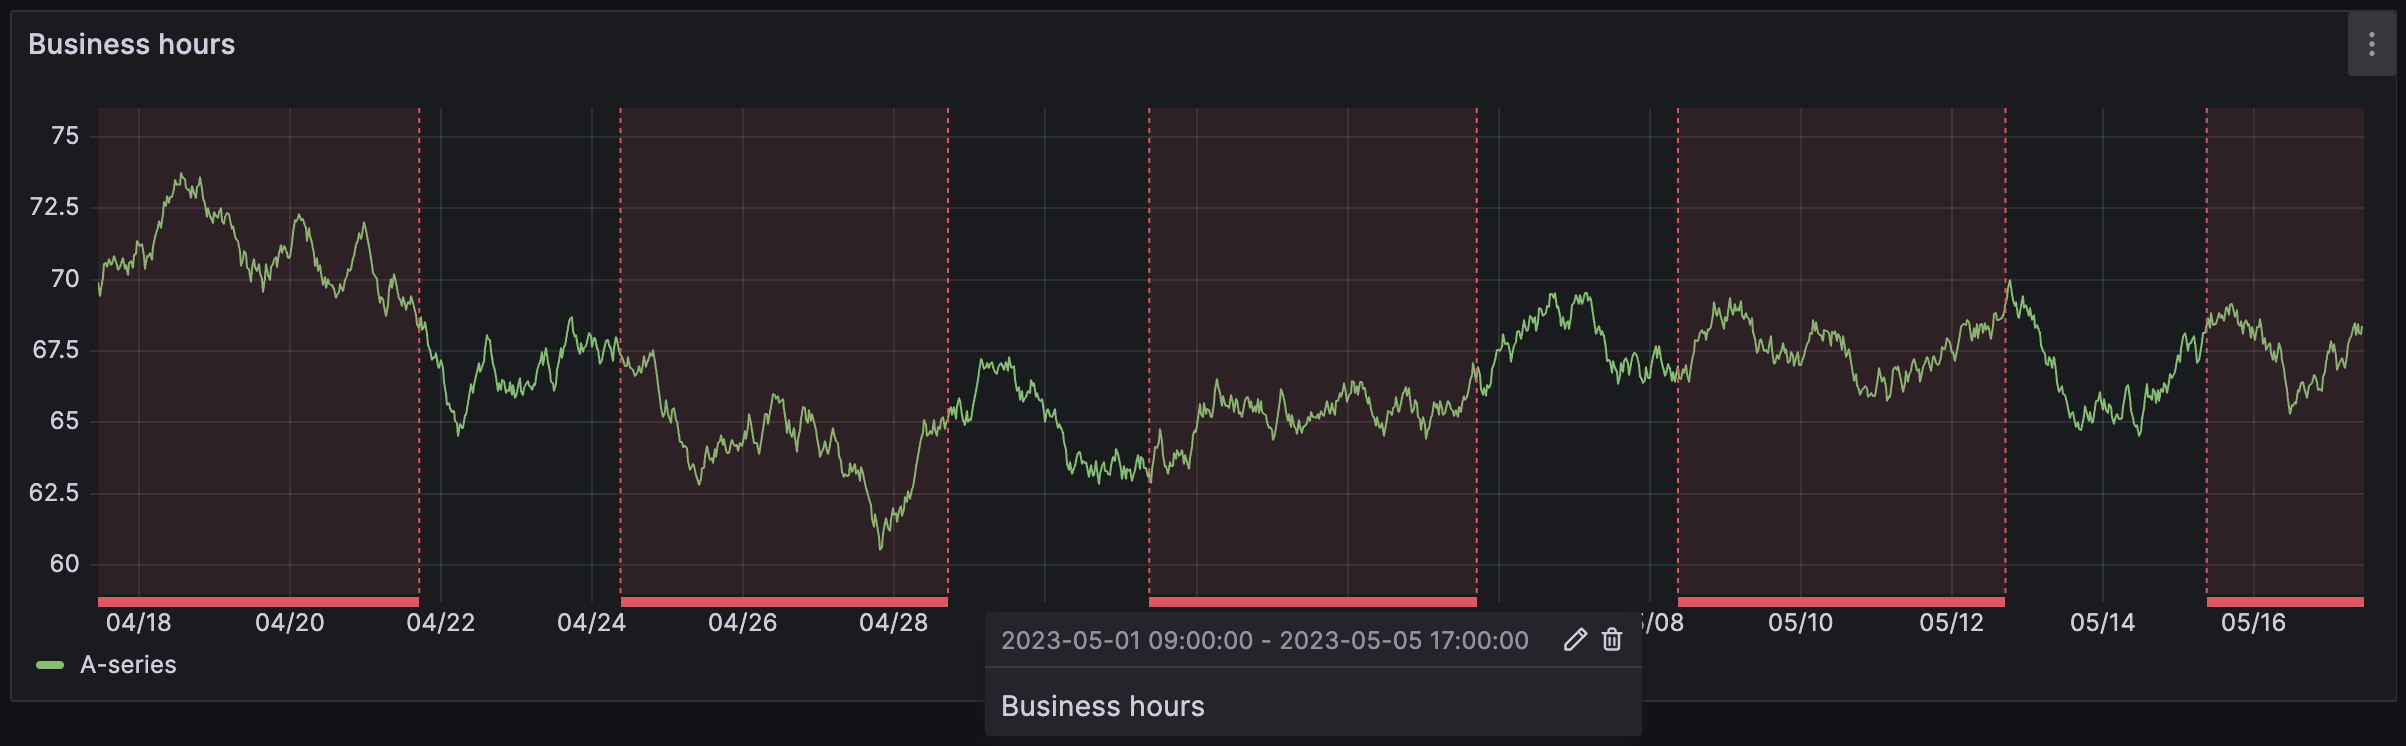
When adding or editing an annotation, you can define a repeating time region by setting Query type to Time regions. Then, define the From and To sections with the preferred days of the week and time. You also have the option to change the timezone, which is set to the dashboard’s timezone, by default.
The above configuration produces the following result in the Time series panel:
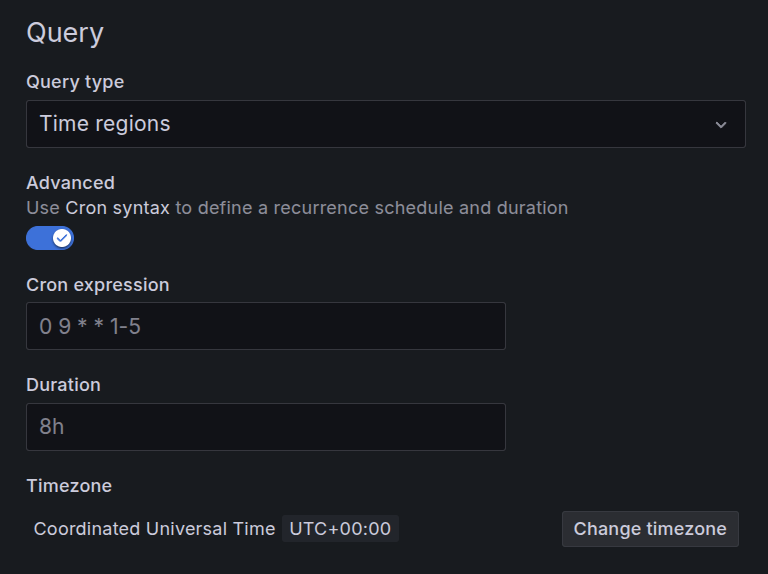
Toggle the Advanced switch and use Cron syntax to set more granular time region controls. The following example sets a time region of 9:00 AM, Monday to Friday:
Was this page helpful?
Related resources from Grafana Labs



