Explore your infrastructure with Kubernetes Monitoring
Kubernetes Monitoring offers visualization and analysis tools for you to:
- Carefully examine your data to evaluate the health, efficiency, and cost of Kubernetes infrastructure components.
- Analyze historical data as well as predictions created with machine learning.
- Discover issues with resource usage to make informed decisions about efficiency and costs.
Navigate to Kubernetes Monitoring
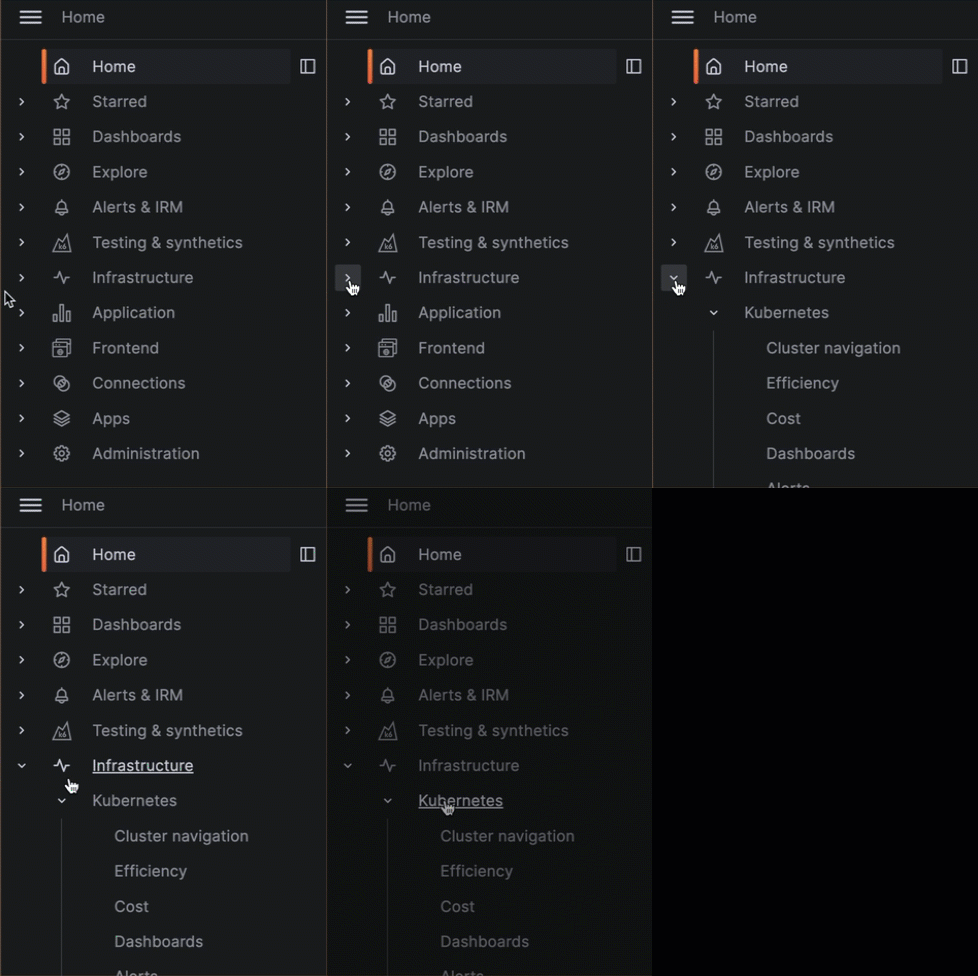
- Navigate to your Grafana Cloud portal.
- In the menu, select the stack you want to work with.
- Click the upper-left menu icon.
- In the main menu, expand Infrastructure, then click Kubernetes.
![Start sending data button Animation of navigating on the menu to Kubernetes]()
Start sending data button
See the issues at a glance
The main Kubernetes page displays a snapshot of issues that exceed specific thresholds (and any associated alerts) for the data source chosen in the drop-down menu.
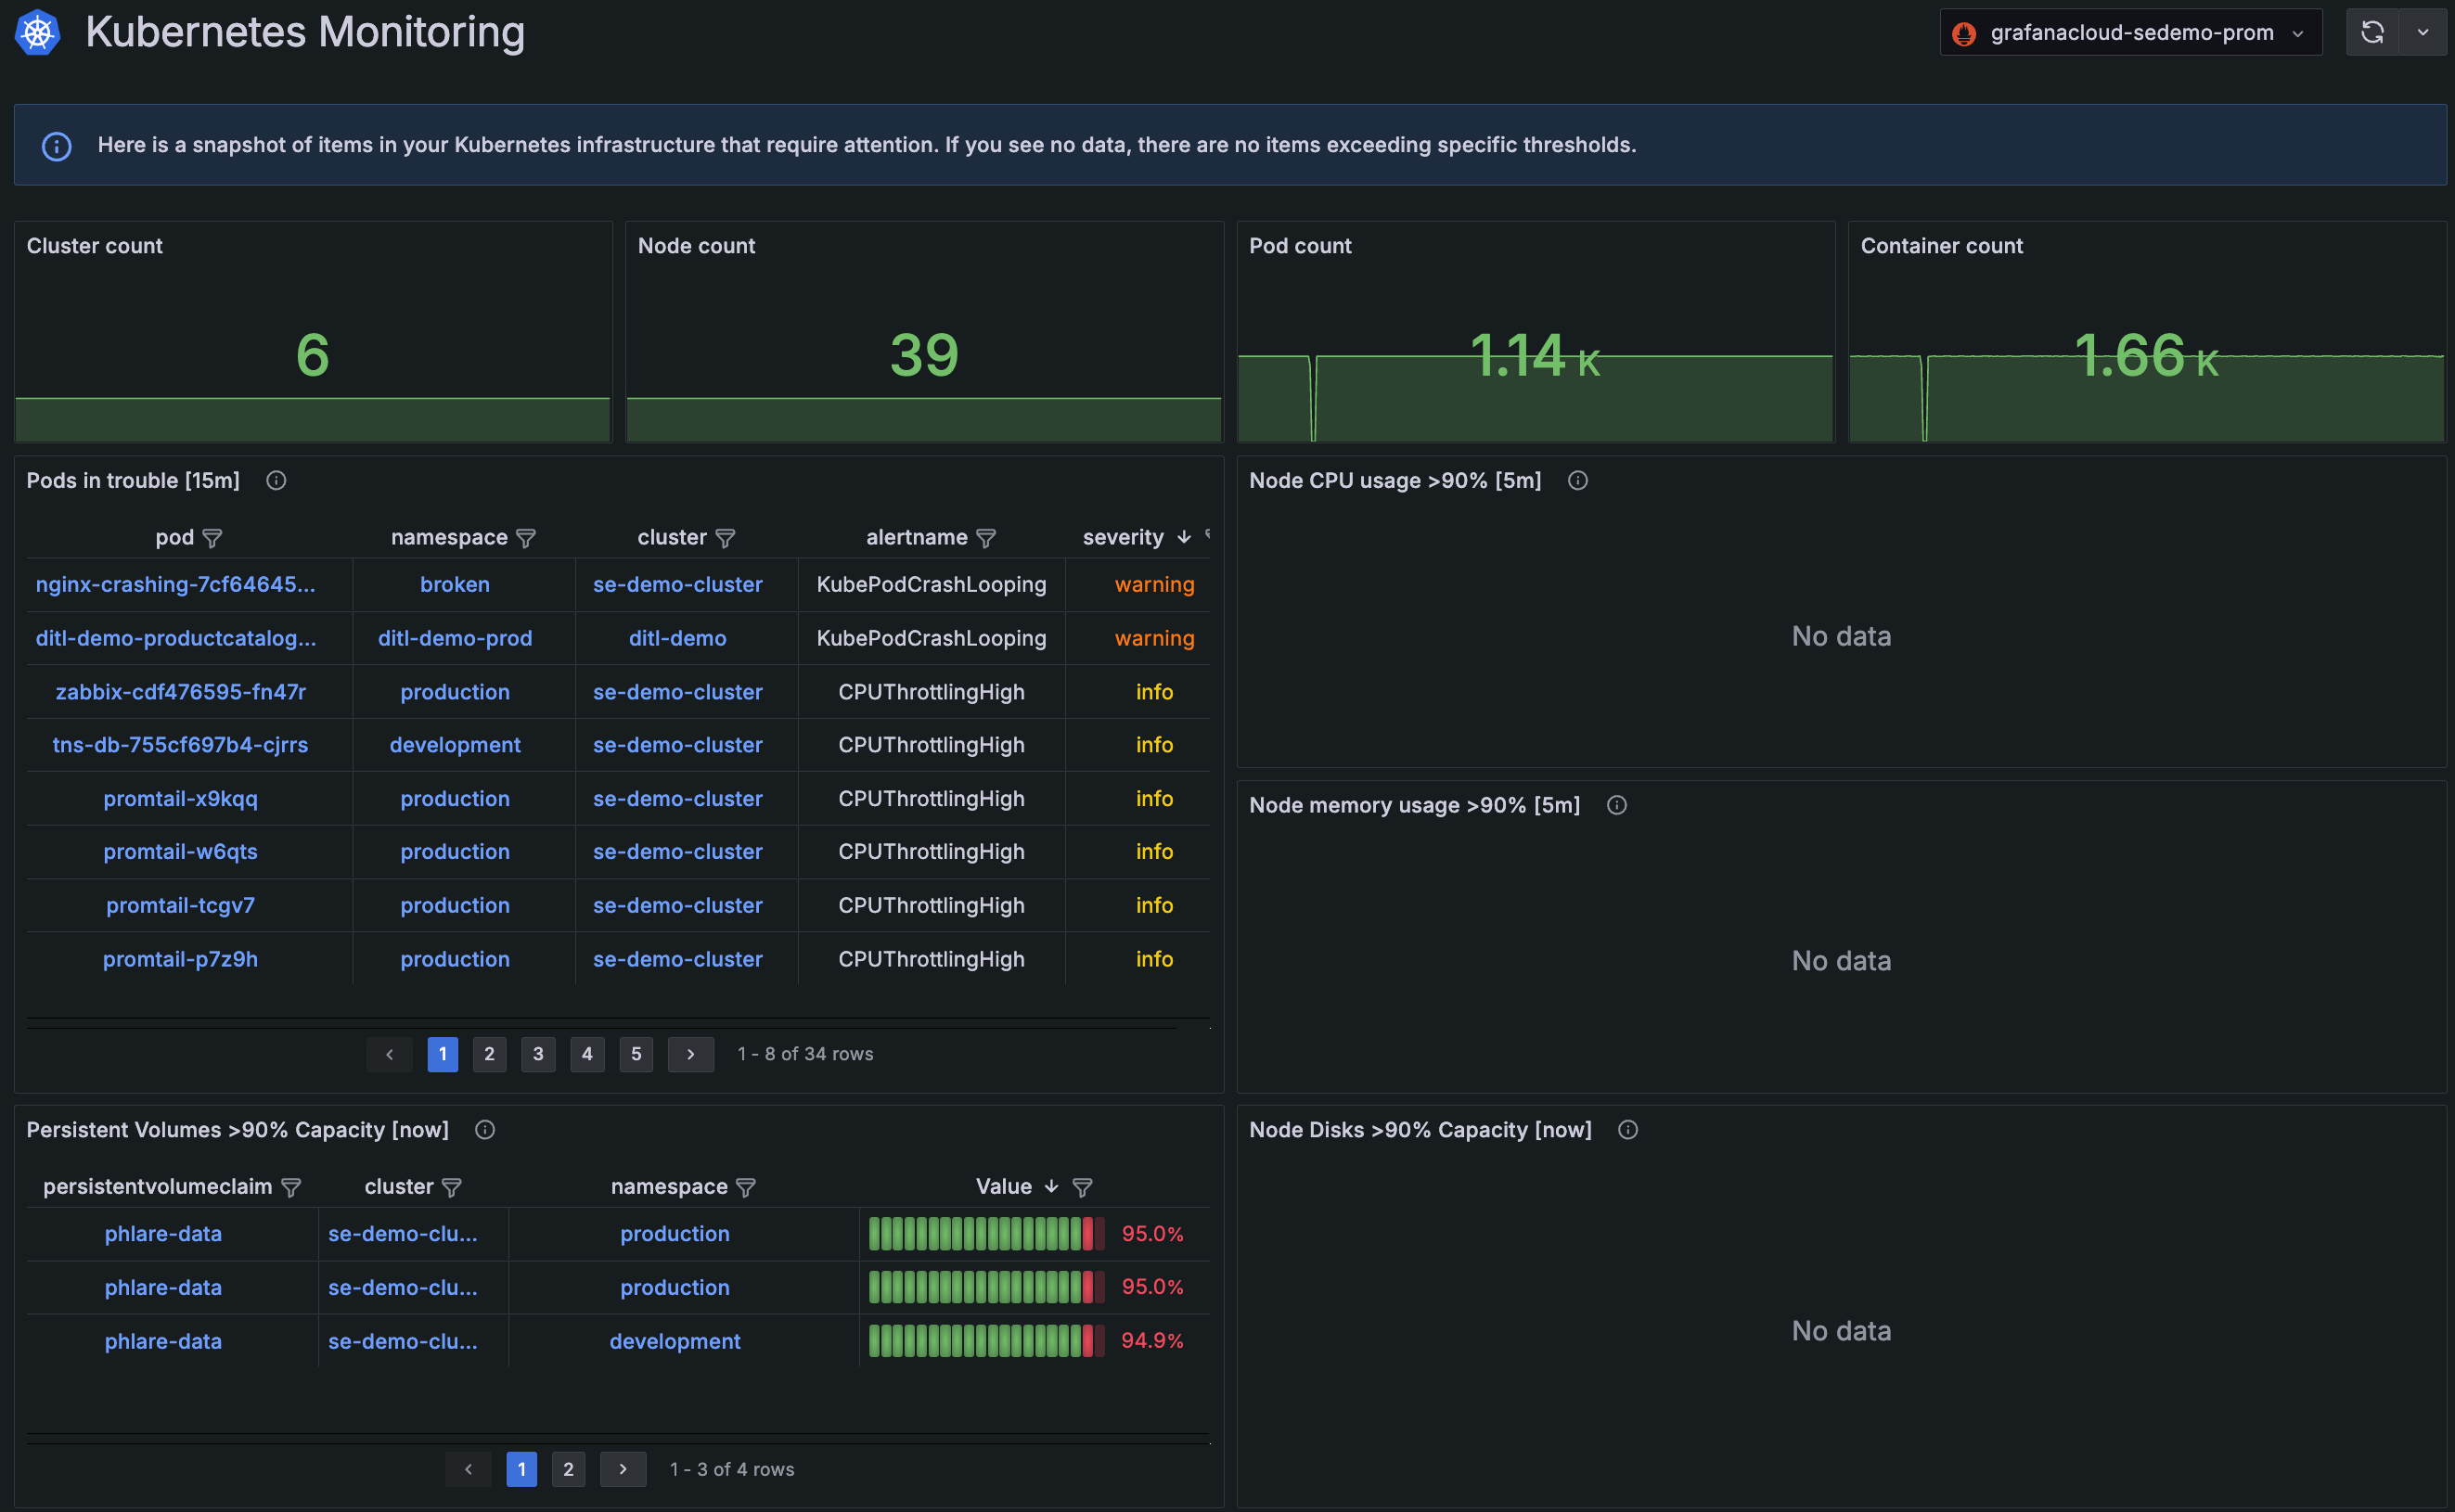
At this view, you can see the graphed counts for Clusters, Nodes, Pods, and containers, as well as:
- Pods that have been in a non-running state for 15 minutes or more
- Node issues with CPU and memory usage over 90% for over 5 minutes, and disks exceeding capacity of over 90%
- Persistent Volumes that have been using over 90% of their capacity
Sort the columns, and with one click, go to Pod, Cluster, Node, and namespace views for greater detail.
Drill into data
Click the Cluster navigation menu item to navigate from Clusters, namespaces, workloads, and Nodes through to containers. Use filters and sorting to target the data you want.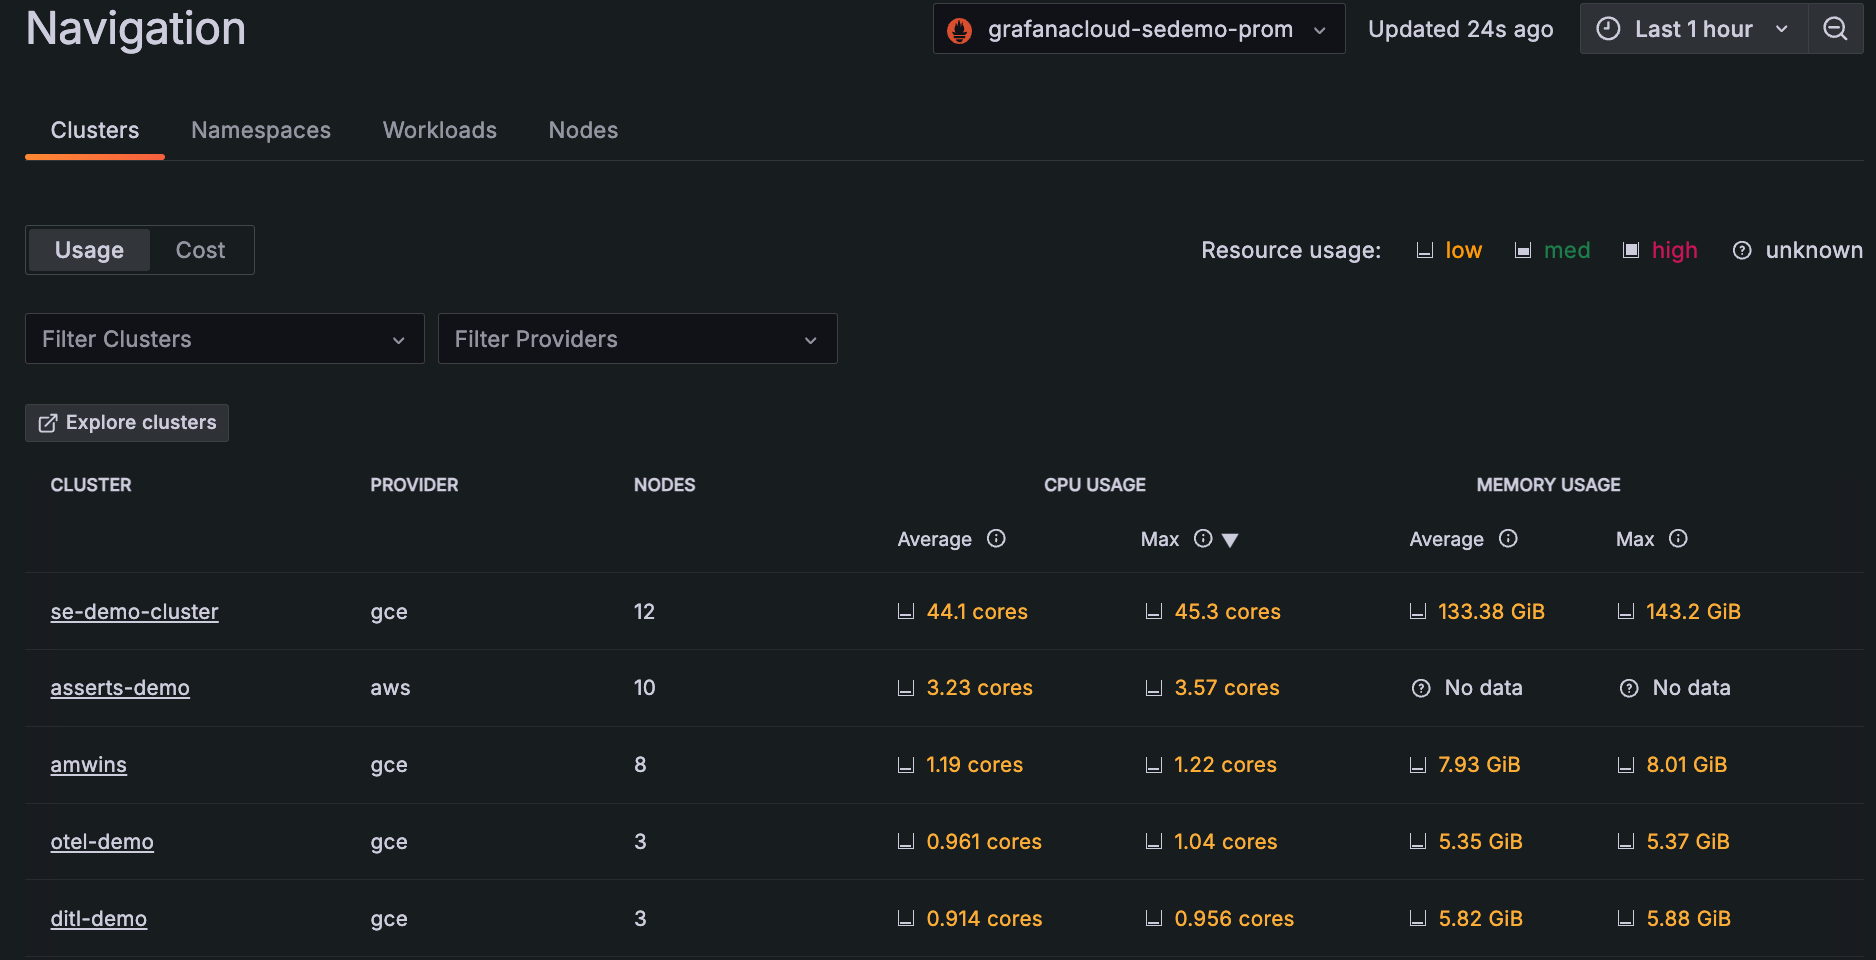
Analyze costs
In the list view on any page, select Cost to see the estimated cost data.
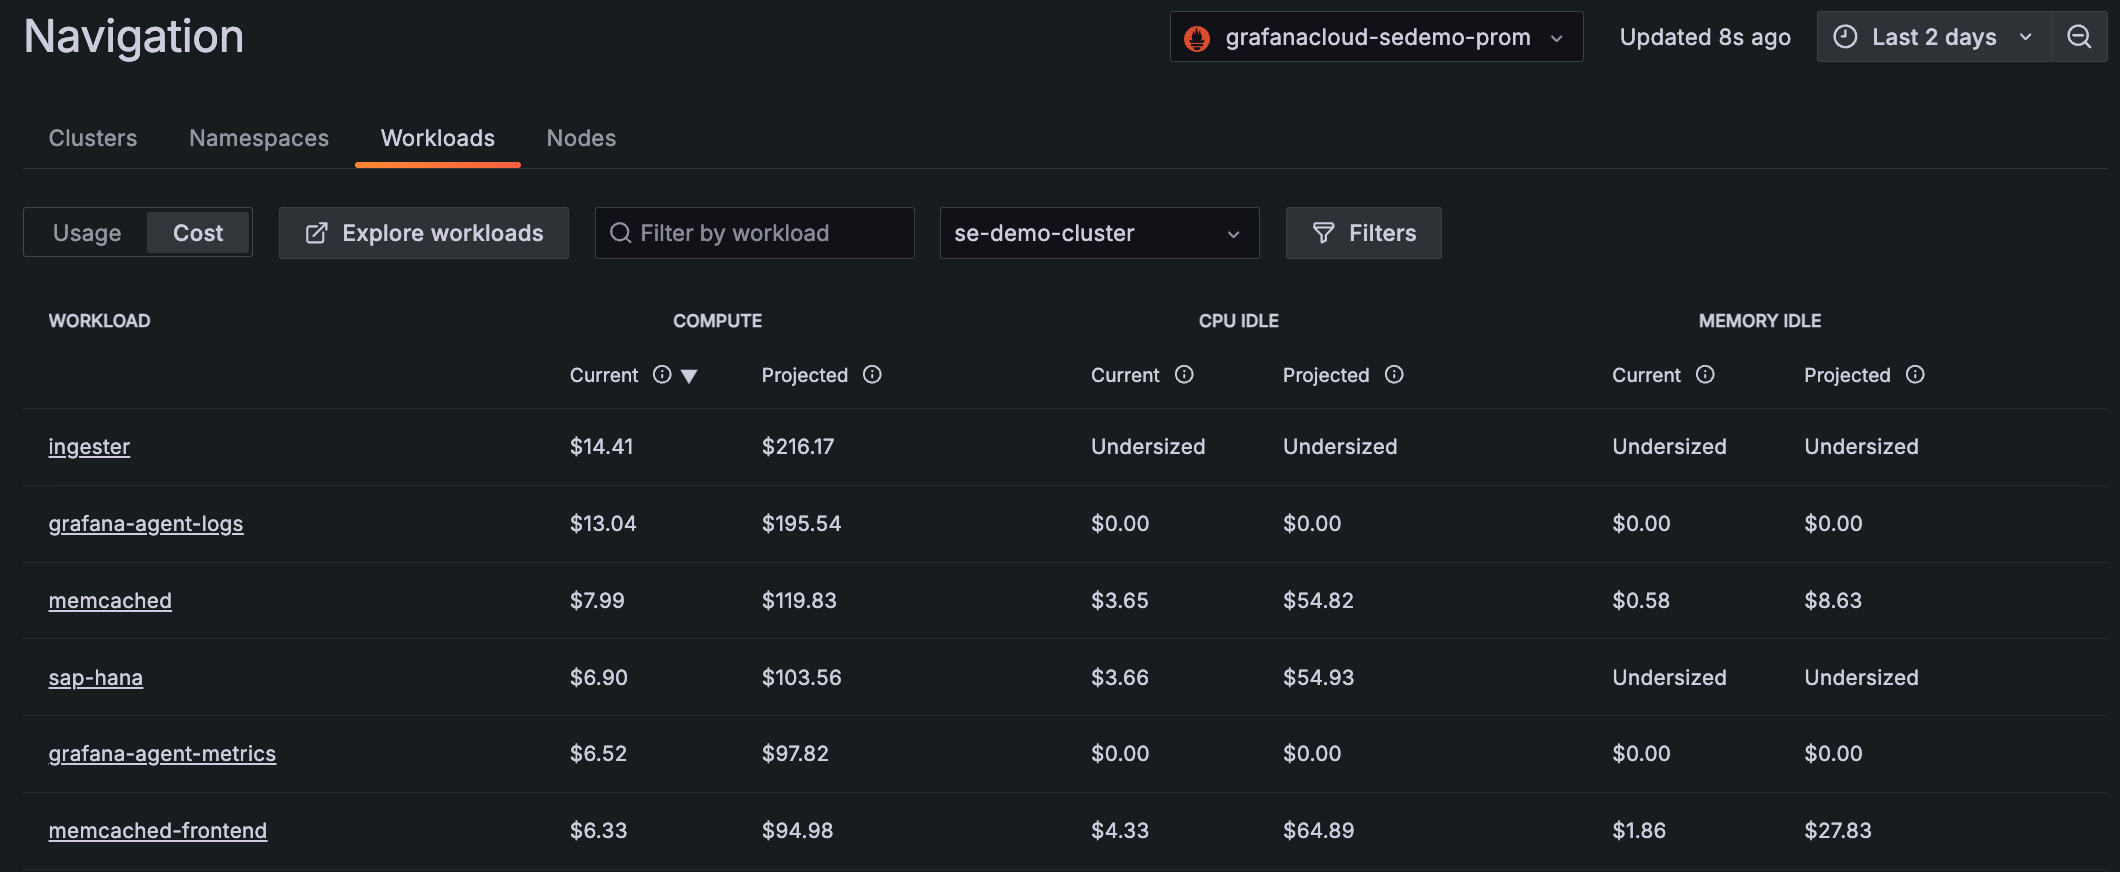
Click Cost on the main menu to view the Cost Overview and Savings pages. Here you can view at a higher level the costs of resources, and the cost per provider if you use more than one.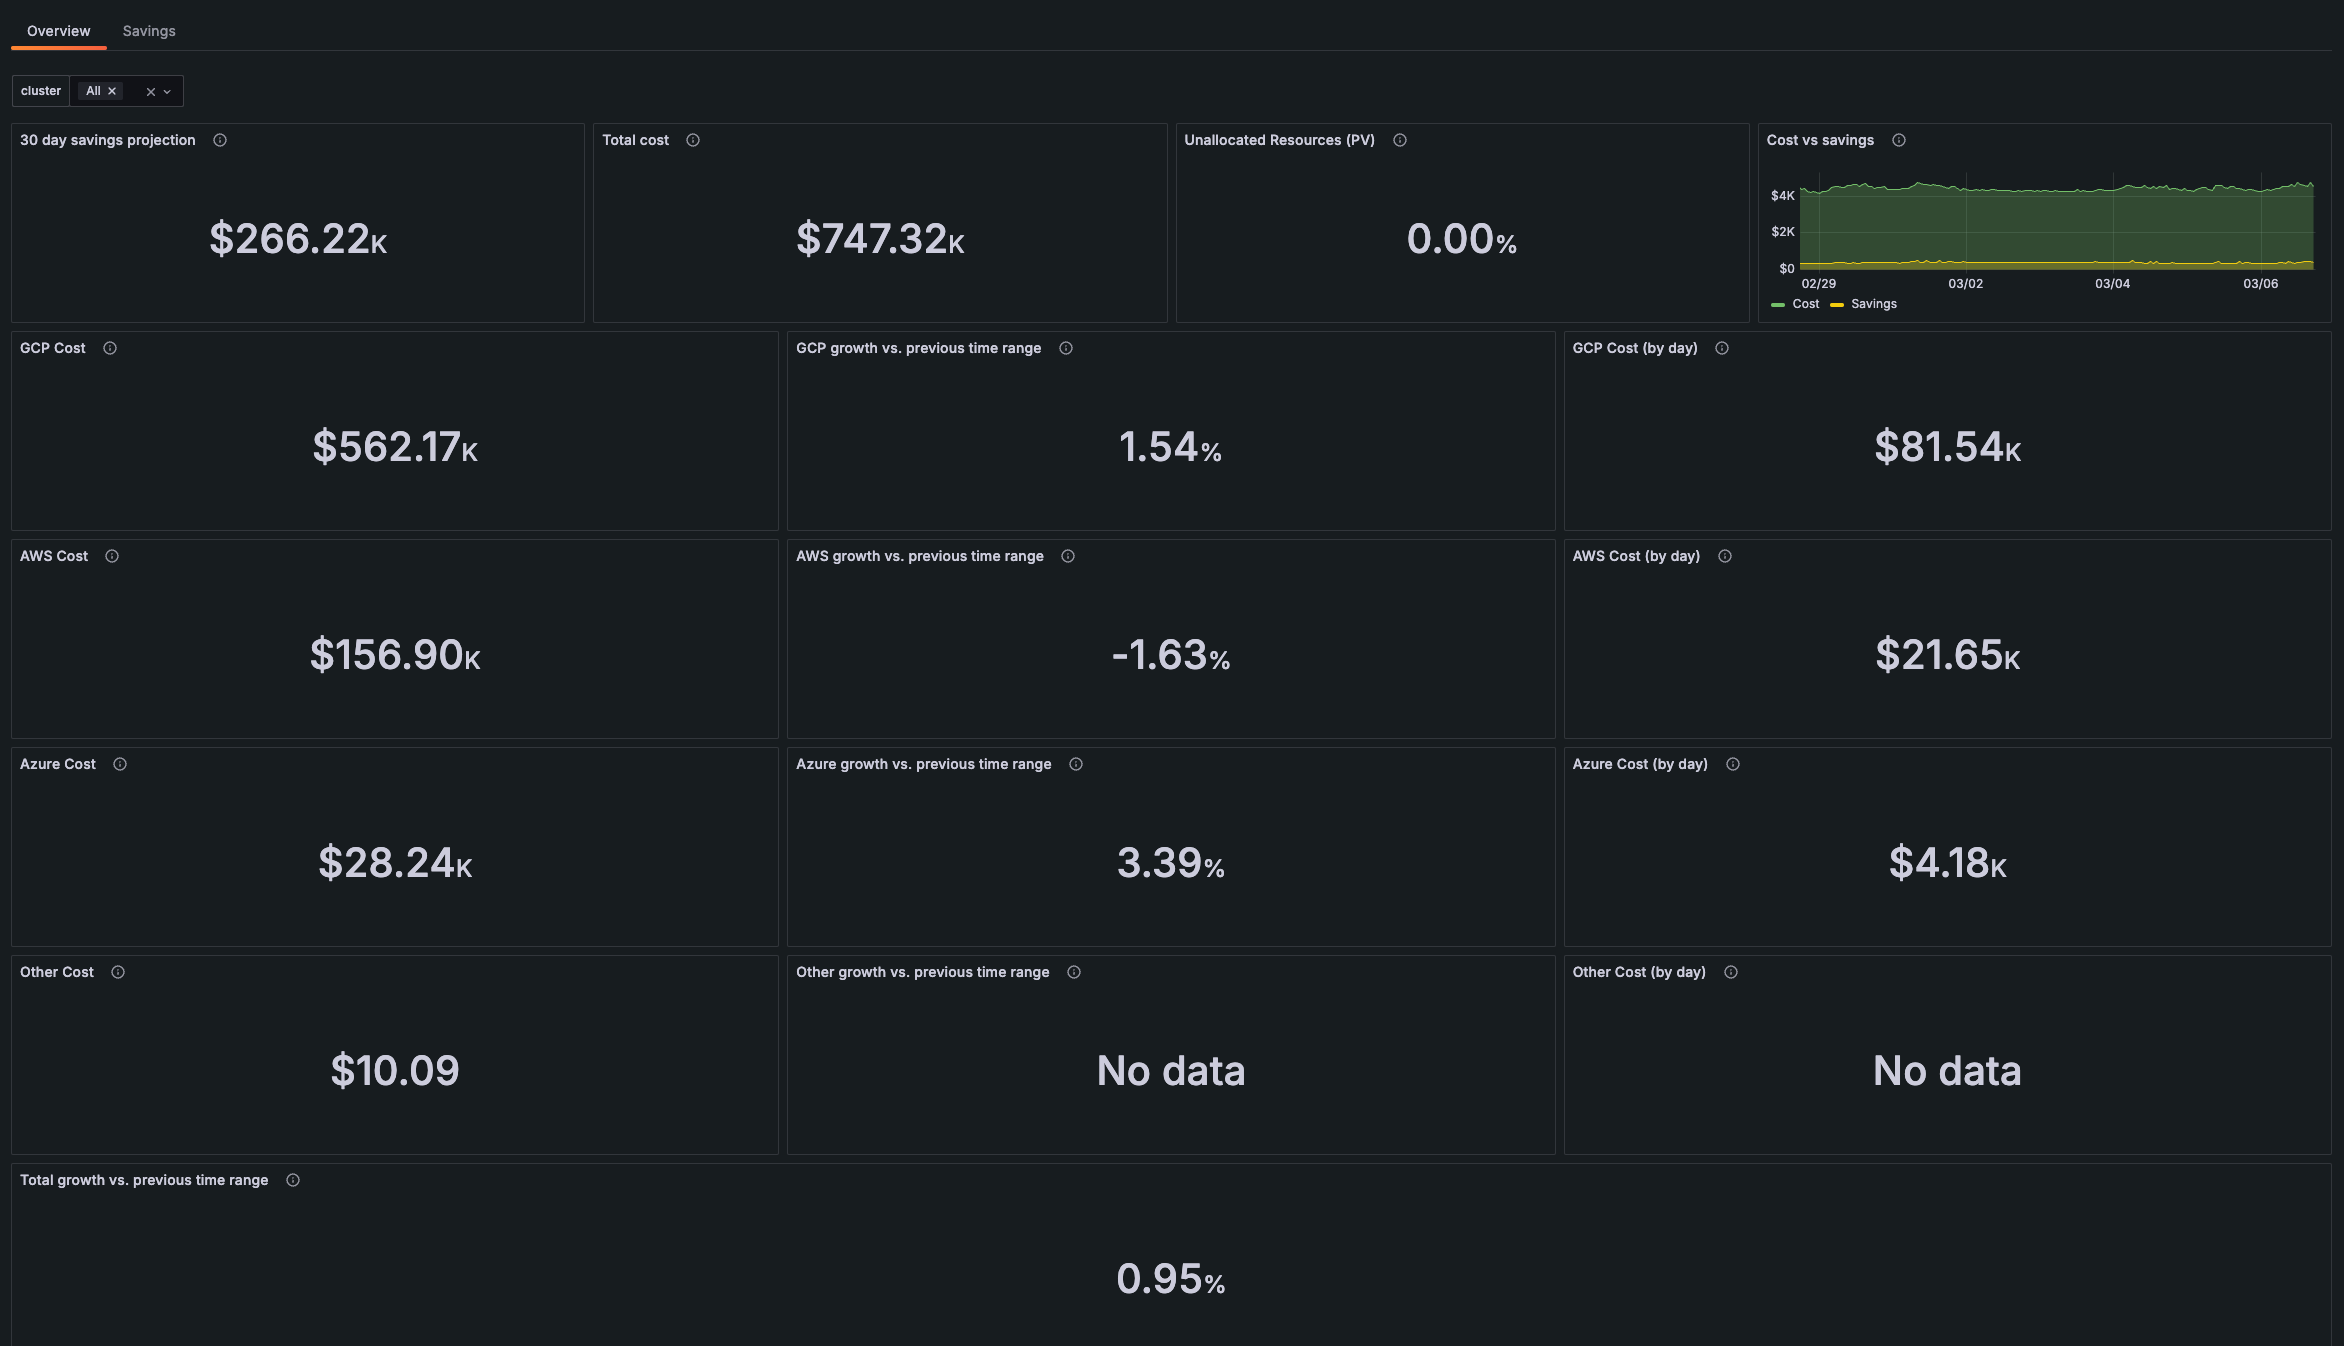
Every detail view provides cost data as well.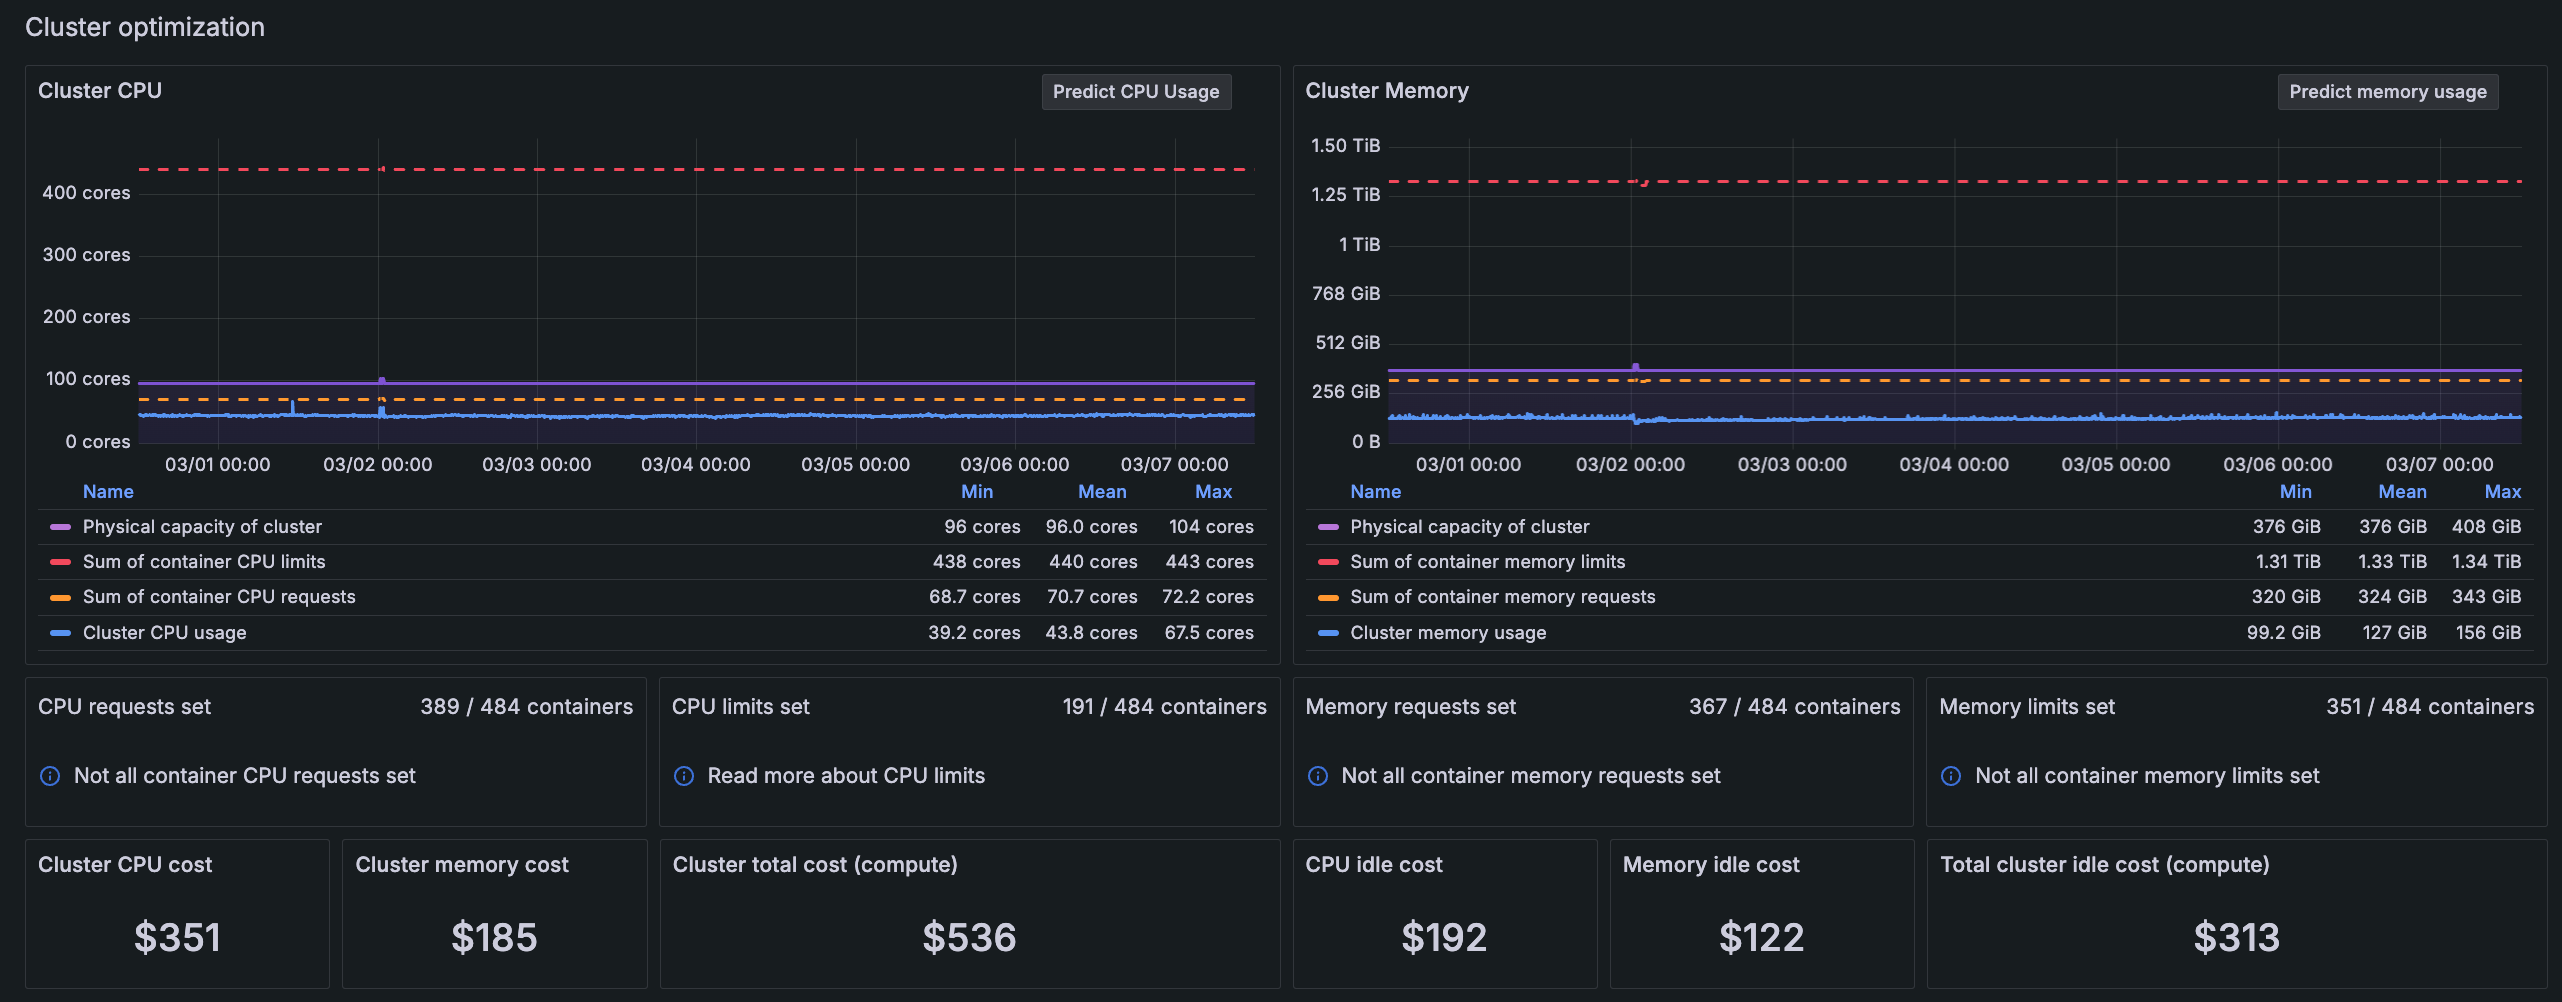
For more information, refer to Manage costs.
Understand efficiency and resource use
Throughout the app, resource usage statistics show for each item so that you can filter and sort to make the best use of your time. In the list view on any page, select Usage to see usage data.
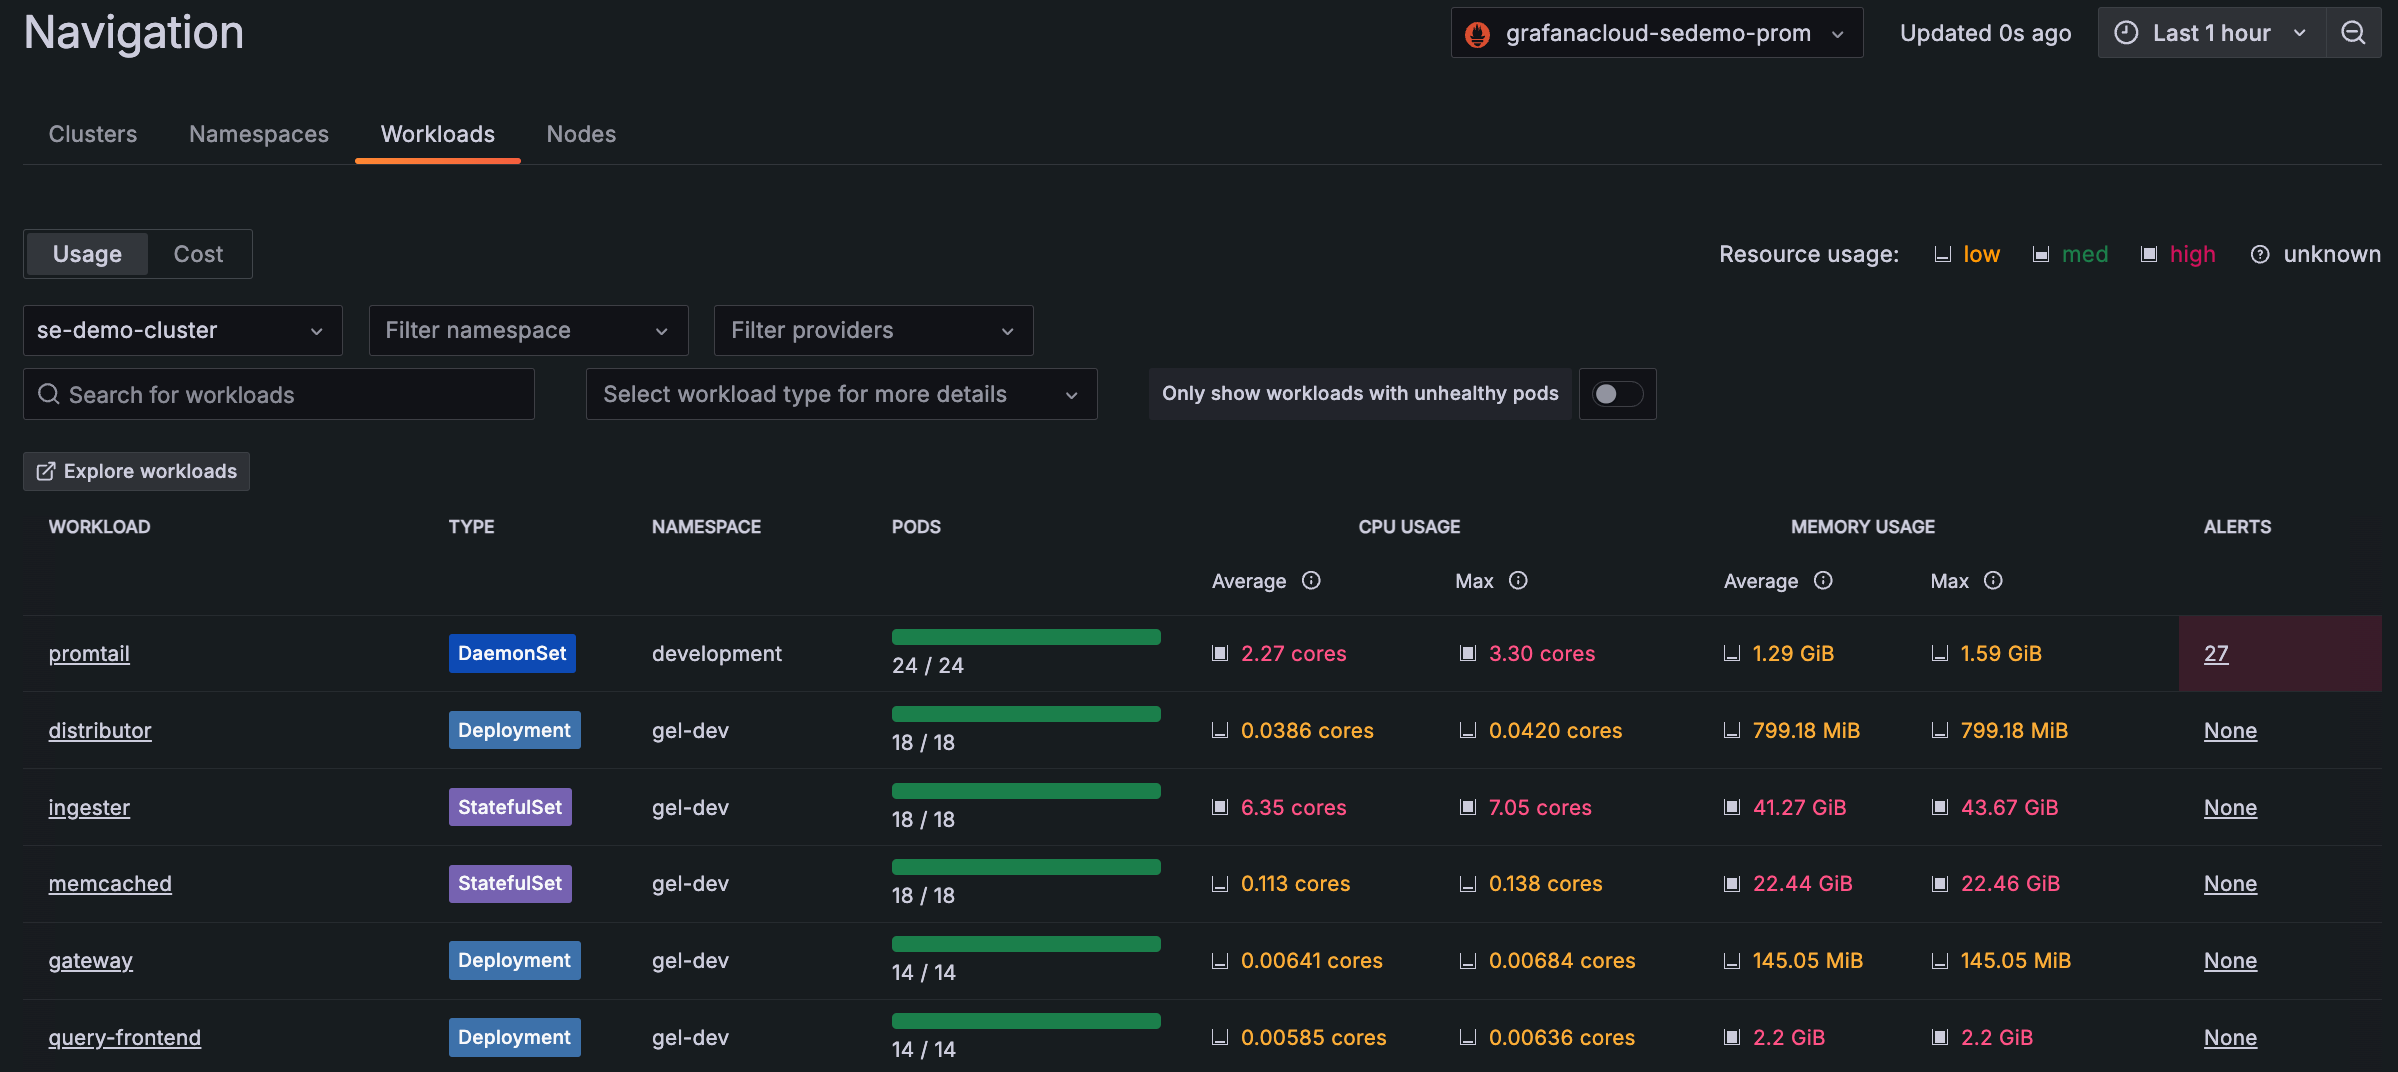
Detail views also reveal efficiency data and recommendations, so you can optimize resource usage.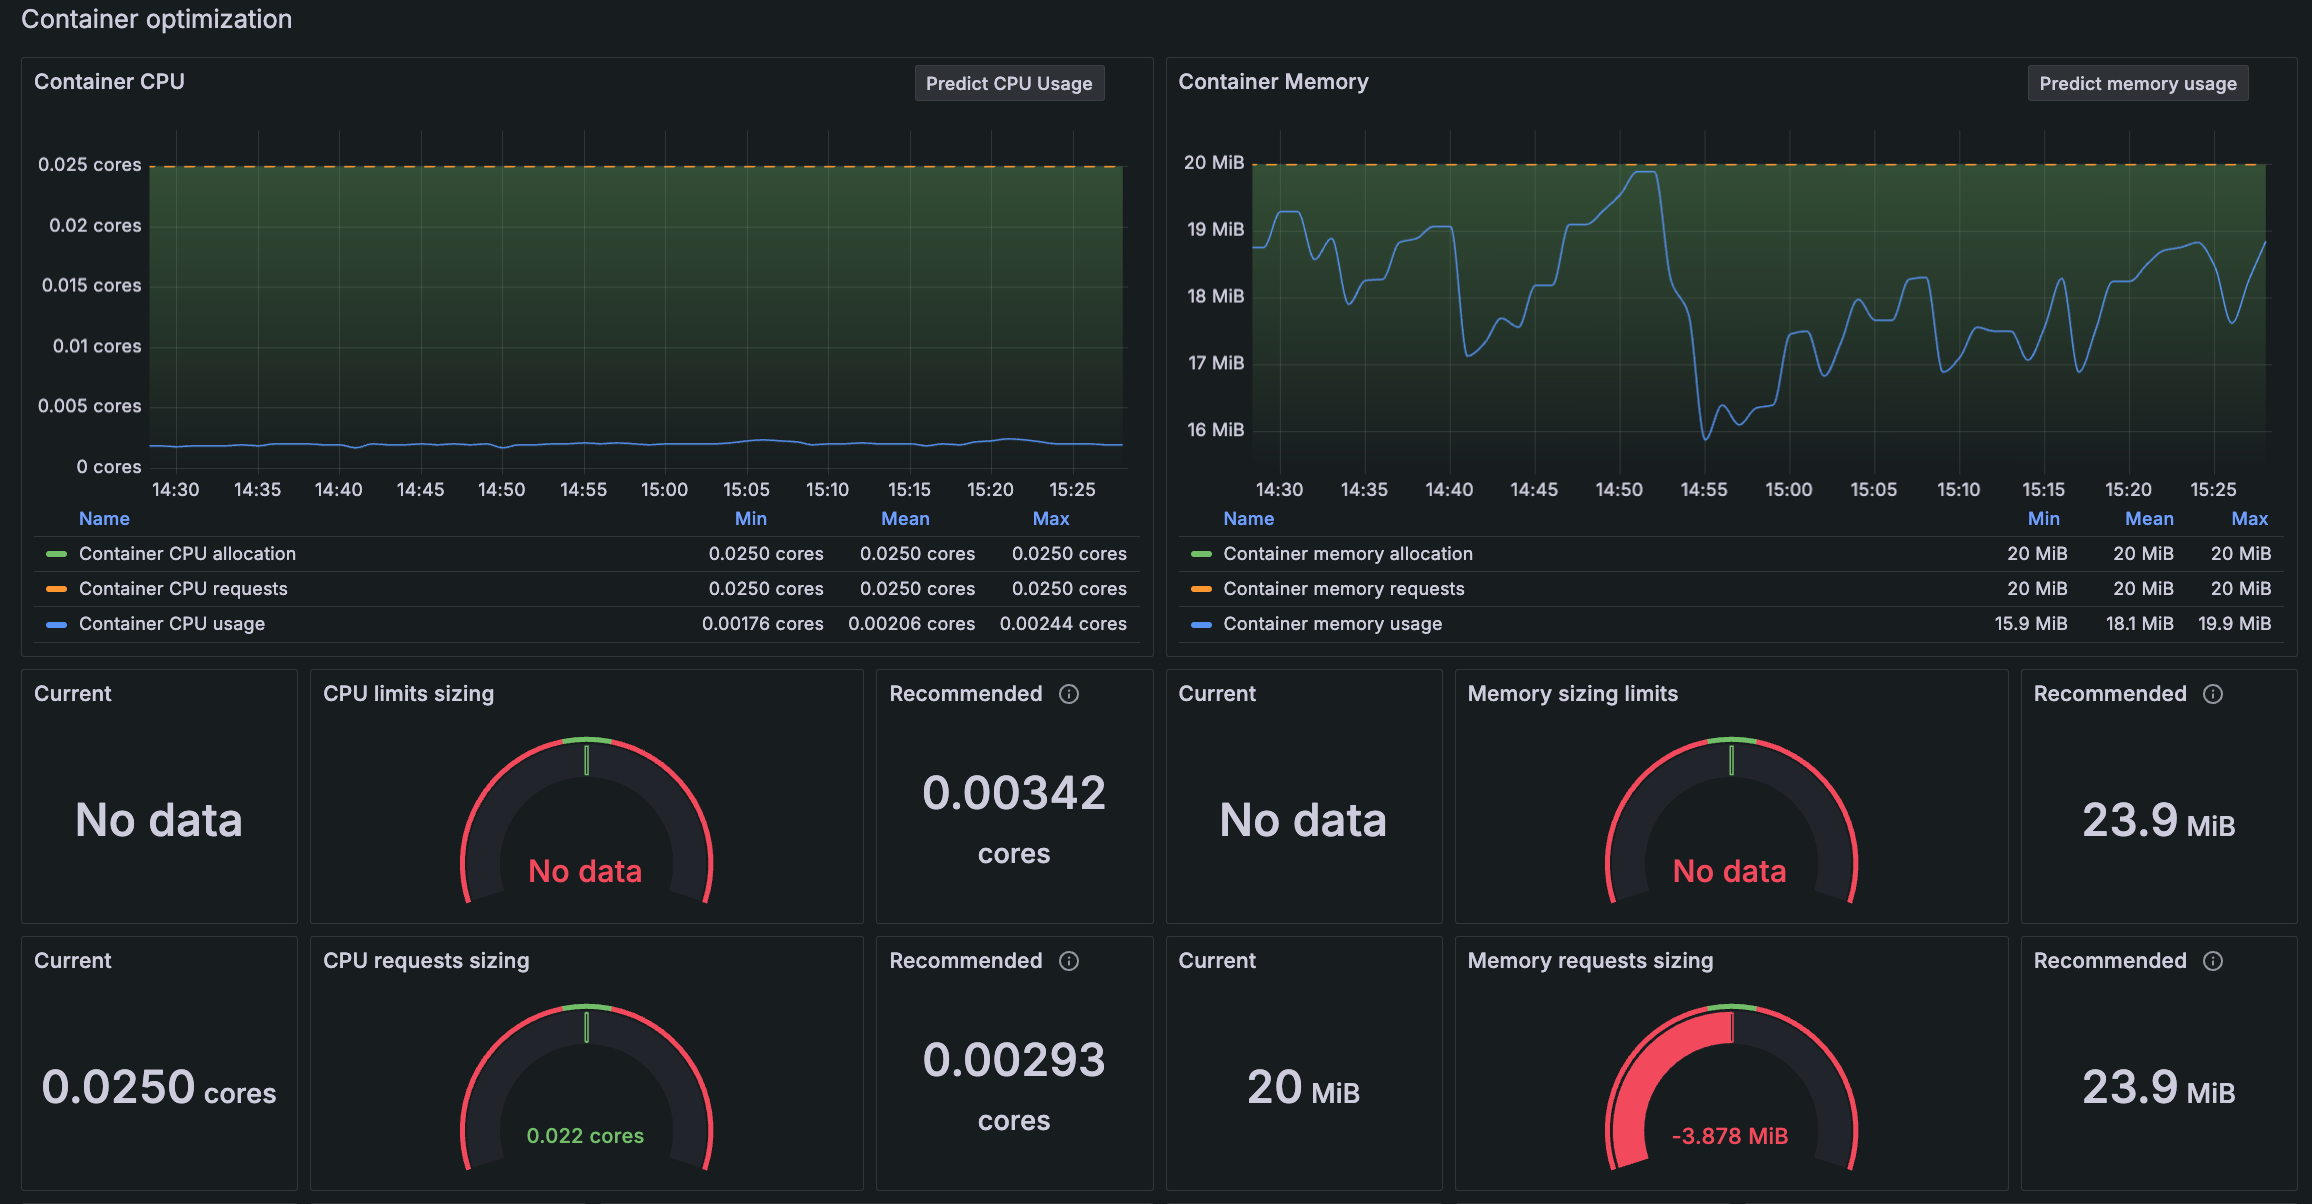
With this data, you can:
- Understand performance and troubleshoot stability issues by correlating between average and maximum resource usage.
- Observe resource usage for each Kubernetes object.
- Discover any stranded resources in your fleet.
Manage alerts
From the main menu, click Alerts to view all Kubernetes-related alerts.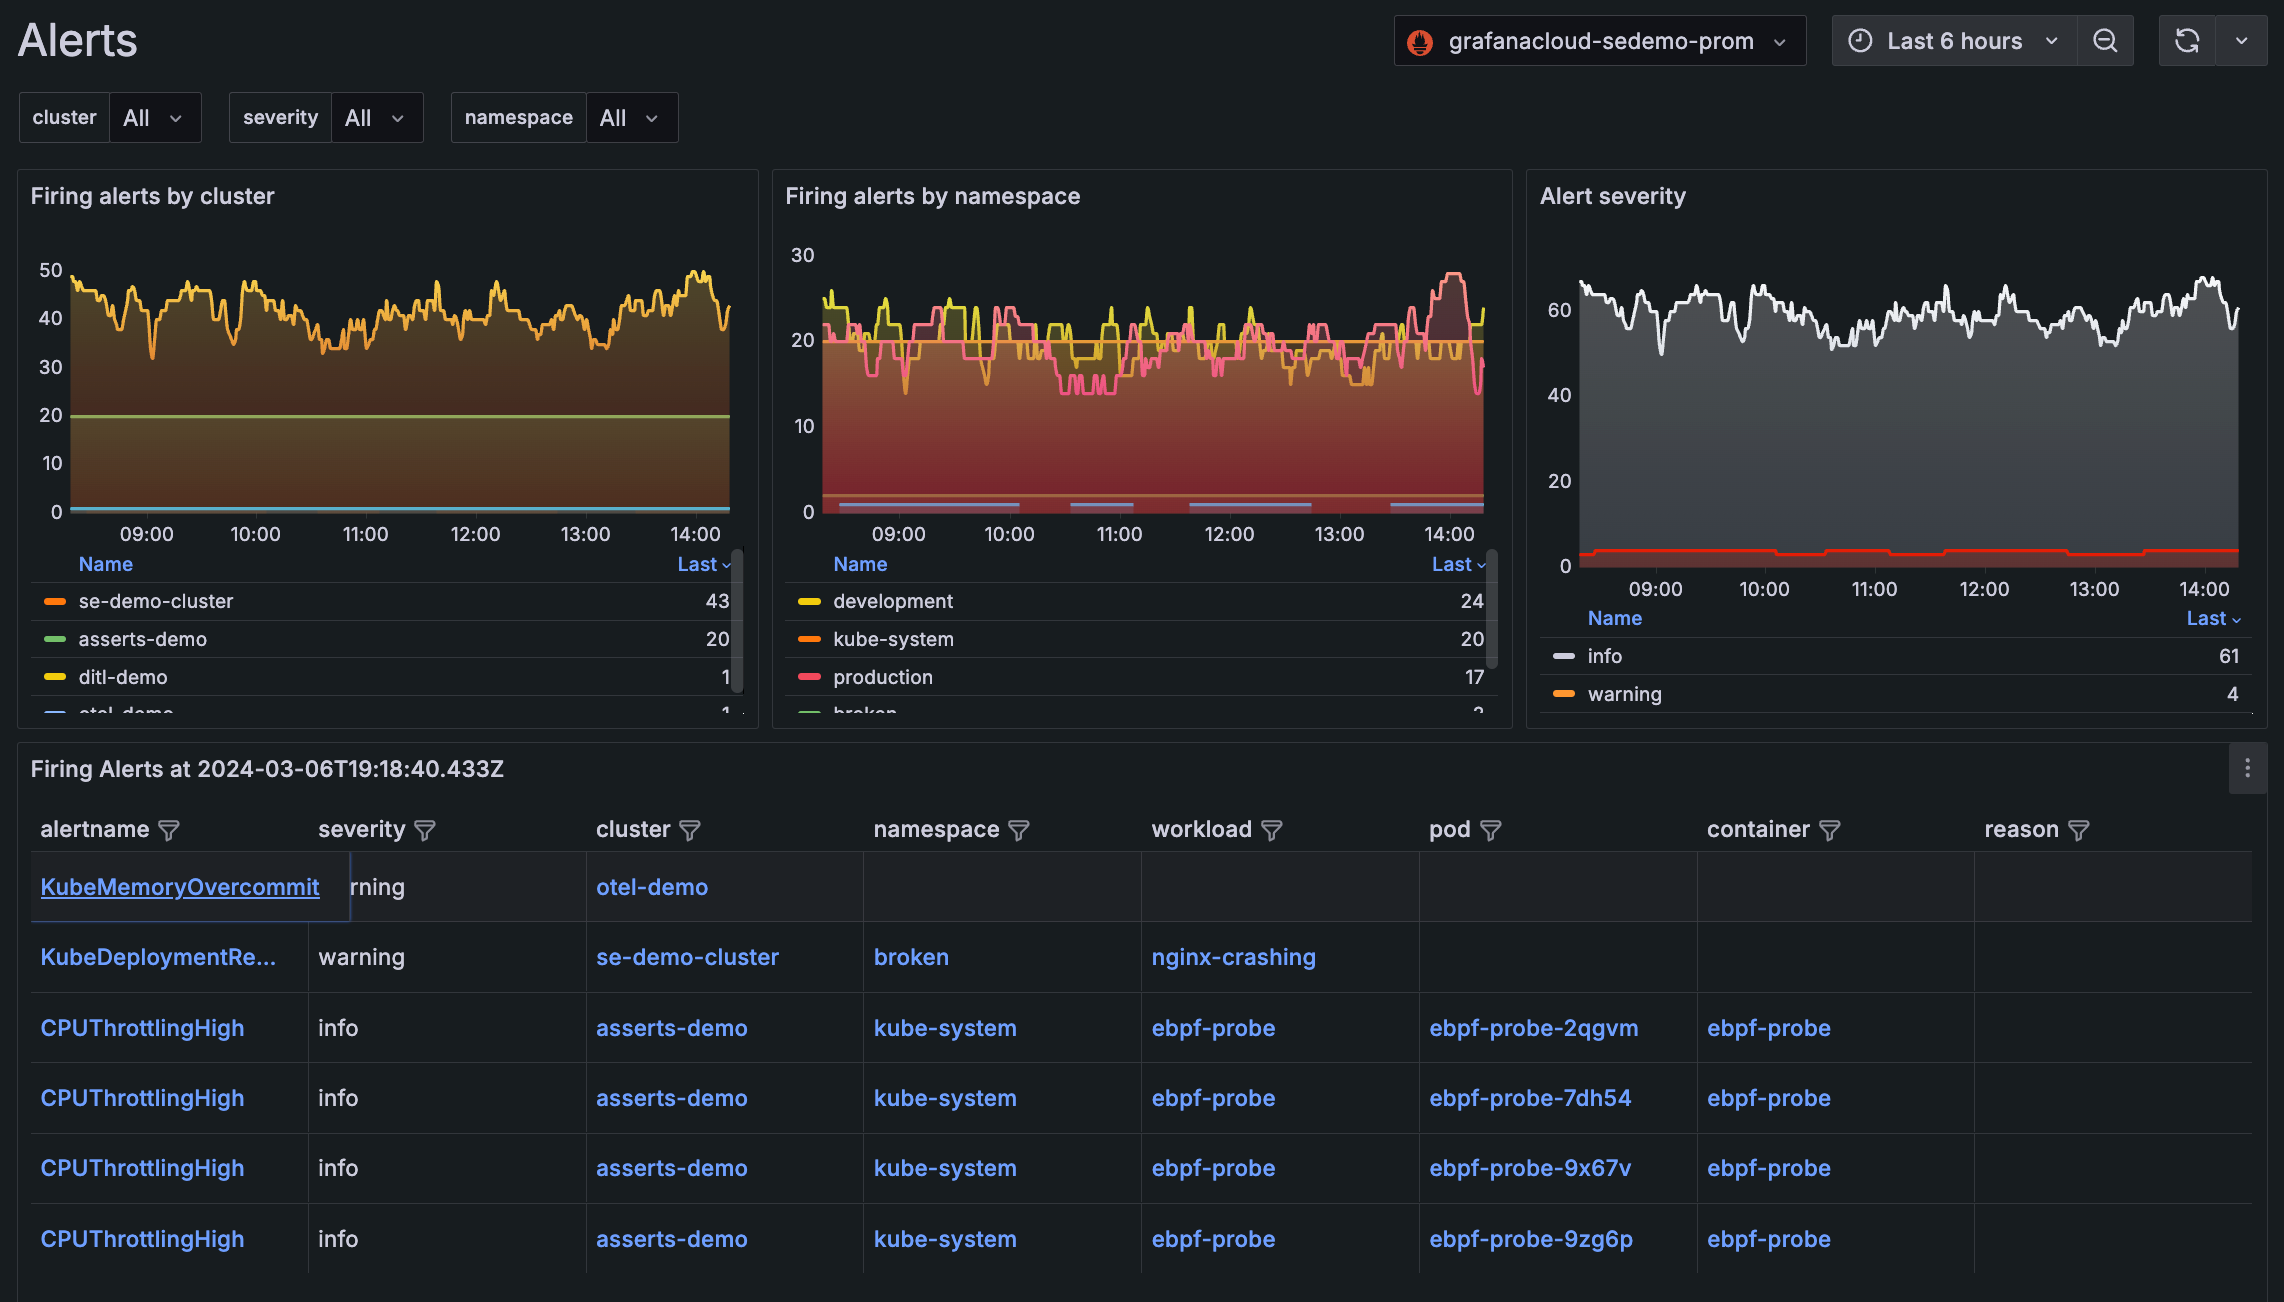
You can also manage preconfigured alerting rules.
Resolve issues better with cross-functionality
Navigate easily within the Kubernetes Monitoring app to other capabilities in Grafana Cloud to analyze, troubleshoot, and solve issues.
Diagnose with Sift investigations
From a Pod, Cluster, namespace, or workload view, you can begin an incident investigation by clicking Run Sift investigation. Sift performs a set of automated system checks and surfaces potential issues in your Kubernetes environment, and works to identify the root cause of an incident.
Go directly to the RCA Workbench
Within Kubernetes Monitoring, you can go directly to the Asserts RCA Workbench from any list of Clusters, Nodes, workloads, namespaces, or Pods you choose.
To do so, select the box to the left of the list item and click the Compare in Asserts Workbench button.
The RCA Workbench opens in a new tab. You can take troubleshooting deeper by understanding relationships between components and what is occurring between them.
Note
To access the RCA Workbench, enable Asserts on your stack.
View raw metrics with Explore
To further query data, use any of the Explore buttons available throughout the interface (such as Explore namespaces or Explore alerts). You see a view that provides additional query tools.
Access Application Observability
On the detail page for a Pod or workload, click Application Observability to navigate directly to more data on the application.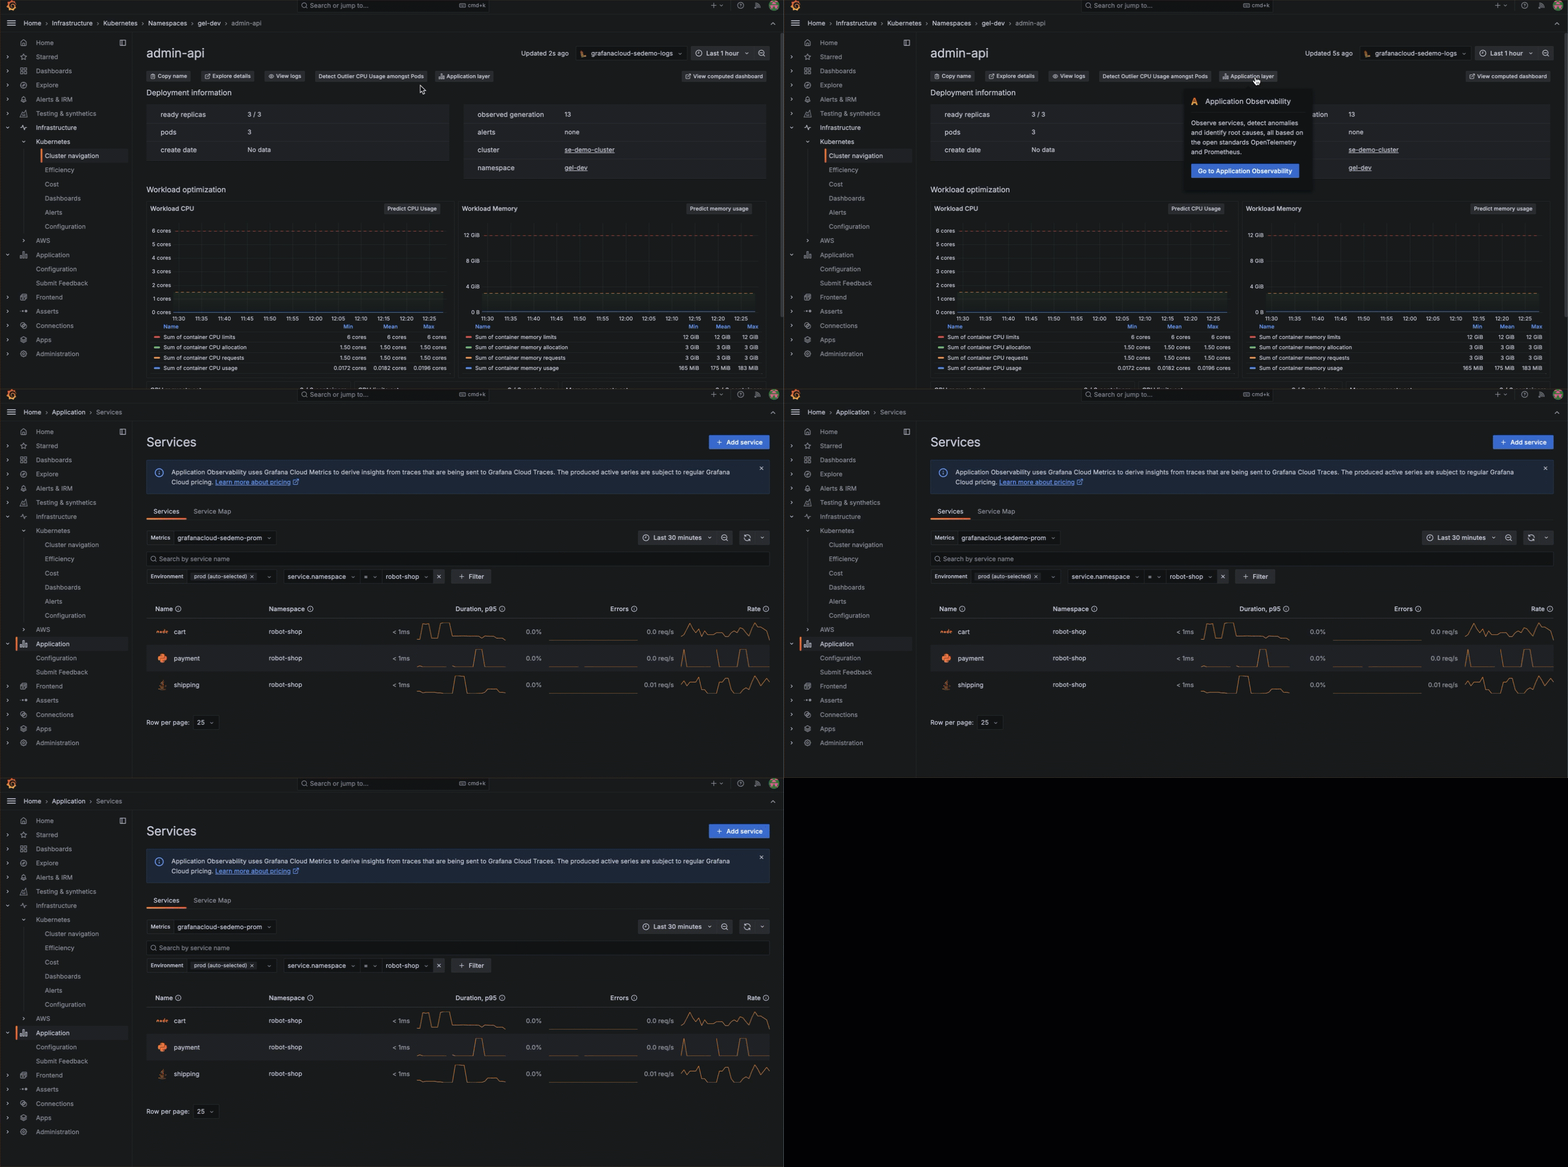
To return to Kubernetes Monitoring, click the Kubernetes icon.
Analyze historical data
Select a time range to see your historical data for any time frame you choose. As you navigate from page to page, the time range shows for the period you set until you change it again.
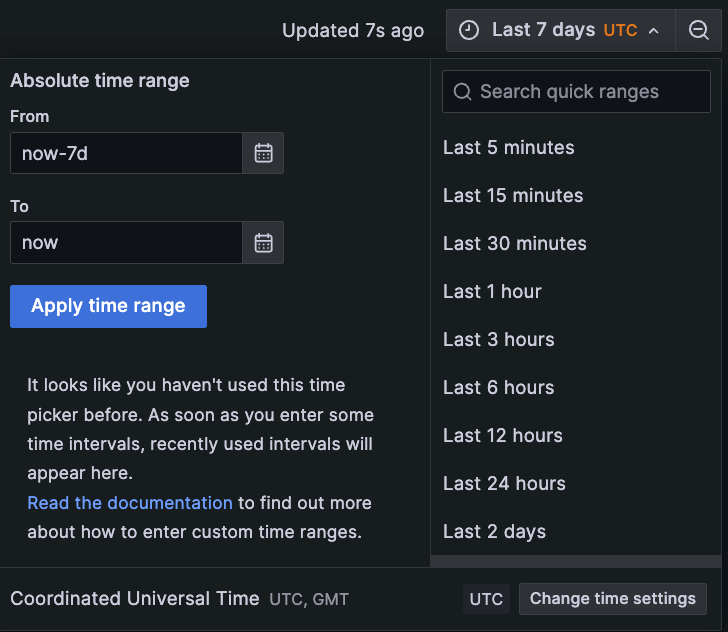
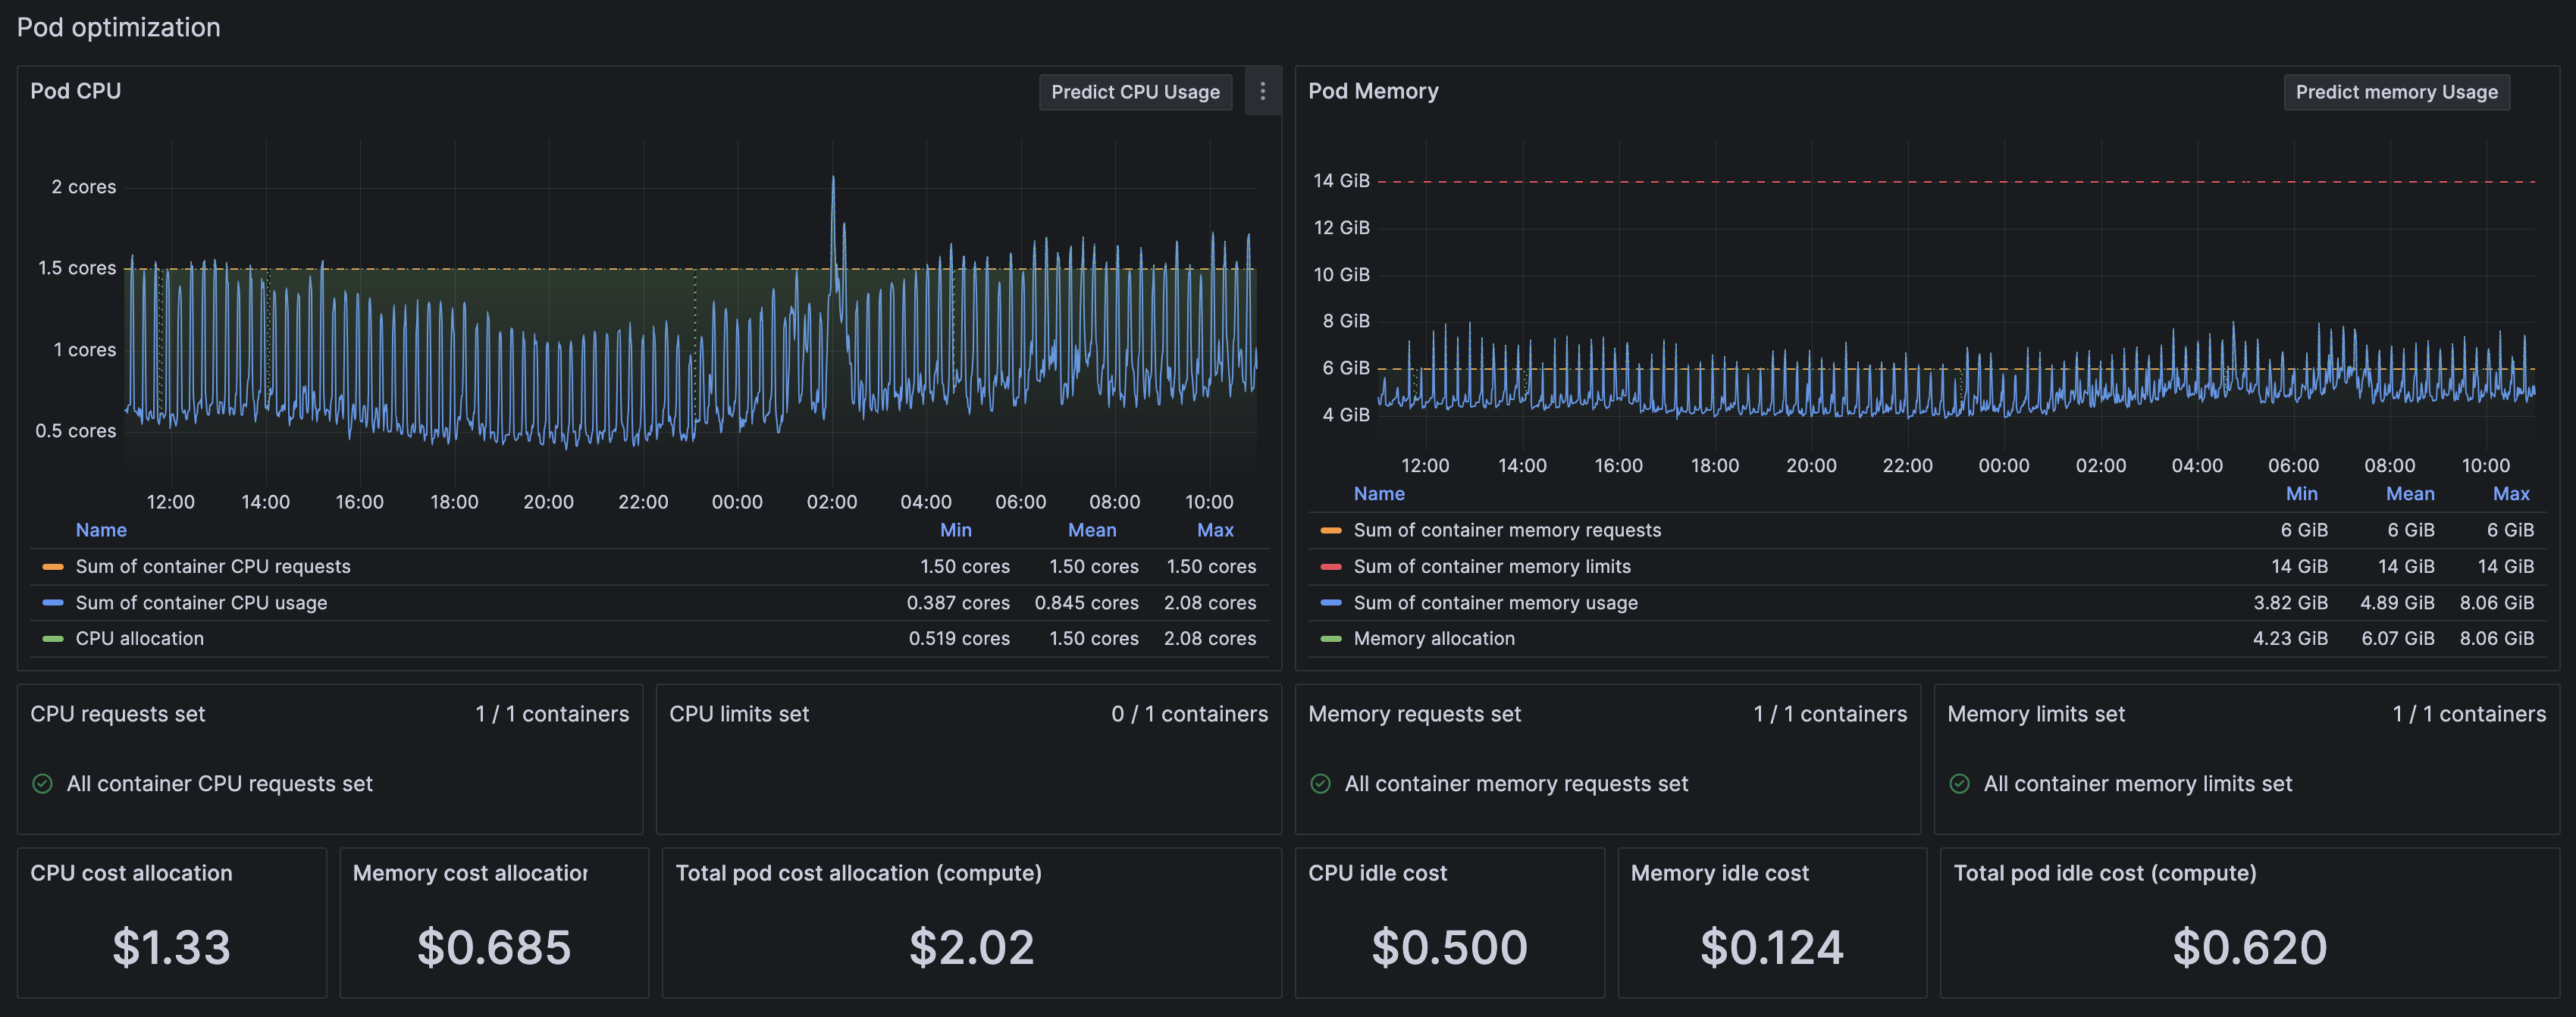
As an example, the Pod optimization section of the Pod detail page shows a time range over several hours. You can use this to understand the historical pattern of CPU usage and memory usage.
Learn what’s predicted
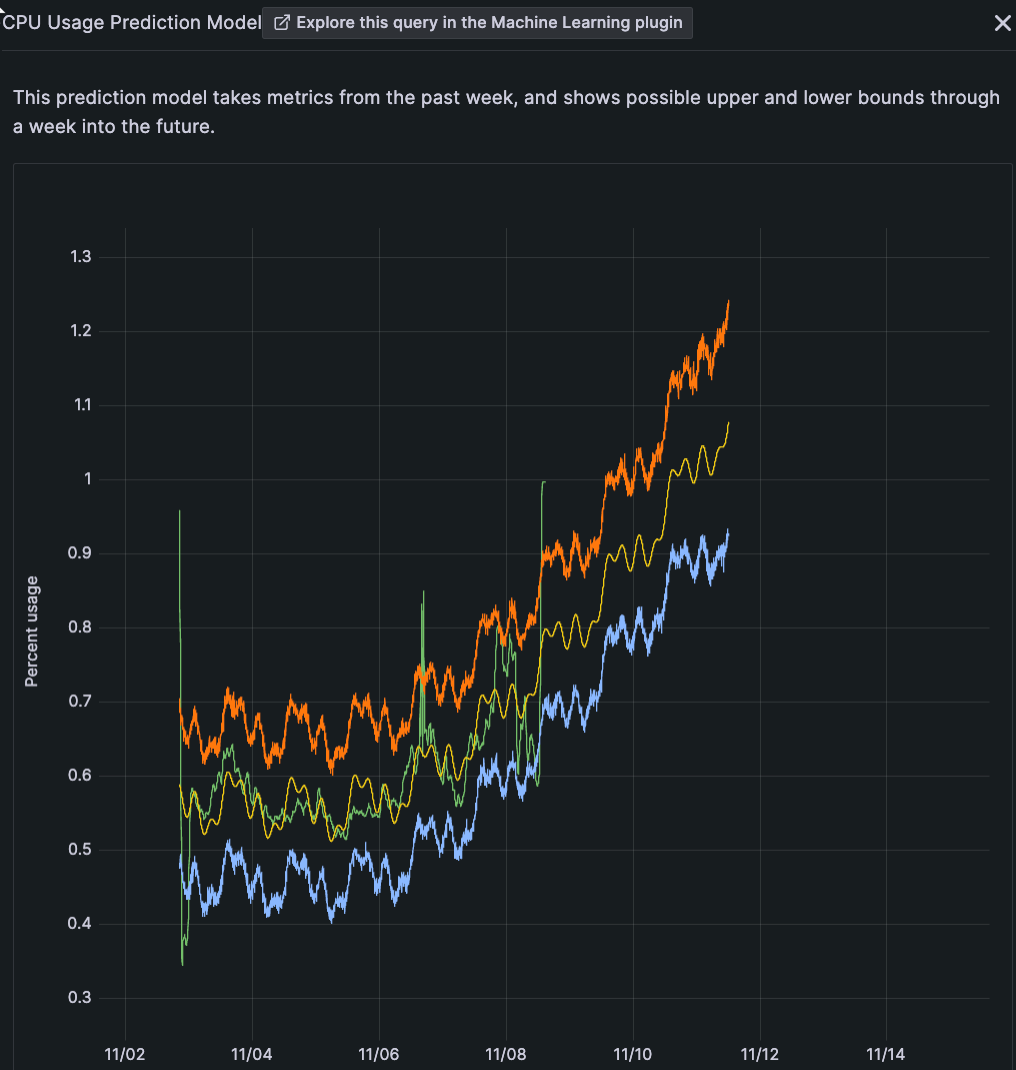
CPU and memory prediction can help you ensure resources are available during spikes in resource usage and help you decrease the amount of unused resources due to over provisioning. To use prediction tools, first enable the Machine Learning plugin.
The following buttons are available in various views. Click them to show a prediction for Clusters, namespaces, workloads, Nodes, Pods, and containers:
- Predict Mem Usage: Shows a predictive graph for memory usage one week in the future. Calculations are based on metrics from the previous week.
- Predict CPU: Shows a predictive graph for CPU usage one week in the future. Calculations are based on metrics from the previous week.
![Predictions for Node CPU Usage Three graph lines showing the actual CPU usage, the lower predicted future usage, and upper predicted future usage]()
Predictions for Node CPU Usage
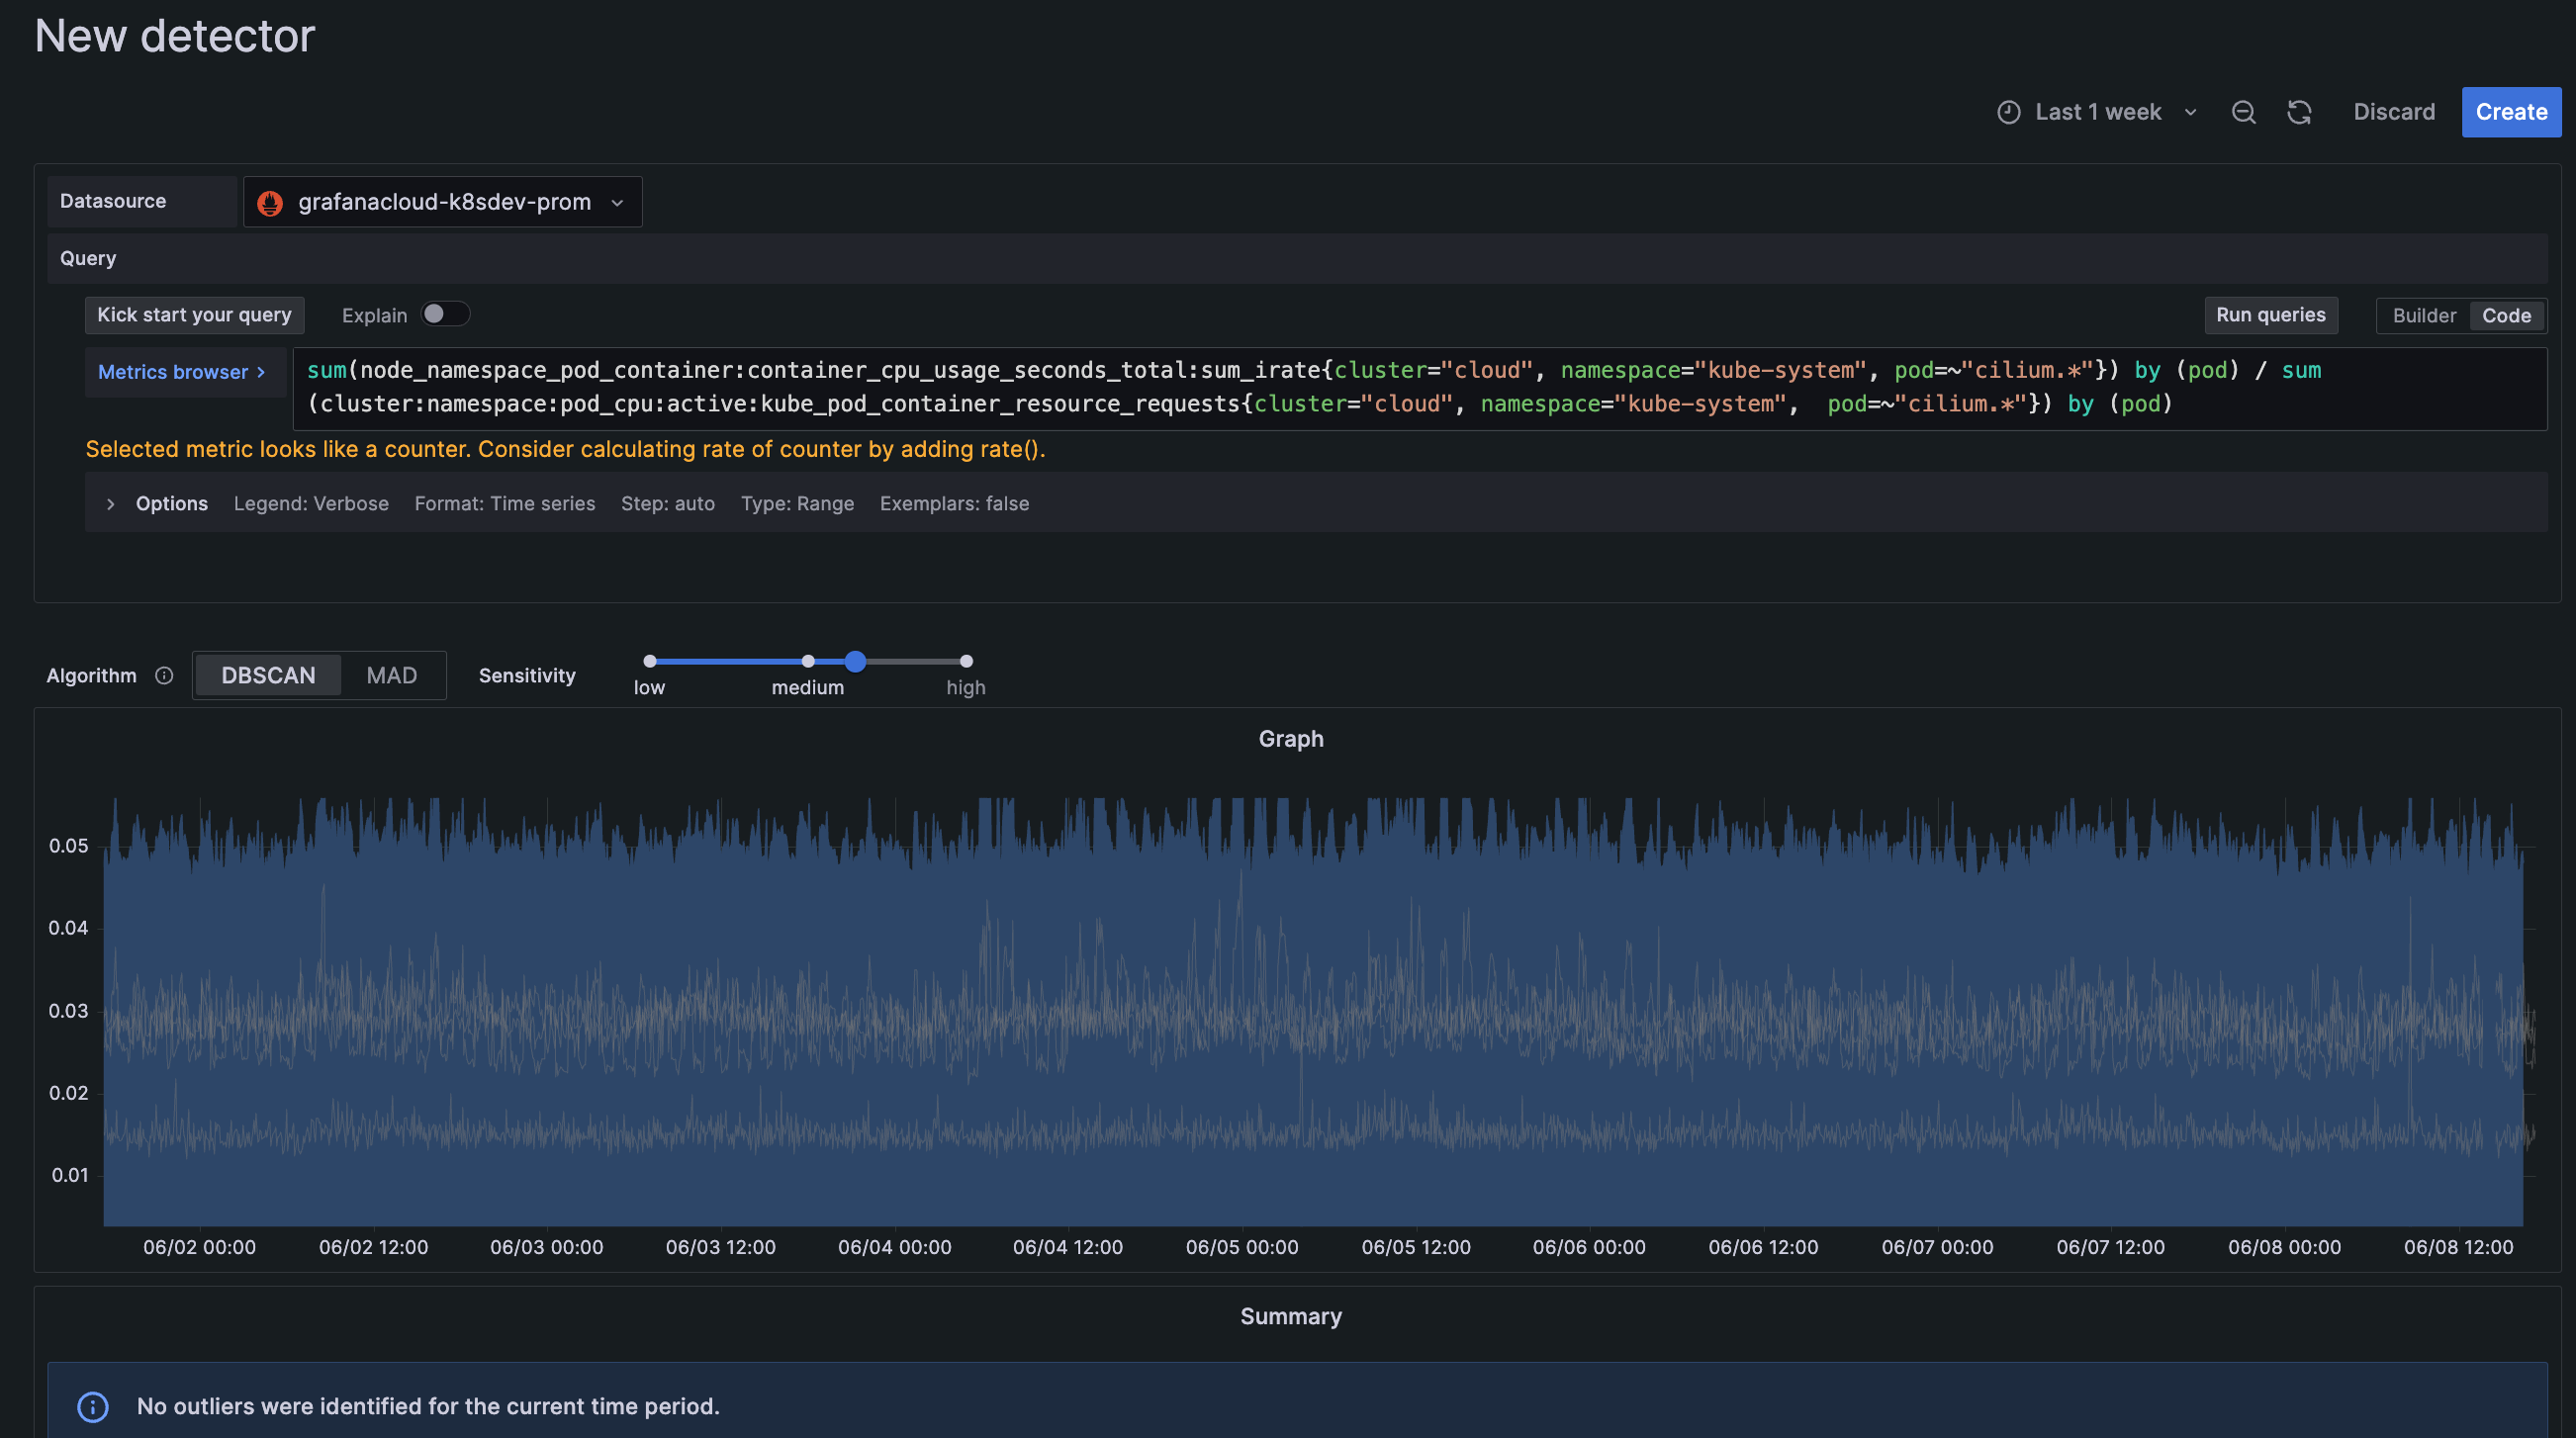
Within a workload view, click the Detect Outlier CPU Usage amongst Pods button to identify a Pod that has CPU usage different from the other Pods.

Click Explore this query in the Machine Learning plugin to view the raw data. Here you can adjust parameters and see a more detailed graph of the findings.
Control app refresh
You can control the automatic refresh interval of the GUI as well as disable the auto refresh until you are ready to do so manually.
Use color cues
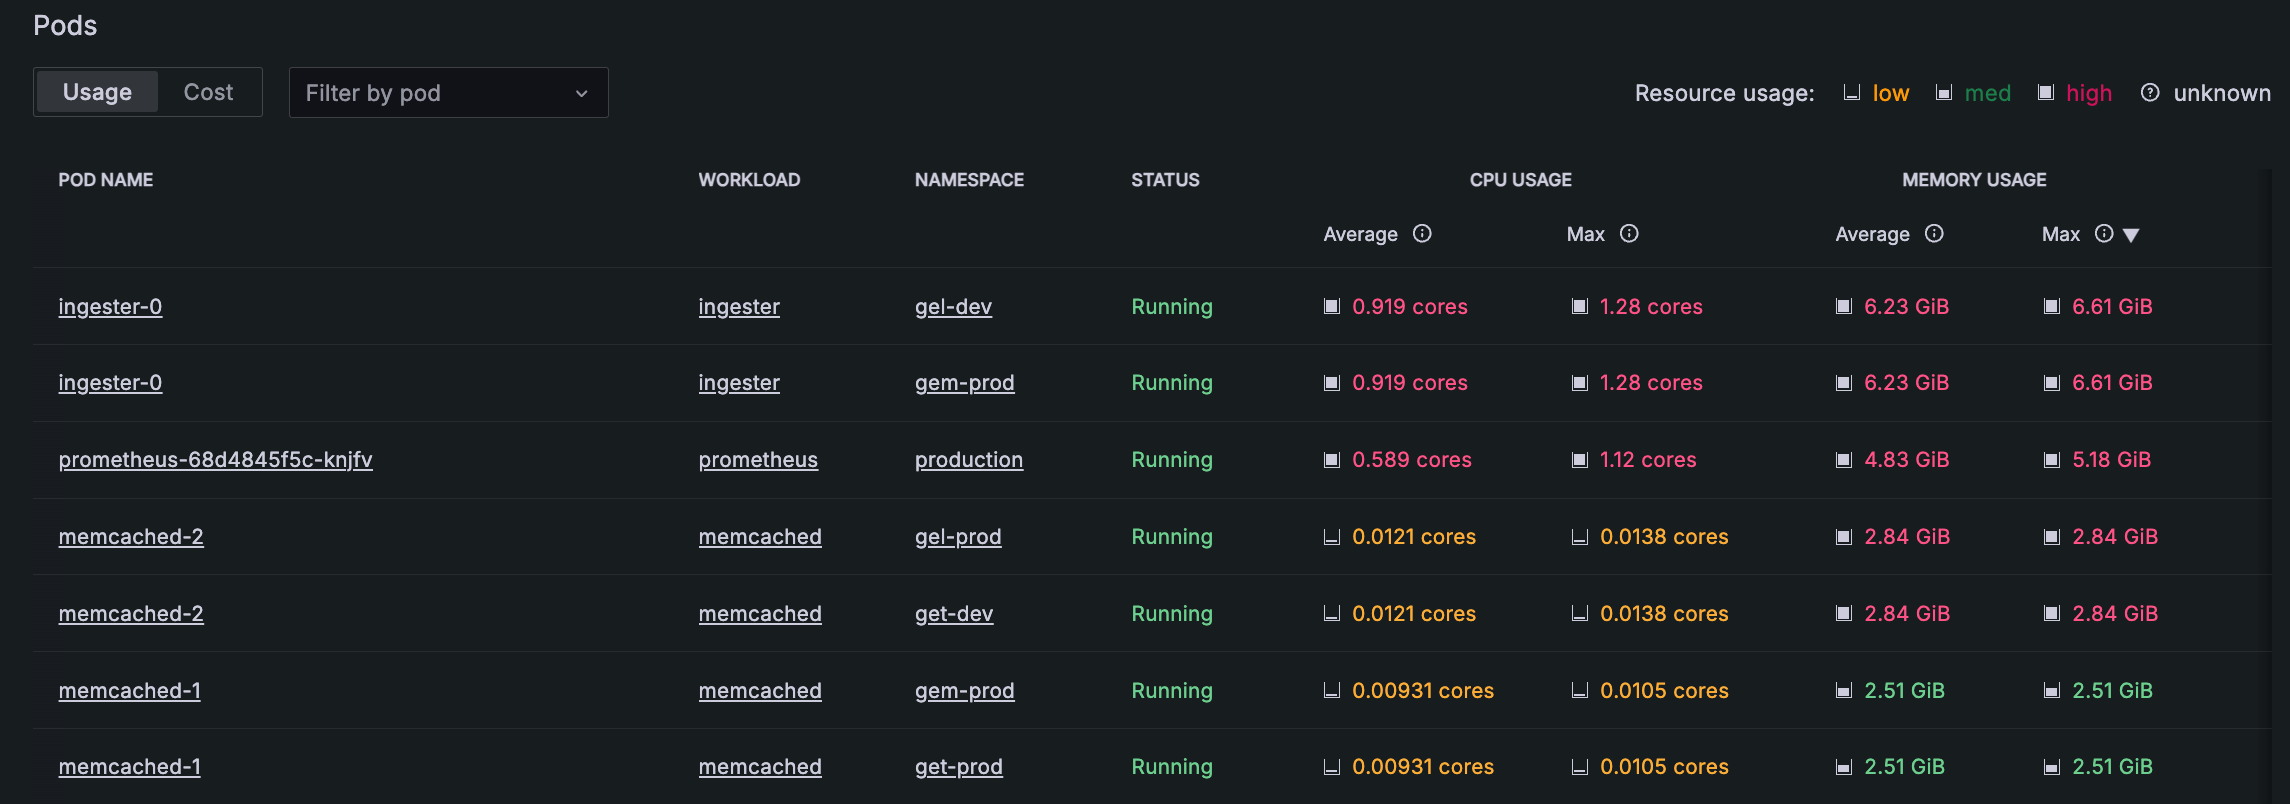
Throughout the views in Kubernetes Monitoring, you see color used as an additional means of indicating status or condition. For example, sometimes text is a different color for Pod status:
| Text | Color | Comments |
|---|---|---|
| Running | Green | Healthy Pod |
| Running | Red | Pod failing to start |
| Failed | Red | Failed Pod |
| Unknown | Grey | Pod status unknown |
| Succeeded | Green | Job Pod successfully run |
For more information on Pod status, refer to the Kubernetes documentation on Pod lifecycle.
The following table describes the color indicators for resource capacity and the state of resource usage:
| Usage Colors | Usage | Comments |
|---|---|---|
| Green | 60-90% of maximum | This is the ideal state of resource usage. |
| Yellow | Below 60% | Low usage percentages indicate that the item might be over provisioned. |
| Red | 90%+ | Your resource usage is close to or above its configured capacity. |
Navigate to traces
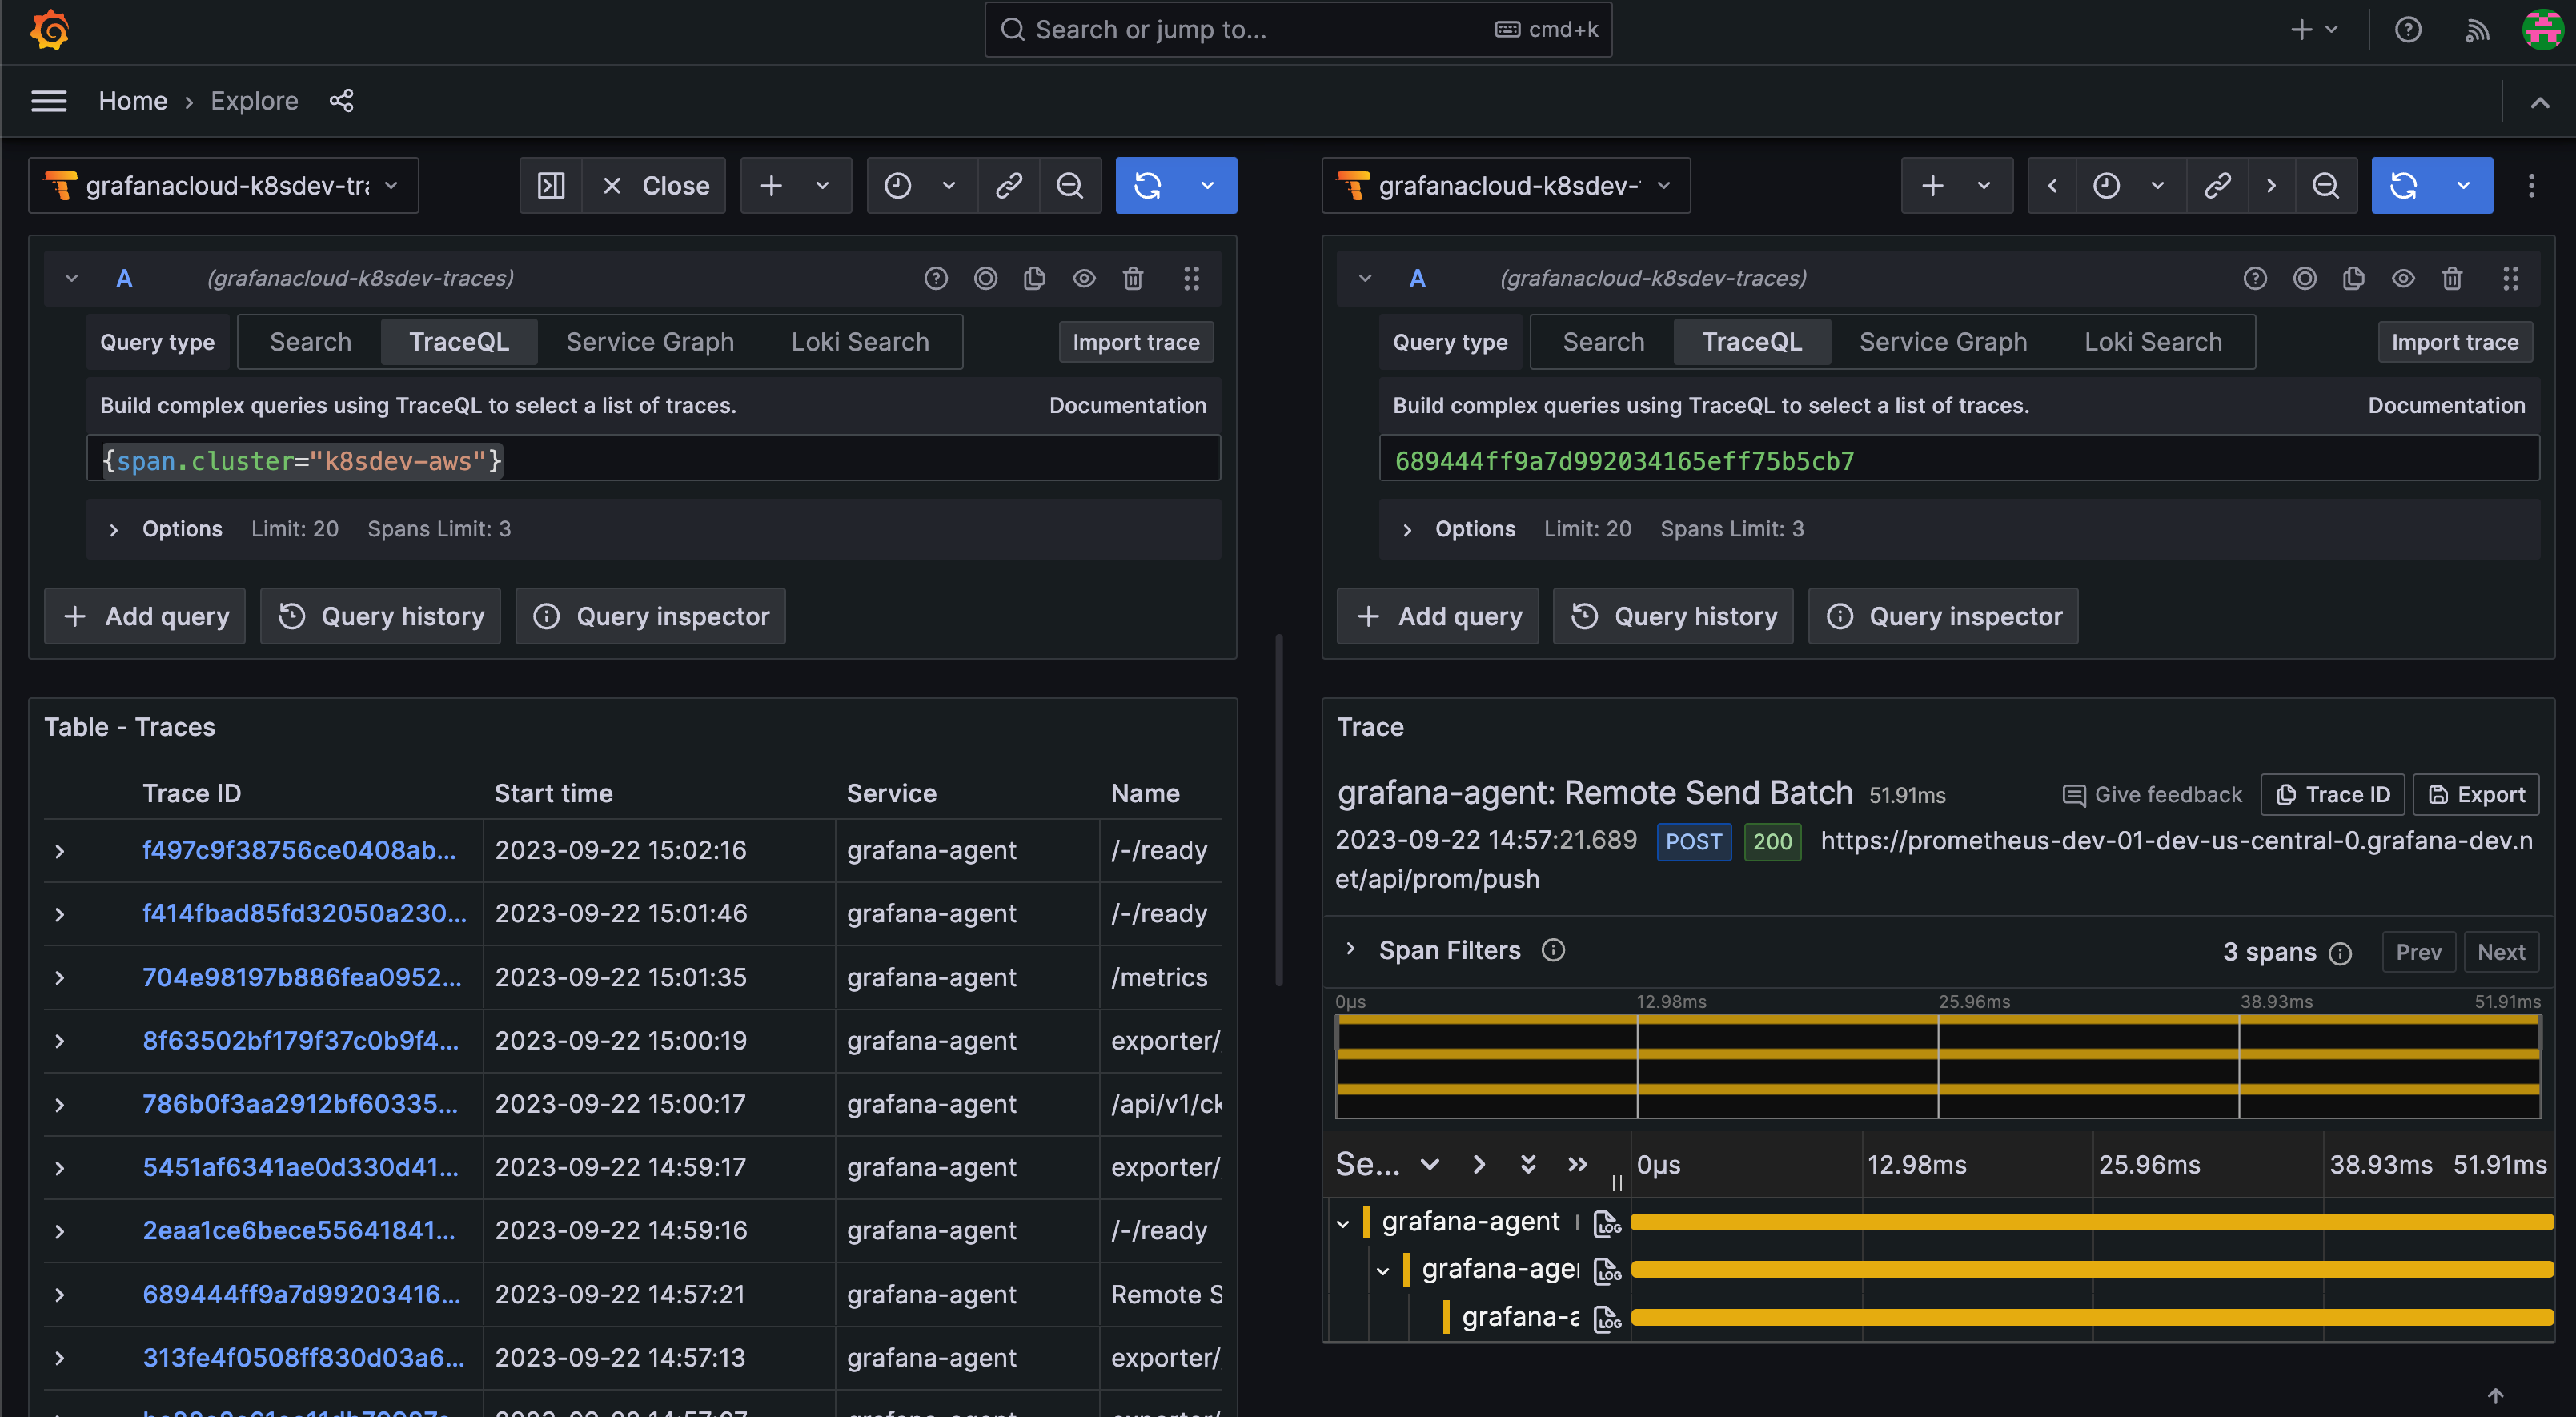
If you choose to enable traces when you configure Kubernetes Monitoring, you can easily click to see them.
Click the main menu icon.
Click Explore.
Choose the Tempo data source.
With the TraceQL tab selected, enter your search query.
Click Run query.
A table of traces appears.
Click a trace to see the detail.
Manage configuration
If you have the admin role, you can manage the configuration of Kubernetes Monitoring by working with:
- Data source choices
- Alerts
- Integration installations
- Optional custom log queries
- Configuration instructions for Grafana Kubernetes Monitoring Helm chart to deploy, configure, and keep it up to date
For more information, refer to Configure Kubernetes Monitoring.
Was this page helpful?
Related resources from Grafana Labs


