

Get started with the knowledge graph
The knowledge graph is included in every Grafana Cloud stack. Navigate to Observability > Entity catalog to view discovered entities.
Entities and insights typically add 5% to 10% more active series. There is no separate charge. Refer to Knowledge graph pricing.
The knowledge graph uses telemetry you’re already sending to Grafana Cloud. If the catalog shows Get started, refer to Activate the knowledge graph.
Before you begin
To connect telemetry to the knowledge graph, you need:
- Grafana Cloud Admin permissions to enable new features
- One or more of the following already sending data to Grafana Cloud:
- Kubernetes Monitoring - For infrastructure and containerized applications
- Application Observability - For services instrumented with OpenTelemetry or other APM tools
- Host Monitoring (Private preview) - For physical or virtual machines with Node Exporters and process metrics. Refer to Configure dataset for Host Monitoring for metric requirements.
If you’re not sure whether you have these set up, you can check during the activation process. The knowledge graph shows you what’s available.
Understand signal requirements
The knowledge graph is metrics-first.
- Discovery is driven by metrics in Grafana Cloud - Entity discovery, relationship mapping, and insight generation depend on metrics and metric labels stored in Grafana Cloud.
- Partial ingestion still works - If you send enough metrics for Application Observability or Kubernetes Monitoring, you can still use entity discovery, topology views, and RCA workflows.
- Logs don’t drive discovery - Logs enrich investigations, but they don’t drive entity or relationship discovery. Logs drilldowns work best when you configure logs correlation so entity properties map to Loki labels.
- Traces improve investigations - Traces aren’t required to activate the knowledge graph, but they add request-level drilldowns and richer RCA context.
- More coverage improves results - Broader telemetry coverage improves relationship quality, RCA precision, and the number of failure scenarios the knowledge graph can surface.
Activate the knowledge graph
Follow these steps if Entity catalog shows Get started, or if you’re connecting the knowledge graph again after you deactivate it. The activation process uses default settings. You can change them later.
In Grafana Cloud, navigate to Observability in the left navigation.
Click Entity catalog.
If the knowledge graph isn’t enabled yet, you’ll see a friendly message with a Get started button.
Click Get started.
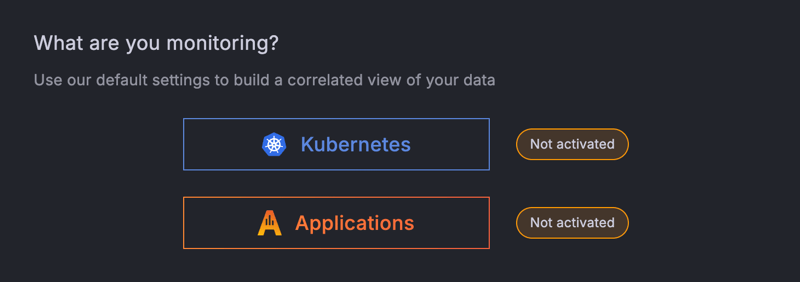
On the activation page, choose what you want to monitor:
- Kubernetes - Monitors clusters, nodes, Pods, and containerized services
- Applications - Monitors services instrumented with OpenTelemetry or other APM frameworks
- Hosts - Monitors physical or virtual machines with Node Exporters and process metrics
- Multiple datasets - Select any combination to monitor infrastructure, applications, and hosts together
![Knowledge graph activation page]()
If you selected a single dataset, click Build knowledge graph. Otherwise, the knowledge graph automatically builds when you select multiple datasets.
![Knowledge graph activate products page]()
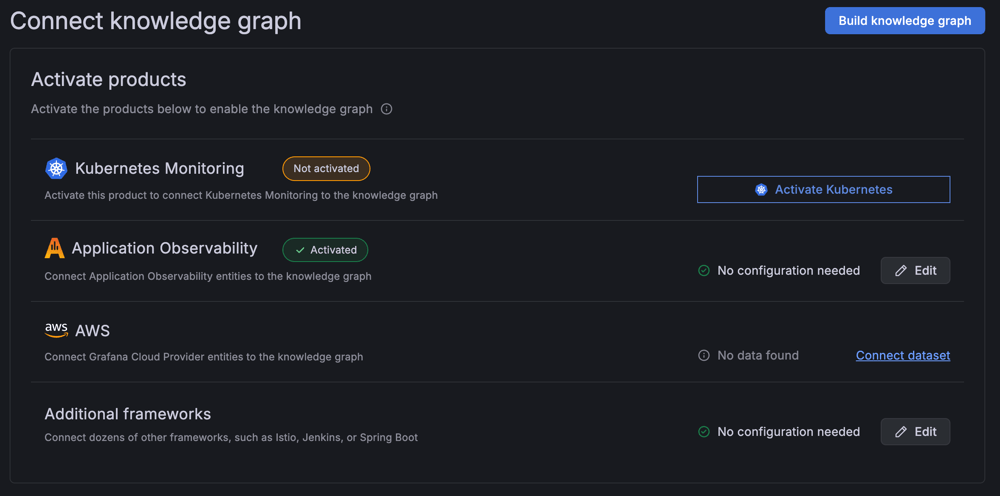
The knowledge graph starts adding entities from your telemetry. Entities typically start to appear within minutes. The time to a full catalog depends on the size of your environment.
What happens next
After activation:
- Entity discovery - Observability solutions add services, Pods, nodes, databases, and other components to the knowledge graph
- Insight generation - Those solutions add insights about health, such as saturation, errors, and anomalies
- Dashboard availability - Pre-built dashboards become available for each entity
- Navigation enabled - Entity catalog, RCA workbench, and entity graph are accessible from the Observability menu
You can explore the entity catalog as soon as entities appear.
Frontend Observability, Database Observability, and Cloud Provider Observability also add entities when those products are sending data. Refer to Introduction to the knowledge graph for the full list, including coverage in preview.
Next steps
Now that the knowledge graph is active, here’s what to do:
- Explore the entity catalog - Navigate to Observability > Entity catalog to see your discovered entities and their health status
- Bookmark important views - Filter the catalog to your services or environment, then bookmark for quick access
- Try investigating an entity - Click on any service to see its metrics, logs, traces, and profiles in one place
- Check instrumentation quality - Use the Instrumentation quality report to identify and fix telemetry gaps that limit knowledge graph capabilities
- Try Knowledge Graph mode in Grafana Assistant - Refer to Use Knowledge Graph mode to troubleshoot entity connections, diagnose missing metrics, and write custom entity rules
- Learn the workflows - Refer to Use cases for common troubleshooting scenarios
- Ask Grafana Assistant - Open Grafana Assistant and enter “How can I get more from my knowledge graph?” to get next steps for your stack
If you’re not seeing entities
If you activated the knowledge graph but don’t see entities appearing after a few minutes:
- Verify that Kubernetes Monitoring, Application Observability, or Host Monitoring is sending data to Grafana Cloud
- Check that your services have the required labels (for example,
service.nameandservice.namespacefor OpenTelemetry, orinstancefor Node Exporters) - Use the Instrumentation quality report to identify missing metrics or labels
- Review the troubleshooting guide for specific signal requirements
Customize your configuration
The default activation works for most environments. If you need to customize which data sources the knowledge graph uses, you can manage dataset configuration to:
- Add additional monitoring products (AWS, Istio, Jenkins)
- Configure custom entities
- Adjust data source priorities
Understand your first insights
After entities are discovered, the knowledge graph begins generating insights. Here’s what to expect:
- Red indicators in the entity catalog mean an entity has critical insights firing
- Insight rings show a visual health summary directly on each entity
- Categories (Saturation, Amend, Anomaly, Failure, Error) help you understand the type of issue
Don’t be alarmed if you see insights right away. This is the knowledge graph highlighting issues that may have existed before but were harder to spot. You can investigate each one to understand its root cause.
Understand investigation retention
Investigation depth depends on which signal you open:
- Entity graph and insights - Historical entity context and insights remain available according to your metrics retention policy.
- Logs and traces - Drilldowns only work while the underlying logs and traces are still retained in Loki and Tempo.
This means you can sometimes keep entity-level context longer than the raw logs or traces behind an incident.
Deactivate the knowledge graph
You can deactivate the knowledge graph if you need to temporarily disable it for maintenance, cost optimization, or if you no longer want to use it.
Warning
Deactivating the knowledge graph stops data collection and insight generation. Pre-built dashboards and knowledge graph-specific alert rules are removed.
What to know before deactivating
Before you deactivate:
- You’ll need Grafana Cloud Admin permissions
- Pre-built dashboards and alert rules are deleted
- Entity catalog and RCA workbench become unavailable
- Drill-down links from Application Observability and Kubernetes Monitoring to the knowledge graph stop working
- Historical data remains in your metrics storage according to your retention policy
- Cost implications - Deactivating the knowledge graph stops the active series that entities and insights add. The observability solutions stay active. Refer to Knowledge graph pricing.
Deactivation steps
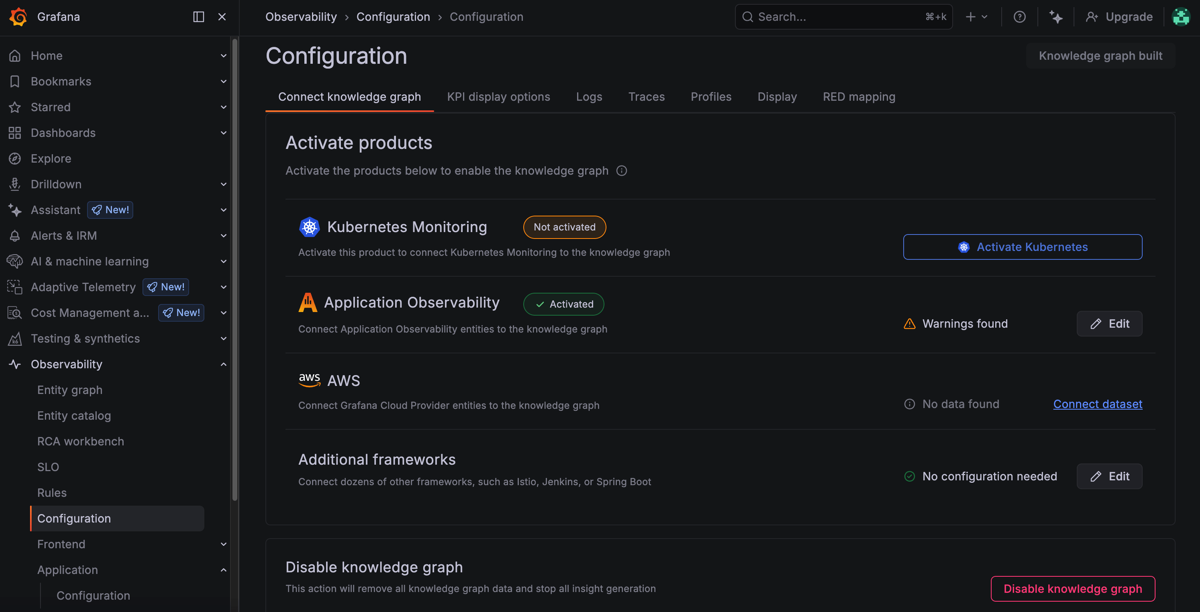
Navigate to Observability > Configuration > Connect knowledge graph.
Scroll to the Disable knowledge graph section at the bottom.
![Knowledge graph Connect knowledge graph page]()
Click Disable knowledge graph.
Review what happens when you deactivate.
Type “disable” to confirm.
Click I understand, disable knowledge graph.
Re-activate later
To re-activate the knowledge graph after deactivation, return to Observability > Entity catalog and follow the same activation steps. The knowledge graph begins processing data again and rebuilding the entity catalog.
Was this page helpful?
Related resources from Grafana Labs



