

Configure Traces metrics generation
You can configure how Grafana Cloud generates span metrics and service graph metrics from traces for the knowledge graph. This self-service configuration gives you control over which trace attributes become metric labels, filter rules for selective metric generation, and histogram bucket settings.
Before you begin
Ensure you have the following:
- Knowledge graph enabled in your Grafana Cloud stack
- Traces flowing to Grafana Cloud
- Admin permissions in Grafana Cloud
Access Traces metrics generation settings
To access Traces metrics generation configuration, complete the following steps:
- Sign in to Grafana Cloud and click Observability > Configuration.
- Click the Traces metrics generation tab.
Activate Traces metrics generation
If you haven’t activated Traces metrics generation, the General tab displays Activate.
Activating metrics generation enables Grafana Cloud to produce span metrics and service graph metrics from your traces. The knowledge graph uses these metrics to display RED metrics (Rate, Errors, Duration) for your services.
To activate Traces metrics generation, complete the following steps:
- Click the General tab.
- Click Activate.
- Review the activation dialog box:
- Grafana Cloud uses metrics generated from traces to surface additional insights
- These metrics count towards your current usage and bill for this stack
- There’s no additional cost for Grafana Cloud Free accounts
- Select the checkbox to acknowledge that enabling automatic metrics generation incurs additional usage towards your bill based on regular pricing.
- Click Enable.
After activation, the settings include up to five tabs: General, Service graph, Dimensions, Filter rules, and Histogram buckets. Depending on your stack, some service graph settings may appear on the General tab instead of a separate Service graph tab.
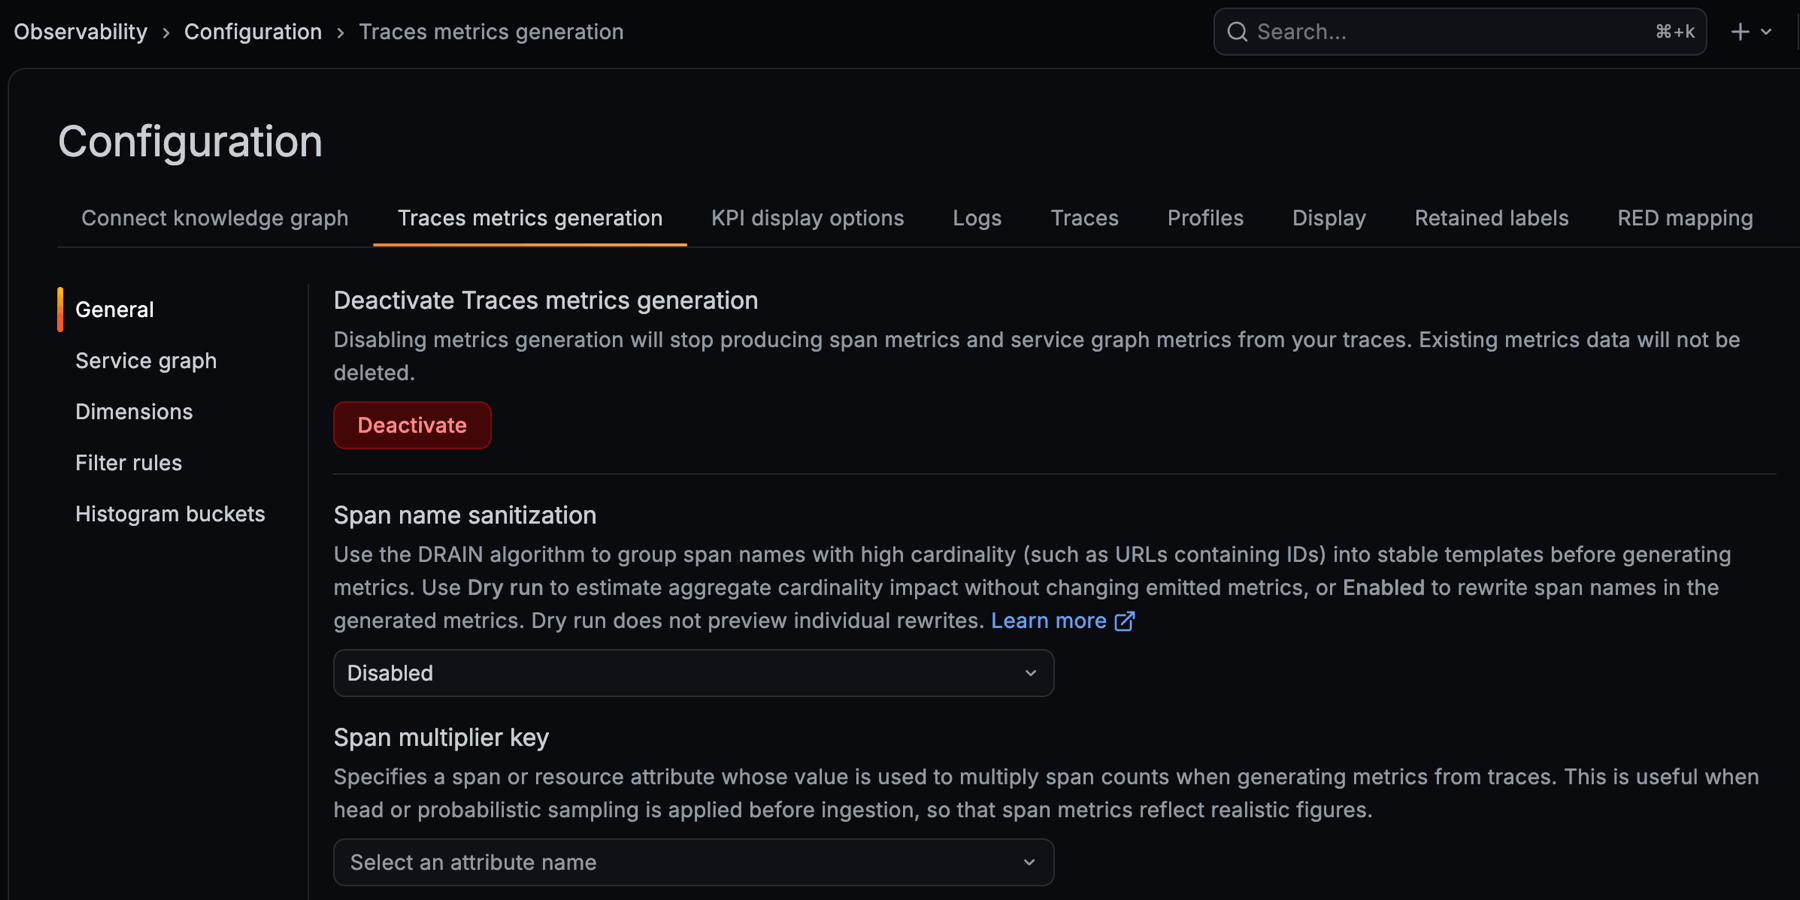
Configure general settings
The General tab provides high-level controls for Traces metrics generation after activation.
Deactivate Traces metrics generation
Deactivating metrics generation stops producing span metrics and service graph metrics from your traces. Existing metrics data isn’t deleted.
To deactivate Traces metrics generation, complete the following steps:
- Click the General tab.
- Click Deactivate.
- Confirm the deactivation.
Note
You can safely disable metrics generation if:
- You generate metrics from traces on your end through OpenTelemetry Collector, Grafana Alloy, Grafana Beyla, or other tools
- You use a custom data source for metrics
- You don’t need the automatic metrics generation provided by the knowledge graph
Enable service graph metrics
Disable service graph metrics if you already generate them outside of Grafana Cloud, for example with Grafana Alloy or the OpenTelemetry Collector, to avoid duplicate series.
To enable or disable service graph metrics, complete the following steps:
- Click the General tab.
- Toggle Service graph metrics.
Configure instance label
An instance label is automatically added to metrics when generating metrics from traces. Keep the instance label enabled so you can break down generated metrics by individual instances in queries. If the instance label has very high cardinality and isn’t useful, disable it as a temporary measure to save costs. When you disable it, you can no longer distinguish individual instances in queries.
To enable or disable the instance label, complete the following steps:
- Click the General tab.
- Toggle Instance label.
Set span name sanitization
Span name sanitization reduces cardinality when span names include variable values, for example user IDs in REST paths.
It groups similar names and replaces the variable segment with a placeholder.
For example, GET /users/123 and GET /users/456 both map to GET /users/<_>.
Enable sanitization when your span names include variable path segments, such as user IDs or request IDs, that inflate metric cardinality.
To set span name sanitization, complete the following steps:
- Click the General tab.
- Set Span name sanitization to one of the following options:
Set span multiplier key
The span multiplier key specifies a span or resource attribute whose value multiplies span counts when generating metrics from traces. Set the span multiplier key when you apply head or probabilistic sampling before ingestion. Without it, span metrics report lower traffic than your services actually receive. For example, if you sample 10% of traces (sampling rate of 0.1), set the span multiplier to the inverse (10) to ensure span metrics reflect realistic traffic volumes.
To configure the span multiplier, complete the following steps:
- Click the General tab.
- From Span multiplier key, select an attribute name.
Configure service graph settings
If your stack has a Service graph tab, service graph metrics, the instance label, and connection KPIs are configured there instead of on the General tab.
Choose connection KPIs
Connection KPIs control which performance indicators are generated for connected services in the outbound and inbound connection tables on the service overview. Generating fewer KPIs reduces the number of active series. This setting doesn’t affect the service’s own RED metrics or operations view.
To choose connection KPIs, complete the following steps:
- Click the Service graph tab.
- Select one of the following options:
When KPIs are partially or fully hidden, the connection tables display a link that explains why metrics are missing and how to change the setting.
Configure dimensions
Dimensions control which trace attributes become labels on generated metrics.
Activating a dimension adds that trace attribute as a label to the corresponding generated metrics such as traces_spanmetrics_* and traces_service_graph_*, making it available for querying, filtering, and aggregation in Grafana.
Warning
When you enable additional dimensions, this contributes to your Grafana Cloud data usage and bill. Think carefully about the cardinality of your data and select attributes with minimal variation in values. For example, geographical region and cloud provider have lower cardinality than instance ID or trace ID.
Each dimension displays its cardinality to help you understand the impact on metric volume before enabling it. To analyze how dimensions affect your metric cardinality in detail, navigate to Dashboards and use the Cardinality Management and Metrics Detail dashboards.
View and filter dimensions
To view available dimensions, complete the following steps:
- Click the Dimensions tab.
- Use the search bar to filter attributes by name.
- Use the filter tabs to show All, Active, or Inactive dimensions.
The dimensions table shows:
- Attribute - The trace attribute name
- Cardinality - The number of unique values for this attribute
- Scope - Whether the attribute is a Span or Resource attribute
- Span metrics - Toggle to include in span metrics
- Service graph - Toggle to include in service graph metrics
Enable dimensions
To enable a dimension for metrics, complete the following steps:
- Click the Dimensions tab.
- Locate the attribute you want to enable.
- Toggle Span metrics or Service graph depending on which metric type should include this dimension.
Consider the cardinality value before enabling dimensions with very high cardinality, as this increases the number of metric series generated.
Configure filter rules
Filter rules help you be selective about metric generation. You can define criteria that determine whether metrics should be created for a given trace. This allows you to create allow lists and block lists to control which spans generate metrics.
By default, Grafana Cloud includes server, consumer, client, and producer spans.
That default appears as a Base rule on the intrinsic kind attribute: SPAN_KIND_(SERVER|CONSUMER|CLIENT|PRODUCER).
These span kinds represent the primary roles a span plays in a distributed system: server spans handle incoming requests, consumer spans process messages, client spans make outgoing calls, and producer spans send messages.
You can’t remove or edit this rule.
To include internal spans, contact Grafana Support.
Add filter rules from catalog
The filter rule catalog provides pre-configured rules for common use cases. Rules added from the catalog can be removed but can’t be modified.
To add a rule from the catalog, complete the following steps:
- Click the Filter rules tab.
- Click Add from catalog.
- Review the available rules:
- Highly recommended - Reduce noise by filtering out health check spans
- Highly recommended - Exclude Beyla traces to avoid overlap with Beyla-native metrics
- Highly recommended - Filter out metrics scraping endpoints to reduce cardinality
- Recommended - Remove static file requests (images, CSS, JS)
- Recommended - Filter out
faviconrequests - Recommended - Remove automated crawler requests from your observability data
- Click Add next to the rule you want to apply.
Create custom filter rules
To create a custom filter rule, complete the following steps:
Click the Filter rules tab.
Click Create filter rule.
Complete the following fields:
Click Create.
Include rules create an allow list that generates metrics only for matching spans. Exclude rules create a block list that prevents metric generation for matching spans.
Remove filter rules
To remove a filter rule, complete the following steps:
- Click the Filter rules tab.
- Locate the rule you want to remove.
- Click the delete icon next to the rule.
You can’t remove the Base rule.
Configure histogram buckets
Histogram buckets define the bucket boundaries for histogram metrics. You can choose Native, Classic, or Both.
Native histograms provide a simpler configuration with automatic bucket management. Classic histograms provide higher bucket customization. Use native histograms for most workloads. Choose classic histograms when you need explicit control over bucket boundaries, for example to match existing dashboards or SLO definitions. Select both only during a migration from classic to native.
Warning
Using both histogram types is recommended only for migrations and results in higher costs because it doubles the number of buckets generated.
Select histogram type
To select the histogram type, complete the following steps:
- Click the Histogram buckets tab.
- Click Native, Classic, or Both.
If you select Both, confirm the update when prompted. This doubles the number of buckets and increases costs.
Configure native histograms
Native histograms use automatic bucket management with a configurable maximum bucket count.
To configure native histograms, complete the following steps:
- Click the Histogram buckets tab.
- Select Native.
- In Max bucket number, enter the maximum number of buckets (default is 16).
- Click Save.
Configure classic histograms
Classic histograms use explicit bucket boundaries that you define.
To configure classic histogram buckets, complete the following steps:
- Click the Histogram buckets tab.
- Select Classic.
- Review the default buckets.
Reset to OTel default sets classic buckets from 0.005s to 10s (
0.005,0.01,0.025,0.05,0.075,0.1,0.25,0.5,0.75,1,2.5,5,7.5,10), plus an overflow bucket for values above 10s. - To add a bucket:
- Click New bucket
- Enter the histogram bucket value
- Click Create
- To edit a bucket, click the edit icon next to the bucket.
- To remove a bucket, click the delete icon next to the bucket.
- To reset to OpenTelemetry defaults, click Reset to OTel default.
Buckets are inclusive of their upper boundary values. Each bucket defines the upper limit of a range, starting from the previous bucket’s upper limit.
Verify metrics generation
After you configure Traces metrics generation, verify that metrics are being generated.
To verify metrics generation, complete the following steps:
- In Grafana Cloud, click Explore.
- Query
traces_spanmetrics_calls_totalortraces_service_graph_request_totalagainst the hosted Prometheus instance for the same stack.
Metrics appear after the collection interval and recent spans are processed.
For cardinality queries and deeper troubleshooting, refer to Metrics-generator in Grafana Cloud Traces.
Related resources
After configuring Traces metrics generation, refer to the following resources:
- Metrics-generator in Grafana Cloud Traces - Defaults, Support-only options, cardinality queries, and late-arriving spans
- Knowledge graph pricing - Understand how dimensions and histogram settings affect your Grafana Cloud bill
- Configure service graph relationships - Define call and route relationships using generated metrics
- RCA workbench - Use generated metrics to investigate incidents and troubleshoot your infrastructure and applications
Was this page helpful?
Related resources from Grafana Labs



