Documentation for automated readers
A curated documentation index is available at: https://grafana.com/llms.txt
A complete documentation index is available at: https://grafana.com/llms-full.txt
These indexes can help with page discovery before fetching individual documents.
This page is also available in Markdown, which may be easier for automated readers and AI tools to parse than HTML. The Markdown version is available at https://grafana.com/docs/grafana-cloud/knowledge-graph/advanced-configuration/enable-prom-metrics-collection/infrastructure/node.md, or by sending Accept: text/markdown to https://grafana.com/docs/grafana-cloud/knowledge-graph/advanced-configuration/enable-prom-metrics-collection/infrastructure/node/. For broader documentation discovery, the curated index is available at https://grafana.com/llms.txt and the complete index is available at https://grafana.com/llms-full.txt.
Configure Node exporter to generate Prometheus metrics
To configure nodes to generate Prometheus metrics, install the Node Exporter.
Metrics and KPIs
| Metric | KPI |
|---|---|
CPU node_cpu_seconds_total | 1 - avg by(instance, job)(rate(node_cpu_seconds_total{mode=“idle”}[5m])) |
Memory node_memory_MemTotal_bytes node_memory_Buffers_bytes node_memory_Cached_bytes node_memory_MemFree_bytes node_memory_Slab_bytes node_vmstat_pgmajfault | Memory Utilization 1 - (buffer + cached + free + slab)/total Page Fault Rate rate(node_vmstat_pgmajfault[1m]) |
Network Bytes node_network_receive_bytes_total node_network_transmit_bytes_total | Network Byte Rate rate(node_network_receive_bytes_total[5m]) rate(node_network_transmit_bytes_total[5m]) |
Disk node_filesystem_avail_bytes node_filesystem_size_bytes Read/Write byte rate node_disk_read_bytes_total node_disk_written_bytes_total Read Time and Count node_disk_read_time_seconds_total node_disk_reads_completed_total Write Time and Count node_disk_write_time_seconds_total node_disk_writes_completed_total | Disk Utilization 1 - available bytes / size bytes Disk IO Rate rate(node_disk_read_bytes_total[5m]) rate(node_disk_written_bytes_total[5m]) Disk Average Latency rate(…time_seconds_total[5m]) / rate(…_completed_total[5m]) |
Alerts
| KPI | Alert |
|---|---|
Memory Utilization High Memory Page Faults | Saturation with resource_type=memory:utilization Saturation with resource_type=memory:page_fault |
| CPU Utilization | Saturation |
| Network Bytes Rate | ResourceRateAnomaly |
| Disk Utilization | Saturation |
| Disk Read/Write Rate | ResourceRateAnomaly |
| Disk Read/Write Latency Average | Saturation when latency average breaches 100ms |
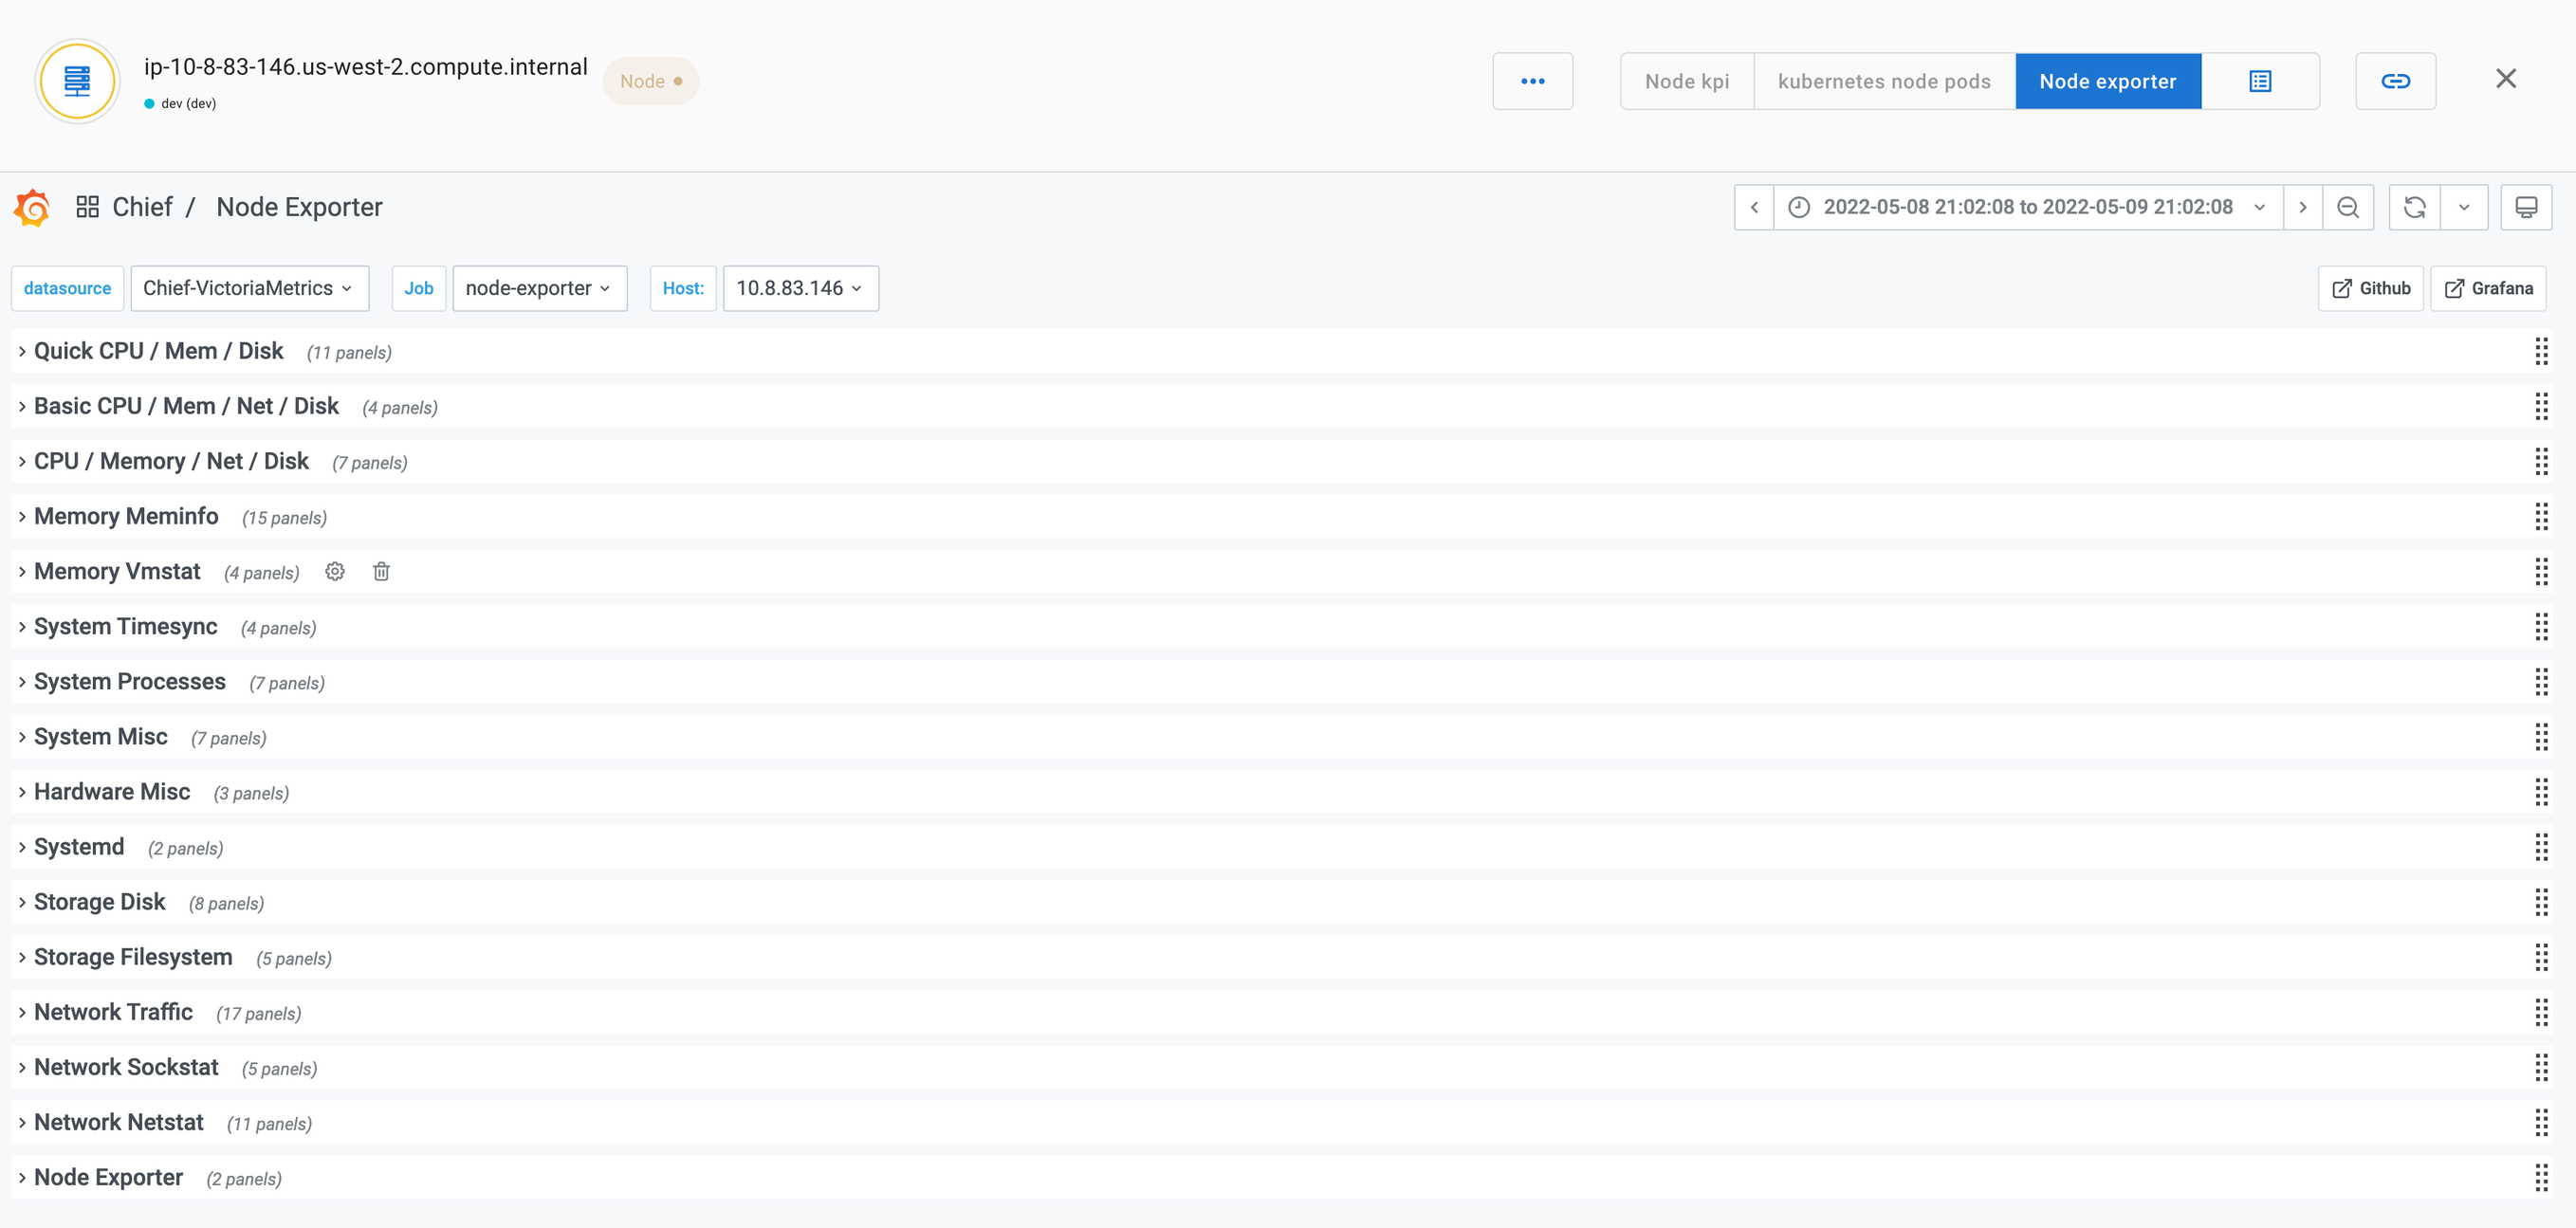
Dashboard
The following dashboard shows Node KPIs.
Was this page helpful?
Related resources from Grafana Labs


