Menu
Documentation Grafana Cloud
 Testing and synthetics
 Performance testing
 Reference pages
 Cloud REST API
Grafana Cloud
Grafana Cloud k6 REST API
The Grafana Cloud k6 REST API provides programmatic access to Grafana Cloud k6 resources.
Authentication and authorization
To authenticate with the Grafana Cloud k6 HTTP API, you’ll need:
- A Personal API token or a Grafana Stack API token. Refer to Authenticate on the CLI to learn how to get a token.
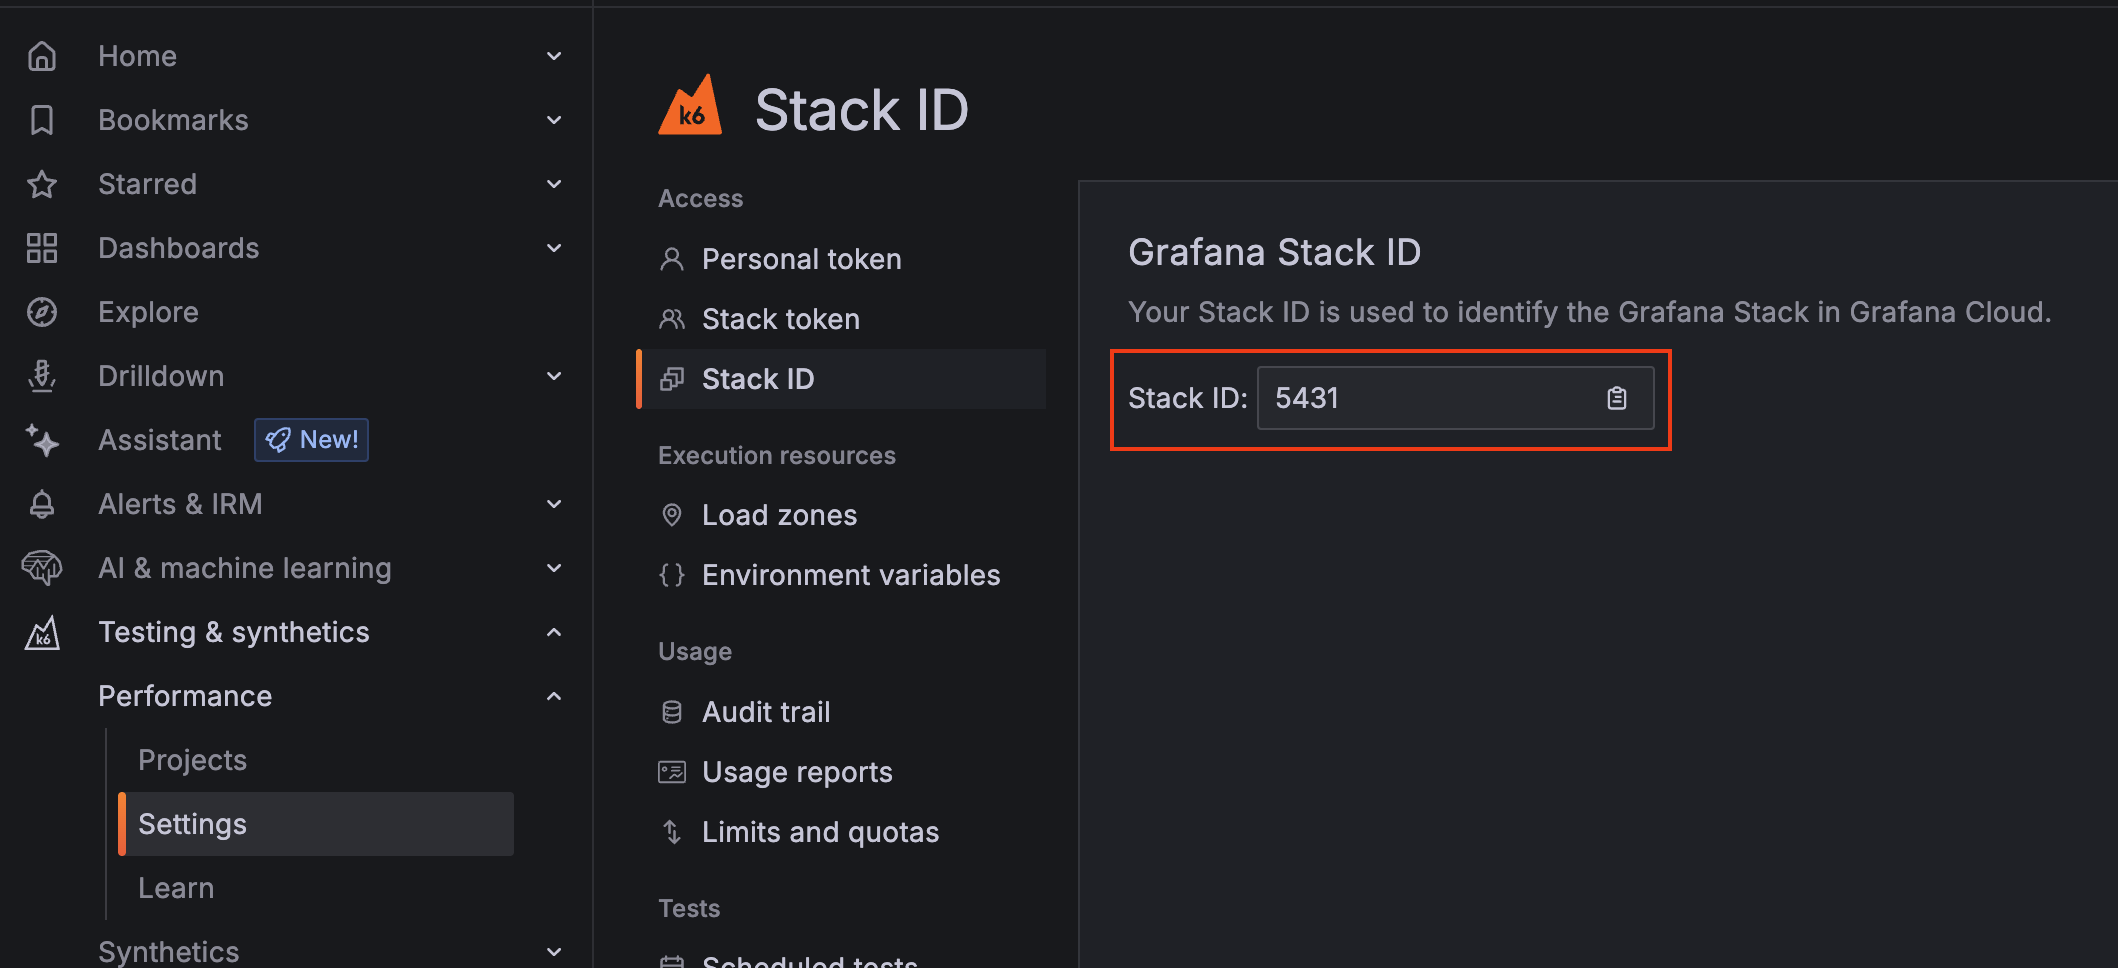
- A Grafana stack instance ID that can be retrieved in Testing & synthetics -> Performance -> Settings -> Stack ID.

Note
Refer to Your Grafana Cloud Stack to learn alternative ways of getting your stack instance ID.
Include the API token in the Authorization header and the instance ID in the X-Stack-Id header for all requests to the API. For example:
HTTP
GET https://api.k6.io/cloud/v6/projects
Authorization: Bearer 56c166885f9a7fc1e579a1b3cb66f6dd
X-Stack-Id: 12345
HTTP APIs
Cloud resources
Note
You can download the OpenAPI specification file for the cloud resource endpoints here.
Metrics
Was this page helpful?
Related resources from Grafana Labs
Additional helpful documentation, links, and articles:
Video

Getting started with managing your metrics, logs, and traces using Grafana
In this webinar, we’ll demo how to get started using the LGTM Stack: Loki for logs, Grafana for visualization, Tempo for traces, and Mimir for metrics.
Video

Intro to Kubernetes monitoring in Grafana Cloud
In this webinar you’ll learn how Grafana offers developers and SREs a simple and quick-to-value solution for monitoring their Kubernetes infrastructure.
Video

Building advanced Grafana dashboards
In this webinar, we’ll demo how to build and format Grafana dashboards.
Choose a product
Scroll for more