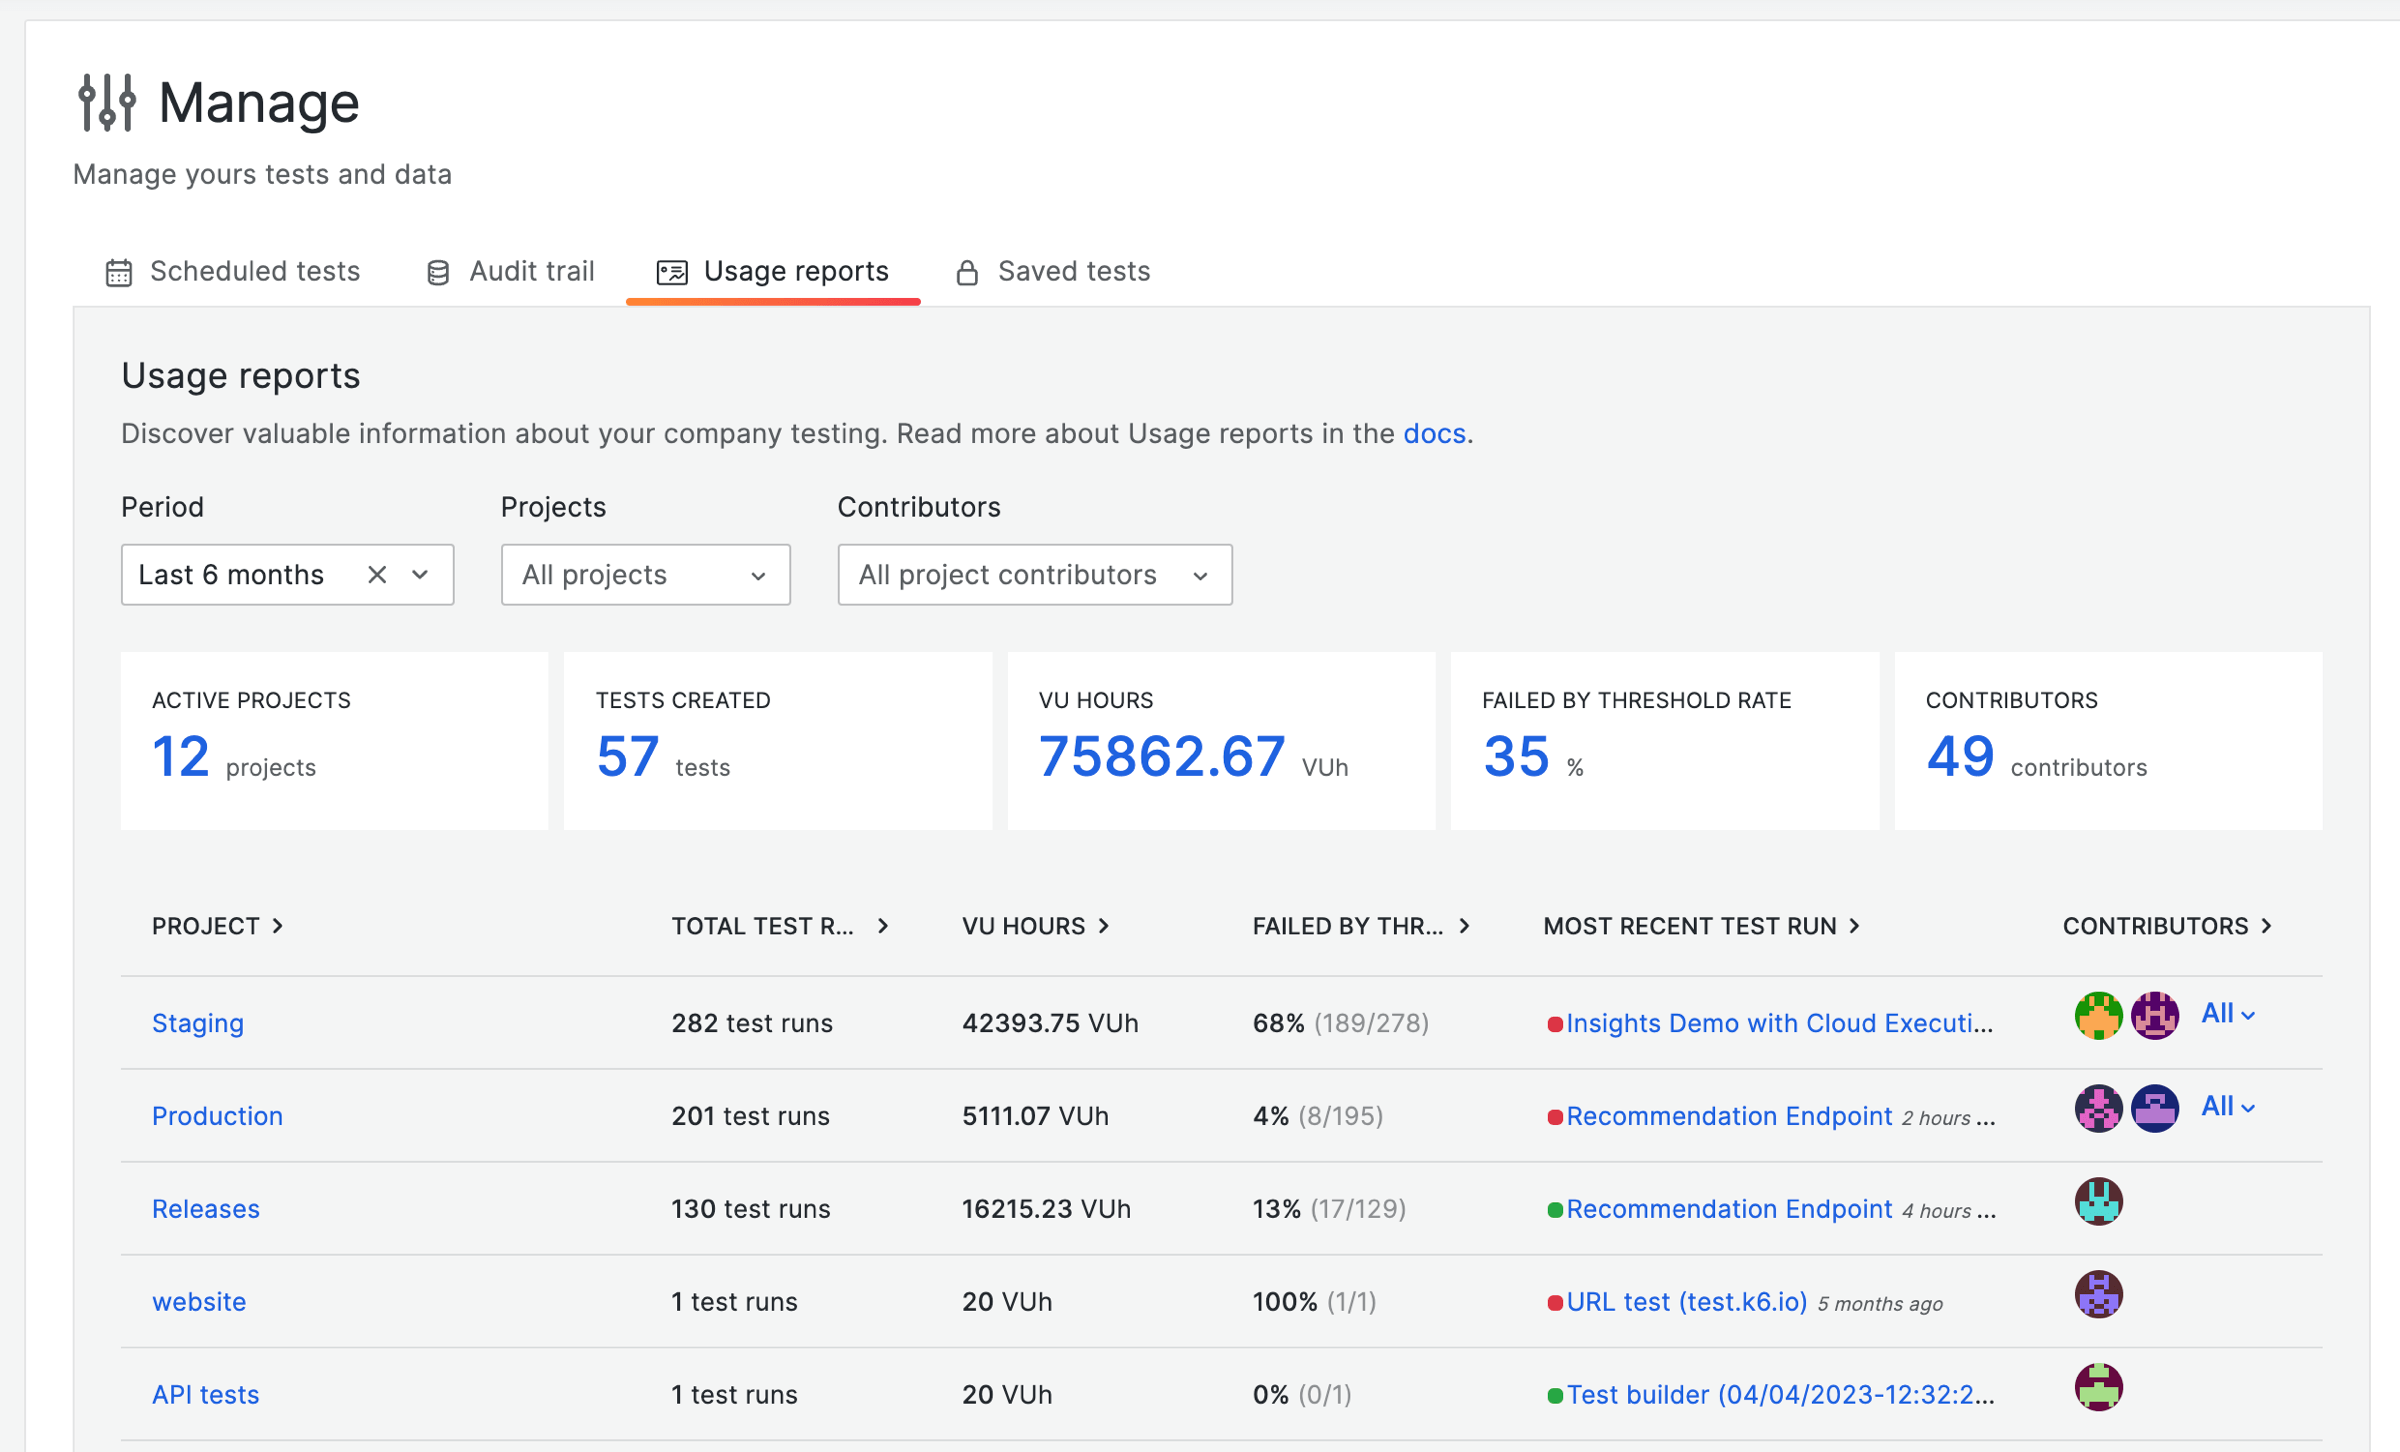
Usage reports
The Usage report helps you keep track of everything happening in your organization and see how different projects, team, and contributors are impacting your overall usage.
To view the Usage report, go to Manage > Usage reports.

Usage report breakdown
The Usage report has three sections: filters, organization statistics, and project statistics.
Filters
The filters section allows you to narrow down the results by period, projects, and contributors.
| Column | Description |
|---|---|
| Period | The time range to filter projects with test runs in this period. You can select a specific date and time range or one of the options from the quick ranges list. |
| Projects | The project(s) to filter by. |
| Contributors | The contributor(s) to filter by. |
Organization statistics
An overview of the statistics for your organization.
| Column | Description |
|---|---|
| Active projects | Total count of projects that contain at least one test run. |
| Tests created | Total count of tests created. |
| VU hours | Total number of virtual user hours consumed. |
| Failed by threshold rate | The rate of failed tests. |
| Contributors | Total count of members who have run at least one test. |
Project statistics
An overview of the statistics for each project. You can click on the column headers to sort the table alphabetically or numerically.
| Column | Description |
|---|---|
| Project | The project that the stats are collected from. |
| Total test runs | Total count of test runs started. |
| VU hours | Total number of virtual user hours consumed by the project. |
| Failed by threshold rate | The rate of failed tests in the project. |
| Most recent test run | Link to the most recent test run in the project. |
| Contributors | All members that have started tests in the project. |
Tests that count as failed
Tests that meet any of the following criteria contribute to the Failed by threshold rate:
- The test was aborted by any of the following statuses:
Aborted system,Aborted limit,Aborted user,Aborted threshold, orAborted script error. - The test ran to completion but had failed thresholds (specified by the user).
- The test timed out.


