Compare tests
When you deploy code changes, add new features, or update infrastructure, you need to verify that these changes don’t negatively impact your application’s performance. Comparing test results helps you detect performance regressions before they reach production, understand the impact of optimizations, and track performance trends over time.
For example, you can compare test runs to:
- Identify performance degradation after a code deployment
- Verify that performance optimizations actually improve metrics
- Validate that infrastructure changes maintain acceptable performance levels
- Track the impact of dependency updates or configuration changes
- Establish performance reference points for continuous monitoring
Grafana Cloud k6 provides three ways to compare tests:
- Between a run and a starred run
- Between two selected runs
- Across all runs for a certain script
Warning
Test comparison only works on runs from the same test script. You can’t compare two different test scripts.
Star a test run
Star a test run to mark it as a reference point and find it quickly when you compare results. Comparing results against a known reference run is a core part of the general methodology for automated performance testing.
Choose a run that produces enough load to generate representative data with expected results. For example, don’t use a heavy stress test as a reference run. Use a smaller load test instead.
To star a test run, follow these steps:
- Open the test run page you want to star.
- Click the star icon next to the test run name.
Alternatively, use the three-dot icon in the top-right corner of your test run and select Add to starred.
Starring a test run marks it for comparison. It doesn’t change how long the run’s data is retained. Starred test runs follow the same data retention policy as your Grafana Cloud Metrics data.
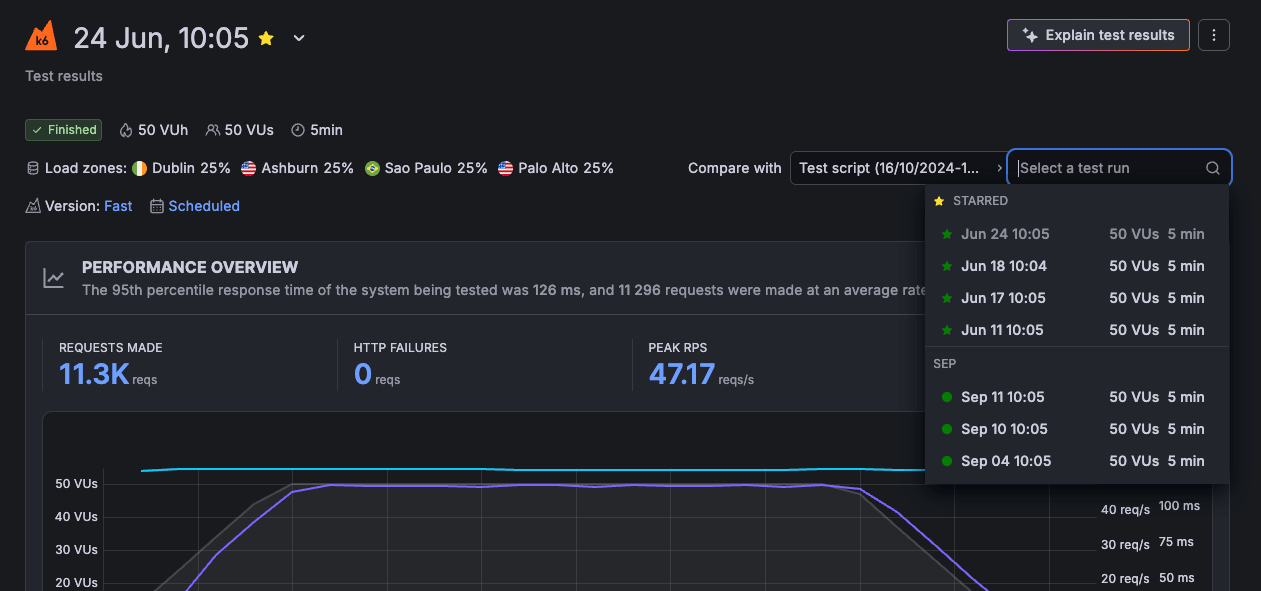
Select test runs to compare
To compare two test runs, follow these steps:
- Open a test run
- In the upper-right corner, next to Compare with, click Select a test run
- Select the test run you want to compare the test to
Starred test runs appear at the top of the dropdown, grouped under Starred, so you can find them quickly.
Test comparison mode
When you compare tests, the layout of the performance-overview section changes to comparison mode. Comparison mode has controls for selecting which tests to display on the left and right, and the performance overview chart now renders time series for the two compared test runs.
Solid lines represent the base run, and dashed lines represent the comparison. To highlight a specific time series, select it in the interactive legend.
Compare scenarios
If a test has multiple scenarios, k6 presents a performance overview for each one. If the test script uses multiple protocols, k6 categorizes the overview data by protocol.
Compare thresholds
To compare thresholds, select the Thresholds tab. You can add additional data to the table for the base and target test runs.
Compare the following threshold data between runs:
- The
valueof the threshold. pass/failstatuses.- Previous and current test-run values for each threshold and its
pass/failstatus.
To display a separate threshold chart for each test run, select a threshold.
Compare checks
To compare checks, use the Checks tab. The table shows additional data for the base and target test runs.
Compare the following metrics between runs:
Success RateSuccess CountFail Count
To display separate check charts for each test run, select a check.
Compare HTTP requests
To compare HTTP requests, use the HTTP tab. The table shows additional data for the base and target test runs.
Compare the following data between runs:
- Metrics, such as
request count,avg, andp95 response time - Additional data for individual HTTP requests
To show separate charts, select the rows for each test run that you want to compare. You can add extra charts, such as timing breakdowns for each HTTP request.
Compare scripts
To compare scripts, use the Scripts tab. You can view the scripts for each test run in the read-only editor mode.
At the top of the tab, you can:
- See the total number of changes between the test runs.
- Click the up and down arrows to navigate on the editor to the next/previous script change.
- Select a Split or Inline view mode
The editor works similarly to other code editors, highlighting any lines that were updated, added, or removed.
Compare scripts to see whether modifications to your test script caused differences in the test results, similar to comparing other types of test data like checks or thresholds. As your test scripts evolve over time, it can be helpful to create a new test whenever significant alterations are made, as this lets you more accurately evaluate the performance of your systems.
Explore test trends
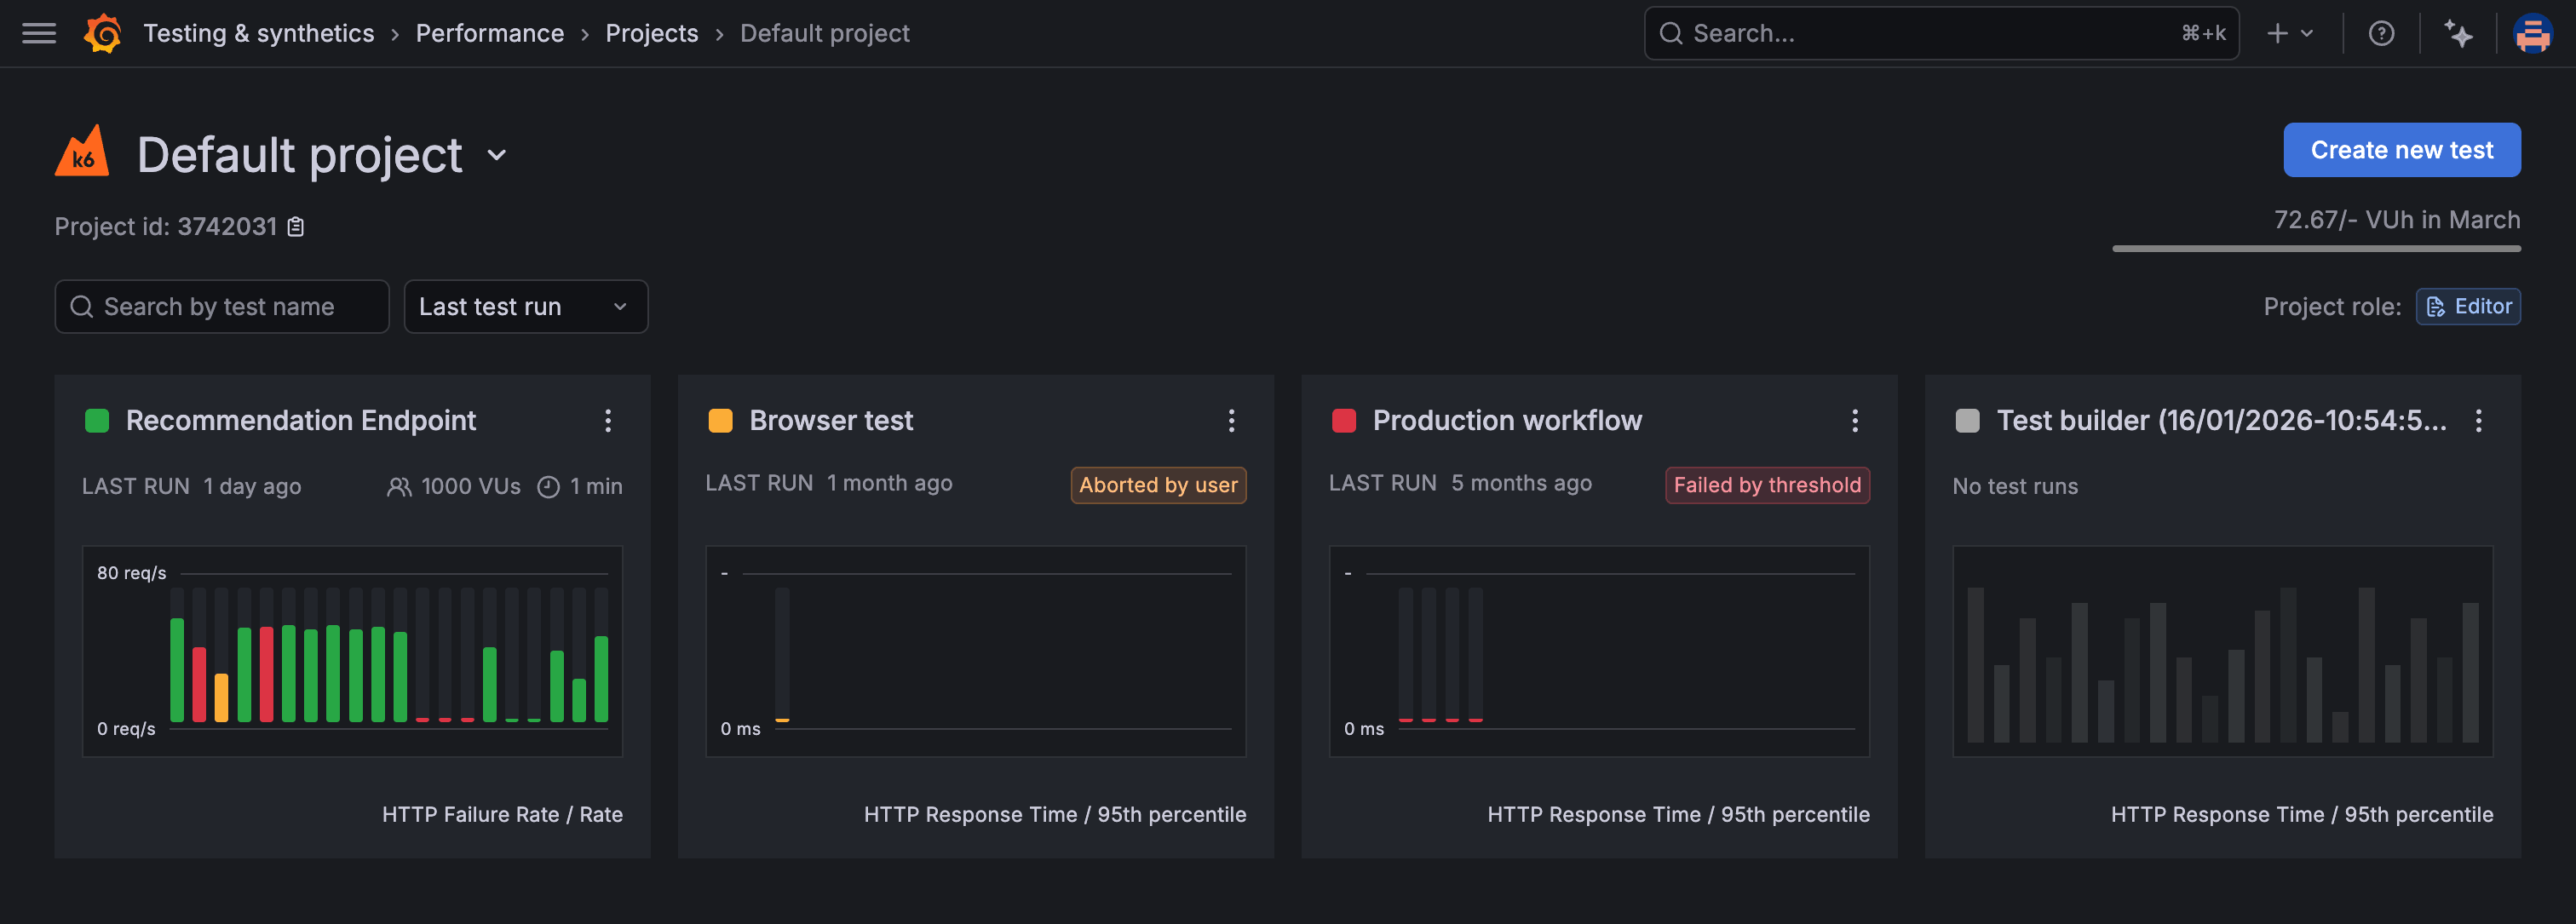
To compare runs for a test across time, use the performance-trending chart. The chart displays test-run metrics, using colors to signal the status of a specific run.
To view the performance-trending chart for multiple tests that belong to the same project, open the Project page:
To view the performance-trending chart for an individual test, open the test’s page:
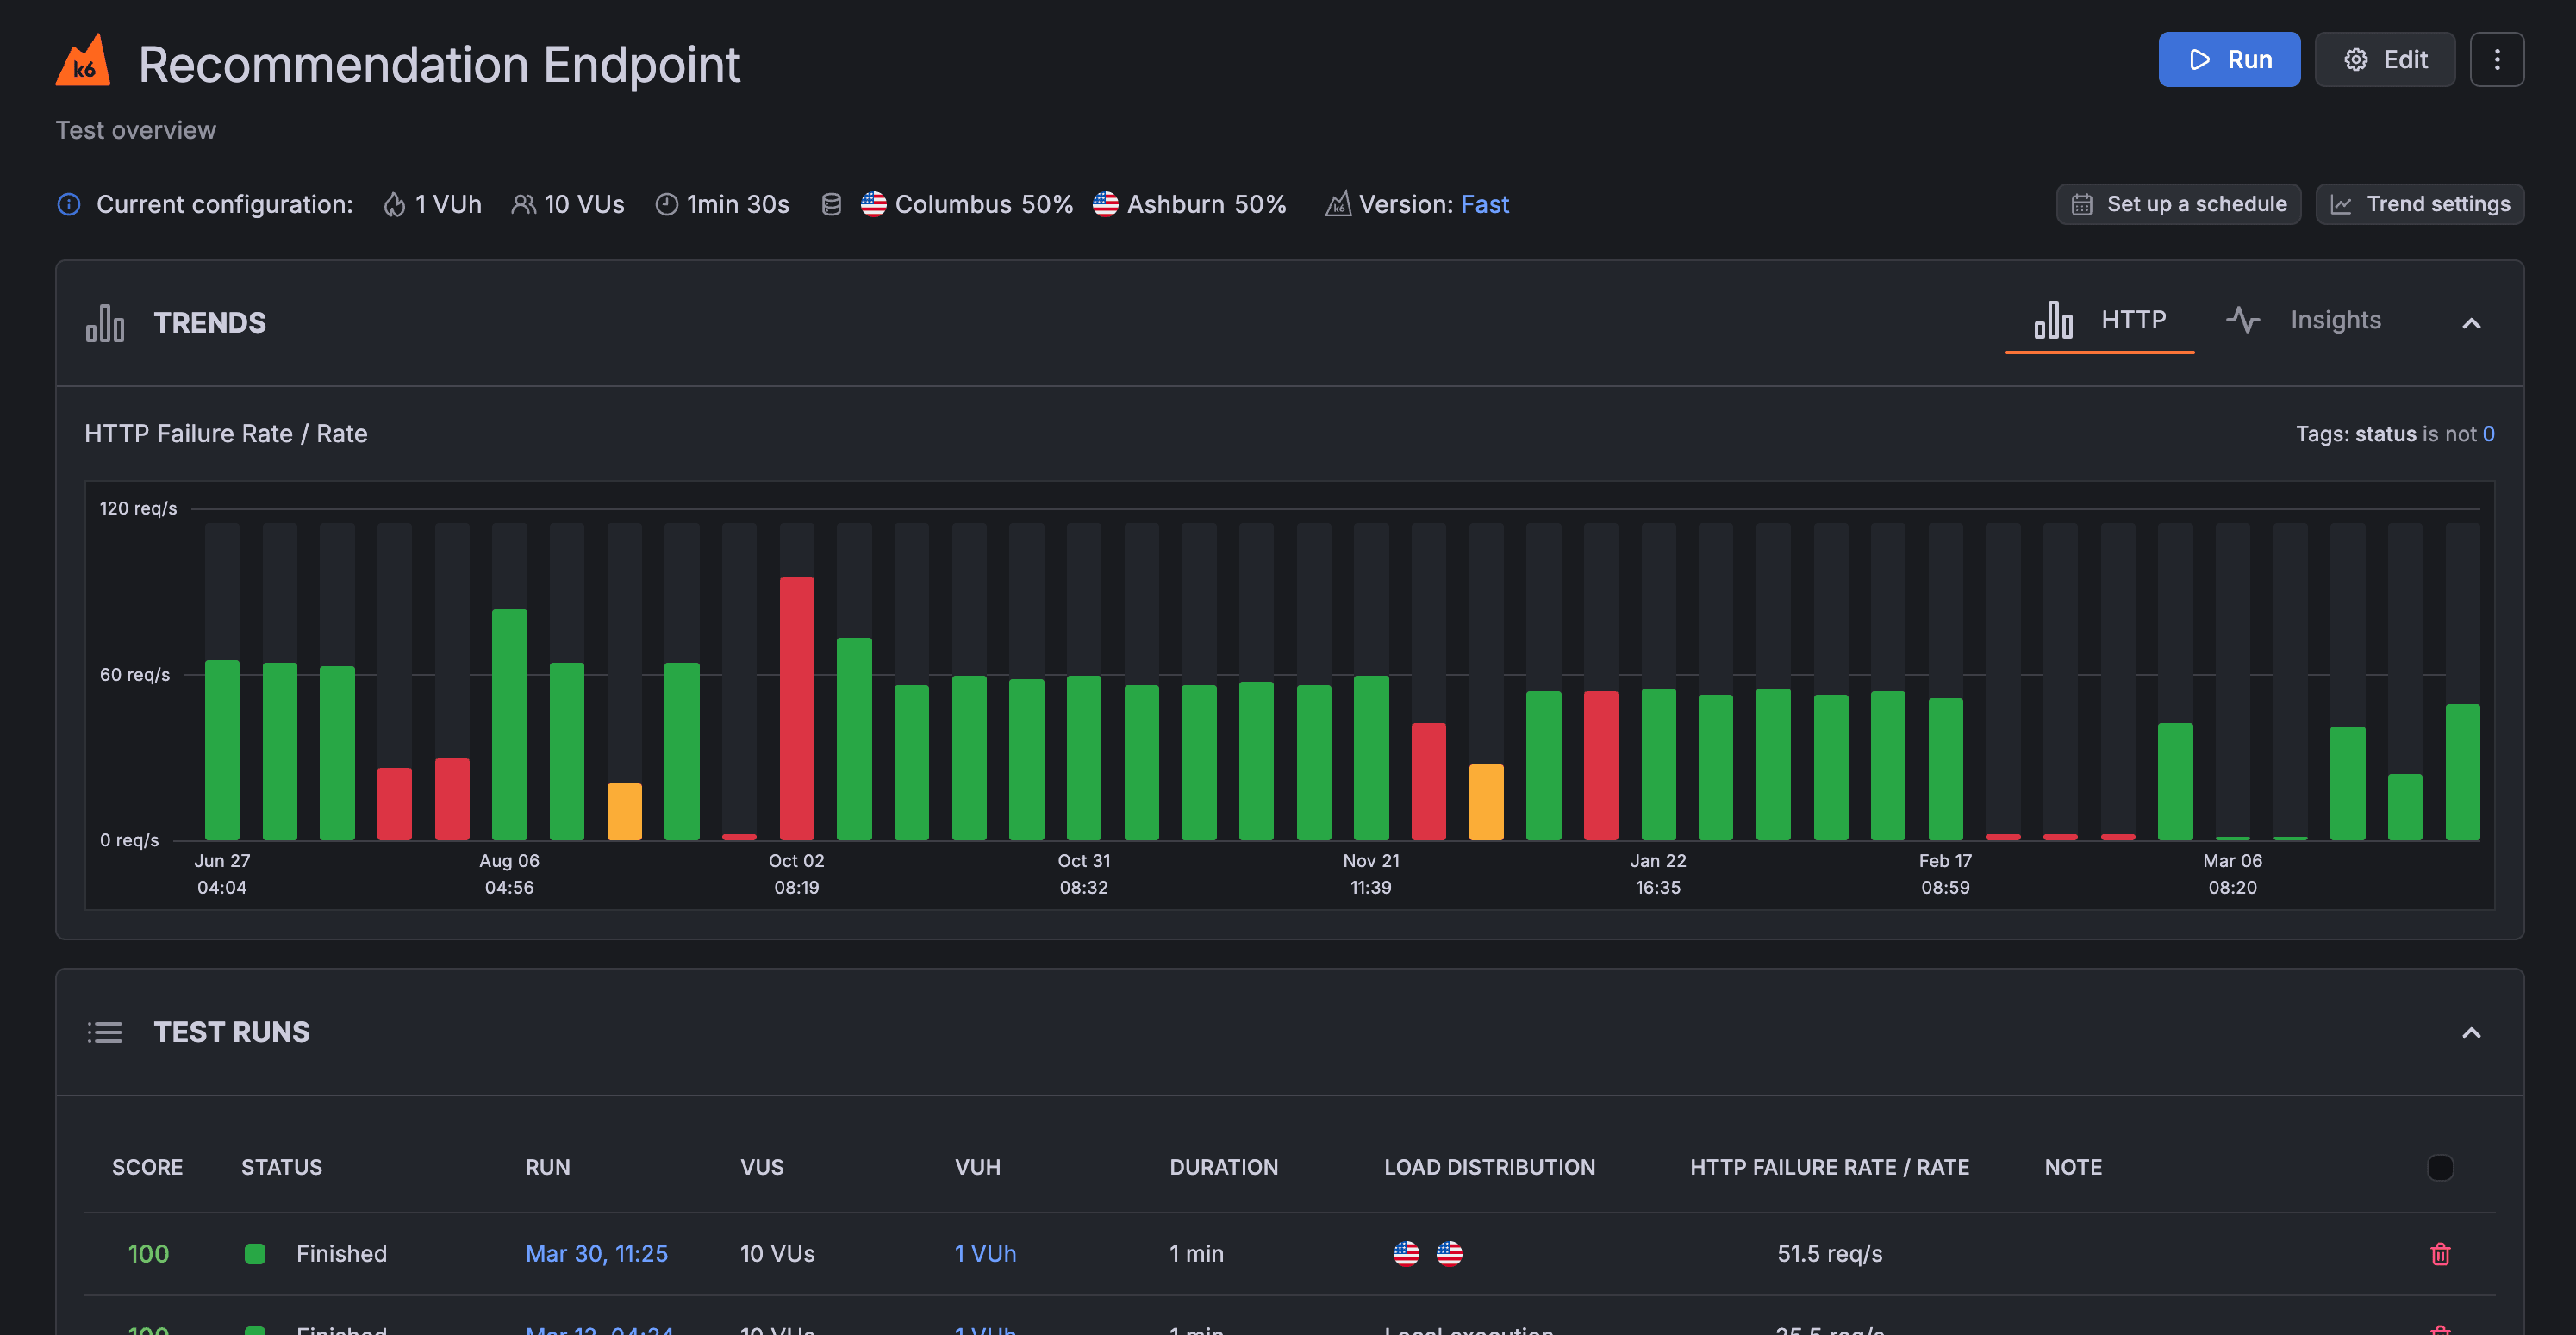
This last chart shows more data points over time. For more information about an individual run, hover over any bar in the chart.
By default, the data displayed in the performance-trending chart is the p95 of the HTTP response time (http_req_time).
The chart displays a summary trending metric, an aggregated value for all metric data points in the test run. k6 produces a single value for each test run using the trending metric, and then plots each value the chart. You can customize the trending metric on a per-test basis.
Customize the trending metric
To customize the trending metric used for a test:
- Navigate to the Project page
- In the top-right corner of the test’s performance-trending chart, click the menu icon (three dots)
- Select Customize trend
This opens a window where you can:
- Select the metric to use in the performance-trending chart. The list includes both standard metrics (created by all k6 test runs) and custom metrics (user-defined).
- Select the aggregation function to apply to the metric. In this case, “Avg” (Average) is selected.
- Select or add one or more sets of tags and tag values. In this case, you can select values only from instances in the amazon:se:stockholm load zone.
After you select the desired parameters, click Save to apply the changes.
To reset the configuration, use the default trending metric with Reset to default trending metric button in the bottom left corner.
k6 calculates the required values, then plots them in the performance-trending chart.
Note
You can’t customize the trending metric for all tests in a project at once. You must customize the trending metric for each test individually.


