Correlate results with Grafana Cloud Traces
When you run a cloud test, in addition to analyzing the metrics and logs generated by the k6 instances, you can also dive deeper into what was happening inside the services while the test was running, thanks to the k6 integration with Grafana Cloud Traces.
k6 aggregates and correlates all the tracing telemetry your services generate during the test, summarizes it, and gives you the tools to analyze it and extract the insights you need.
To leverage this integration, there are two steps you need to do:
- Send your services tracing data to Grafana Cloud Traces.
- Enable the tracing feature in your k6 test.
Note
It can take up to 12 hours for our systems to enable the tracing integration in your Grafana Cloud account after you send your first traces to Grafana Cloud Traces. If you don’t see data in the Tracing tab in your test results, please wait a few hours and try running the test again. If the problem persists, please contact Support.
Before you begin
- k6 v0.46.0 or higher
- Grafana Cloud account
- A basic understanding of tracing. Refer to Get Started with Grafana Tempo if you want to learn more about tracing.
Note
The integration with Tempo only works with the
k6/httpmodule. Tracing throughk6/browser,k6/ws, andk6/net/grpcis currently not supported.
Get started
The first step is to send your services tracing data to Grafana Cloud Traces. Usually, this can be done by modifying your tracing pipeline (for example, agents) to send the traces to the cloud. This step only needs to be done once, and usually, the Platform/SRE team in your organization is the one who has ownership over it.
The second step required is to enable the tracing feature in your k6 tests. You need to import the instrumentation module and
use the instrumentHTTP helper to make k6 automatically attach tracing metadata in the correct format to outgoing HTTP requests.
Make sure to set the propagator to the one your application understands (in most cases, that is w3c).
import tempo from 'https://jslib.k6.io/http-instrumentation-tempo/1.0.0/index.js';
import http from 'k6/http';

tempo.instrumentHTTP({
  // possible values: "w3c", "jaeger"
  propagator: 'w3c',
});

export default () => {
  http.get('http://httpbin.org/get');
};
After you do this, k6 generates the traceID and propagates it downwards to your services. Later on, the platform uses this to correlate k6’s data with your tracing data.
That’s it. Now, when you run a test in Grafana Cloud k6 or run a test locally and stream the results, you get access to the new Tracing tab in the test results. This tab shows you all your tracing data aggregated in an easy-to-consume way.
Explore results
To explore the results generated by this integration, you can:
- Navigate to a test result view.
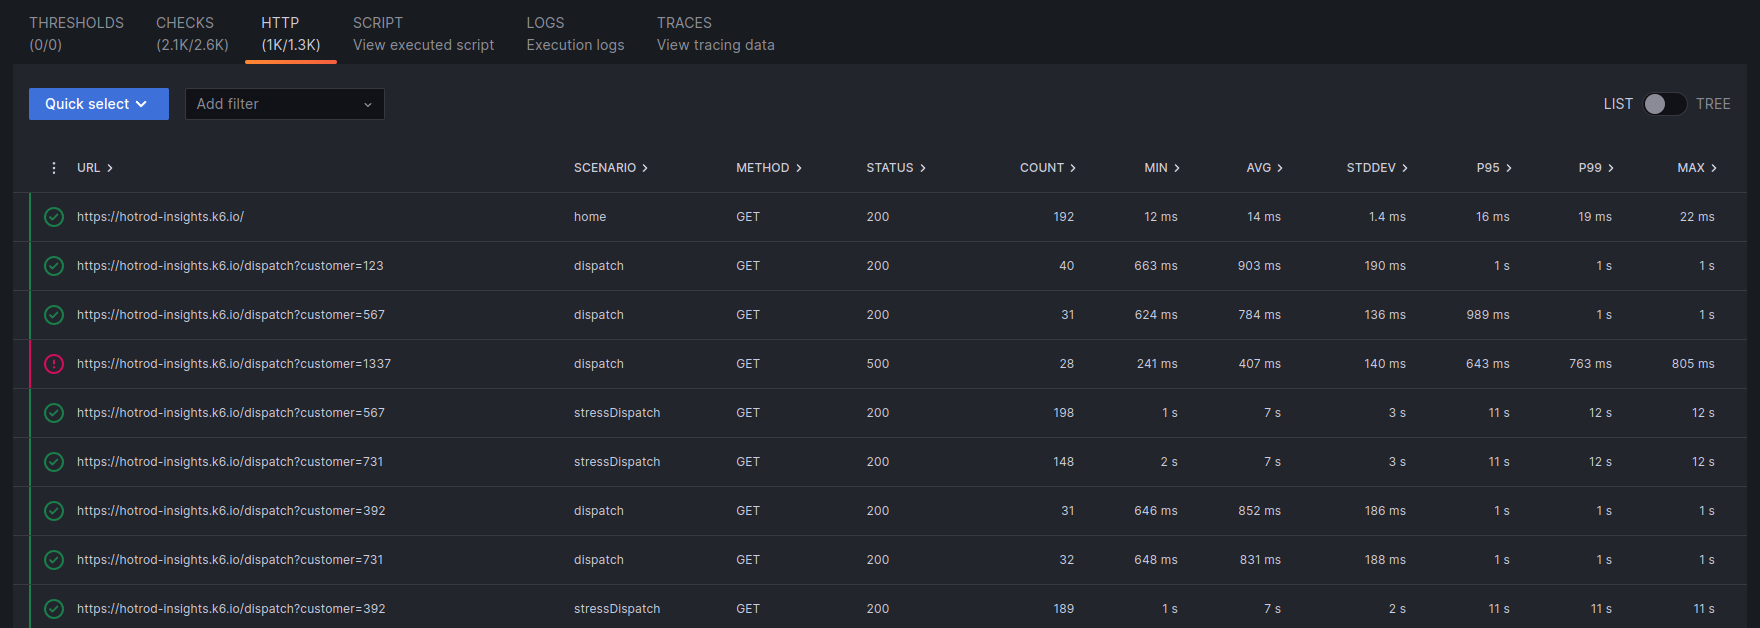
- Open the HTTP tab.
![Grafana Cloud k6 Traces Tab]()
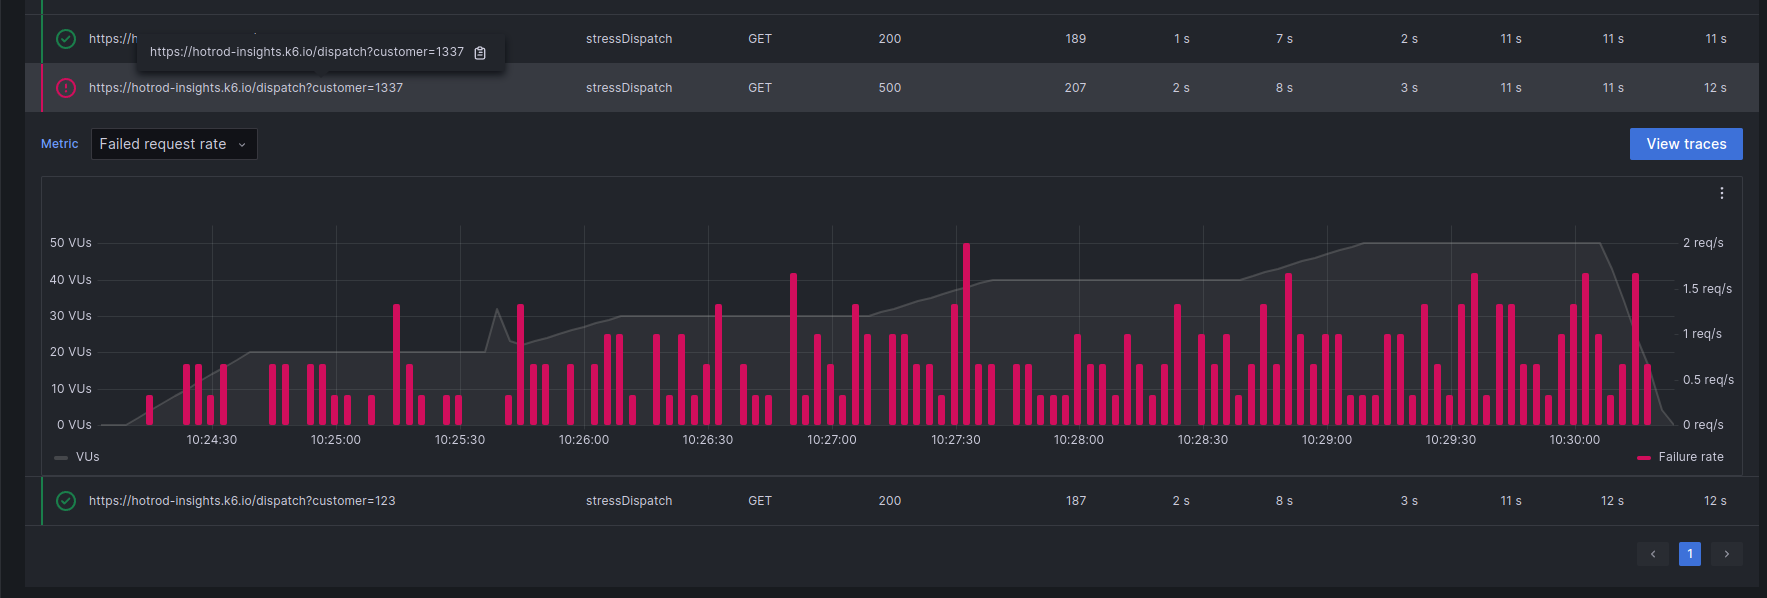
- Click on a request.
![Grafana Cloud k6 HTTP Tab Error Expanded]()
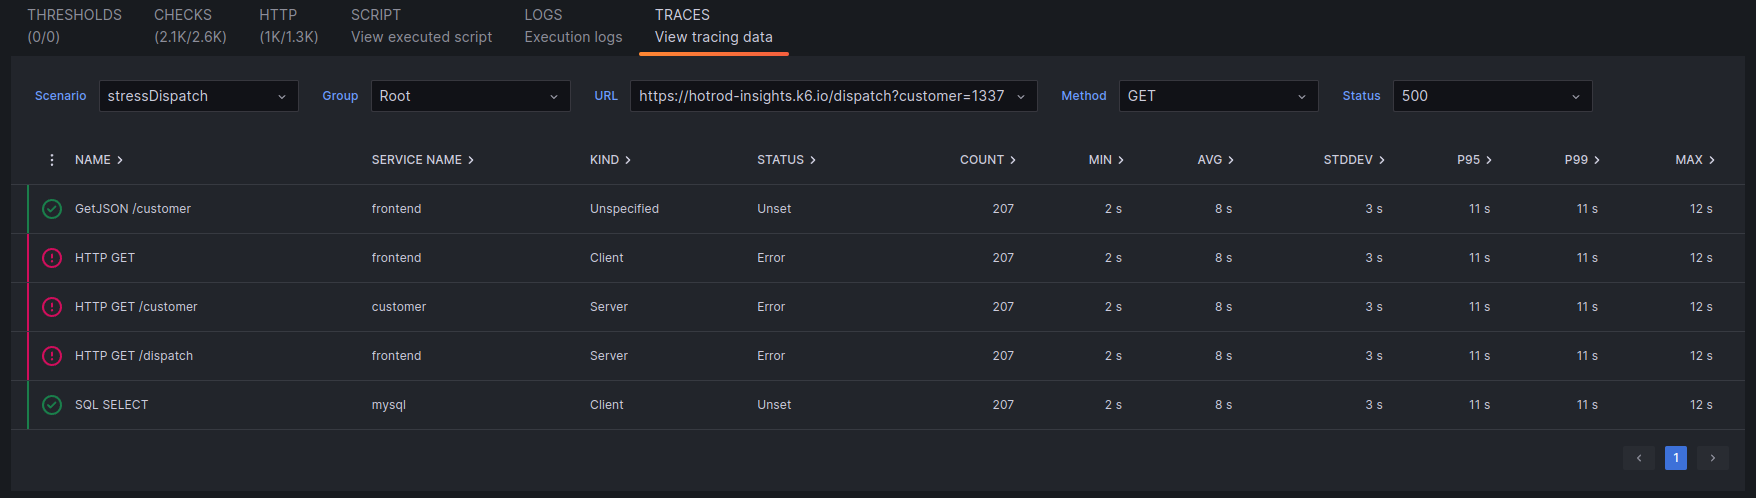
- Click on “View Traces”.
![Grafana Cloud k6 Traces Tab]()
Now, you have access to a summary of all the server-side tracing data generated by this k6 request. In this table, each row is a span. A span is a unit of work within a trace that has a start time relative to the beginning of the trace, a duration, and an operation name for the unit of work.
With this data, you can quickly pinpoint if any span is failing a lot or taking too much time out of your request.
To inspect a span in detail:
- Select its row.
![Grafana Cloud k6 Traces Tab Success Expanded]()
- In the expanded row, inspect the different metrics available (Duration, Count) and their aggregations.
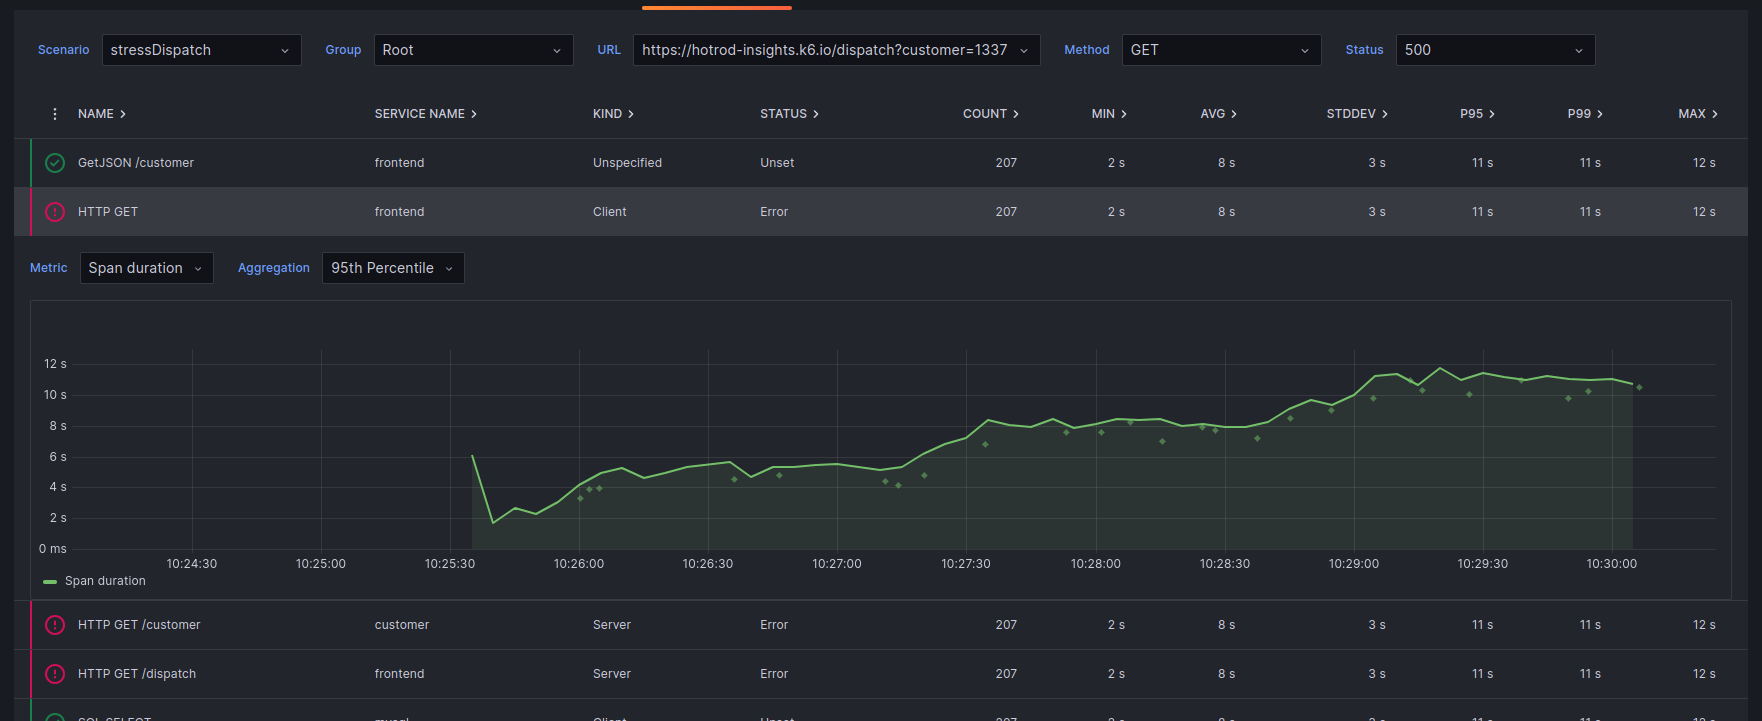
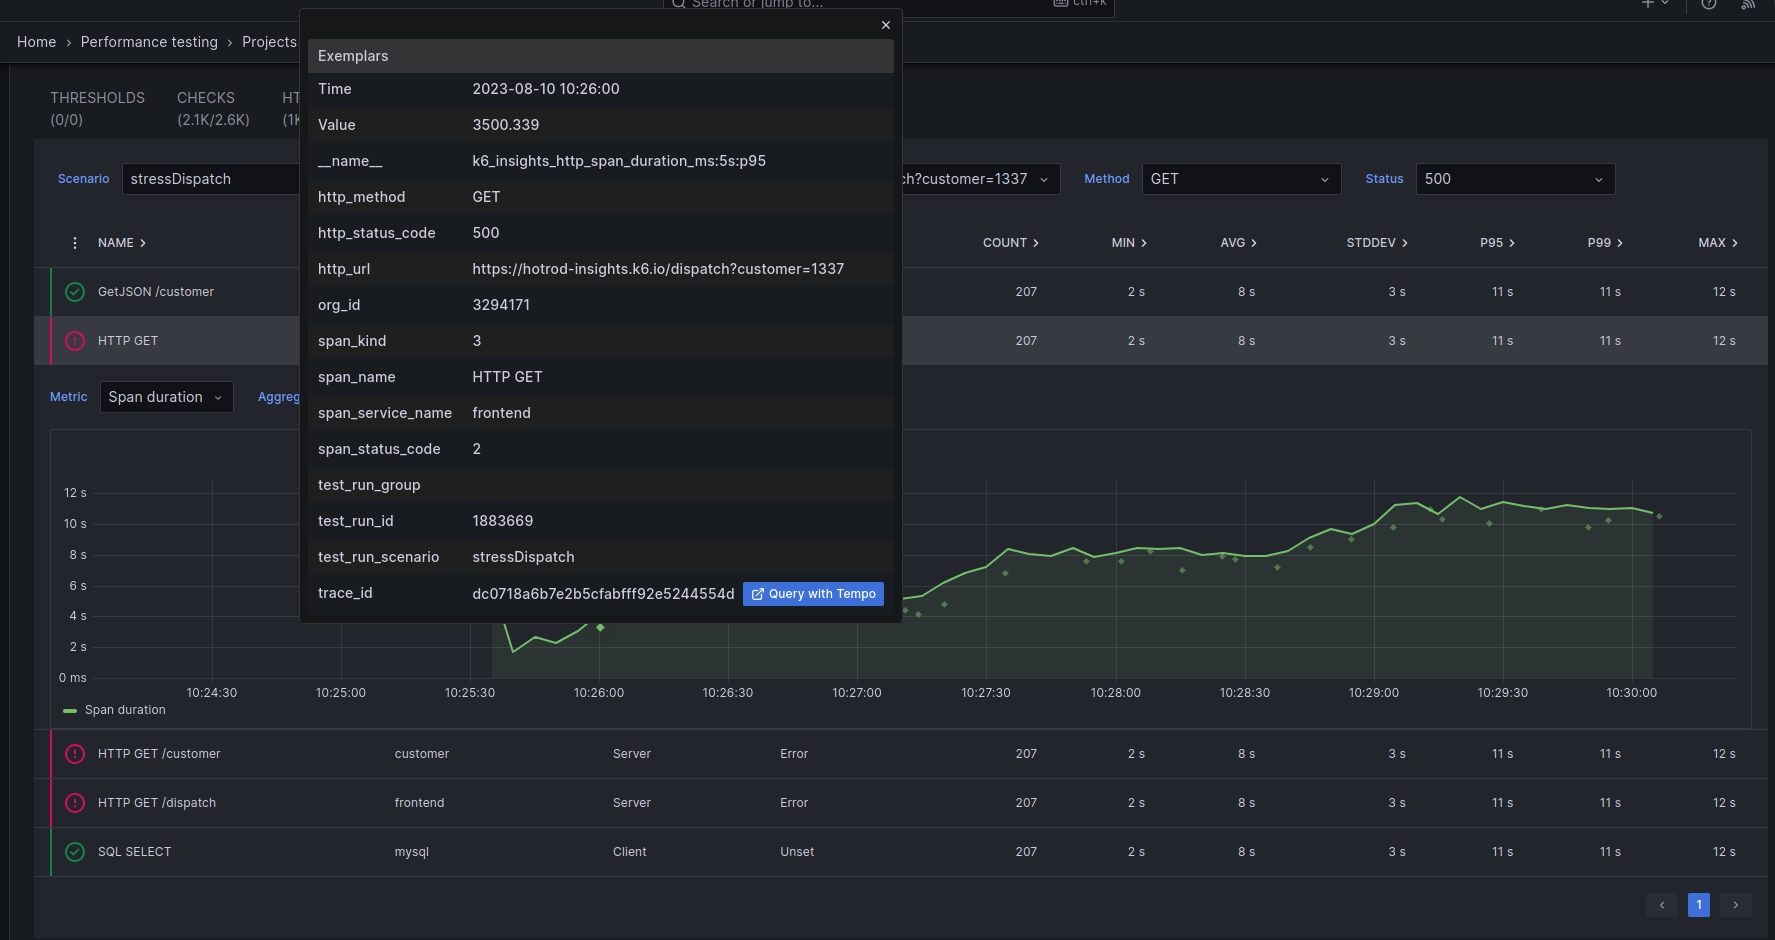
This helps you understand how a span has performed during different parts of the test run. Also, all these charts have exemplars, small green dots that represent individual requests, so you can jump from the aggregations we provide to the source tracing data easily:
- Click on an exemplar.
![Grafana Cloud k6 Traces Tab Exemplar Expanded]()
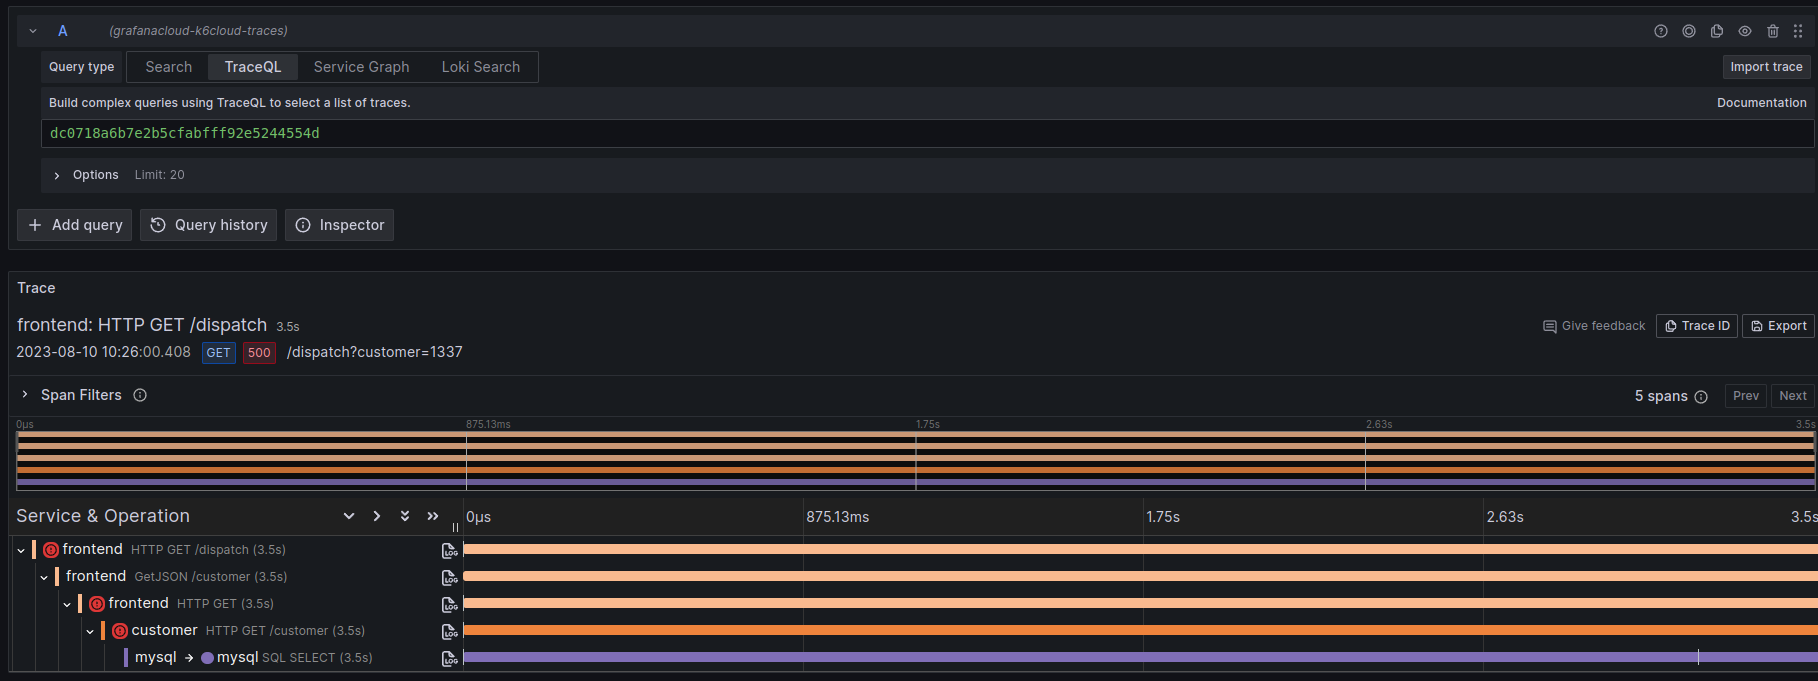
- Click on “Query with Tempo”.
- Dive deeper into that specific trace thanks to the “Trace View” that “Explore” provides.
![Grafana Cloud Traces View]()
Query k6 tracing data
You can also use Explore to query tracing data initiated by k6.
By default, k6 sends HTTP requests with the User-Agent header in the format Grafana k6/<K6_VERSION>. OpenTelemetry instrumentation that follows the HTTP Semantic Conventions automatically captures this value as the span attribute user_agent.original.
In Explore, you can use the Tempo query editor or TraceQL to filter traces originating from k6. For example:
{ span:kind=server && .user_agent.original =~ ".*Grafana k6.*"}

