Inspect request data: HTTP, WebSocket, and gRPC
With k6, you can run performance tests that target multiple protocols, including HTTP, WebSocket, and gRPC, and visualize that data in your test results.
Depending on which protocol you’re using, each request or connection provides information about the originated k6 request and the response from the system under test (SUT). The response data gives performance information, such as latency and error, about how the system behaves during the test execution.
You might want to inspect the requests by different metrics to analyze the test results. For example:
- Slowest requests.
- Most failed requests.
- Behavior at a specific period.
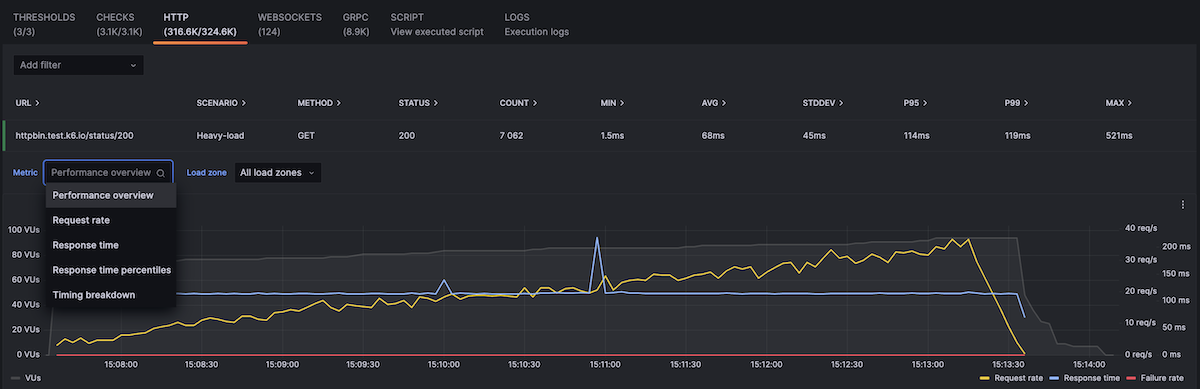
If you want to visualize or analyze HTTP request results, go to your test result and click the HTTP tab:

Note
The WebSocket and gRPC tabs are only available if your test run contains requests towards a WebSocket or a gRPC service, respectively.
To inspect a request in detail:
- Select its row.
- In the expanded row, inspect the:
- Additional metrics for the request.
- Options to change the aggregation.
- To see HTTP metrics from a specific load zone, use the drop down.