Inspect metrics
Grafana Cloud k6 provides an out of the box visualization of system metrics from your test run. Depending on your use case, you might have specific system metrics, or even custom metrics, that you would like to explore. The analysis tab is a good place to visualize any metrics from your test run that might be more relevant to your use case, and then bring them into Grafana Explore so you can dive deeper into results and uncover any performance issues in your application.
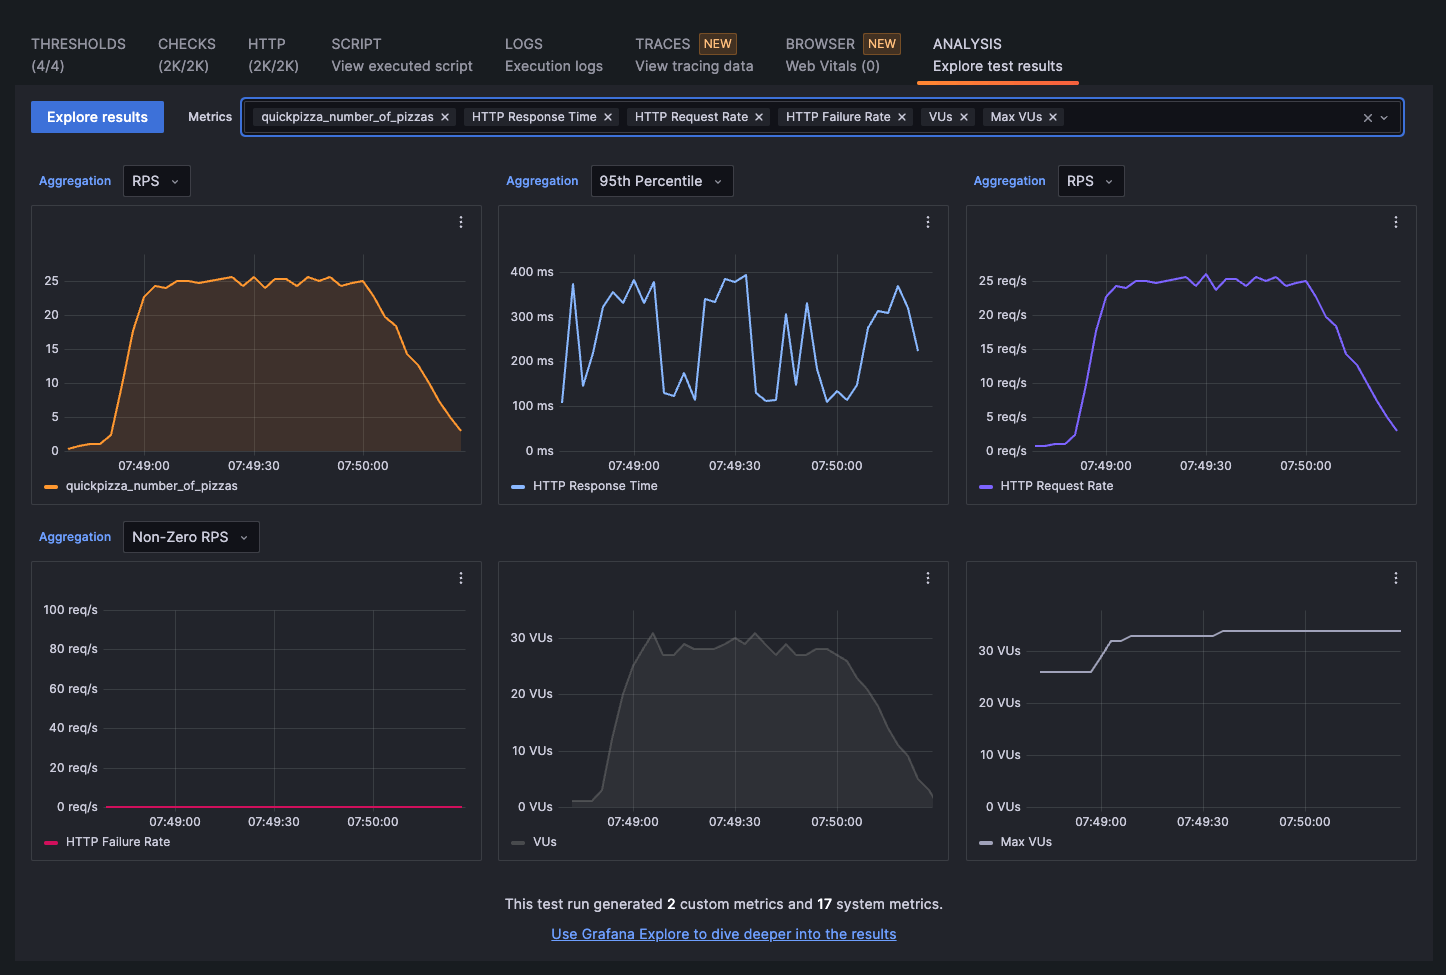
To inspect the metrics from your test run, go to a test result and select the Analysis tab.
The analysis tab is available when inspecting a single test run, and also when comparing test runs.
Add/remove metrics
By default, the analysis tab displays panels for six metrics. In the Metrics field, you can search for any system or custom metrics, and add them to the analysis tab, as well as remove any metrics by selecting the “X” icon next to them.
Add panels to Grafana Explore
You can select the three-dot icon next to each panel to see two options:
- Explore: Displays the selected metric in Grafana Explore, where you can customize any parameters for your query and add it to a dashboard.
- Copy to clipboard: Copies the JSON information for the panel, which you can then add to a Grafana dashboard by opening a dashboard and selecting Add, and Paste panel.

For more information about exploring k6 metrics alongside other system metrics and dashboards, refer to Correlate results in Grafana.


