Menu
Grafana Cloud

Export test results

Your Grafana Cloud k6 test results provide a comprehensive overview of your application performance trends, which can help you detect patterns and uncover performance issues.

You can export your test results in two formats:

  • A Grafana dashboard summary, which can then be exported as a PDF.
  • A CSV file.

Export as Grafana dashboard summary

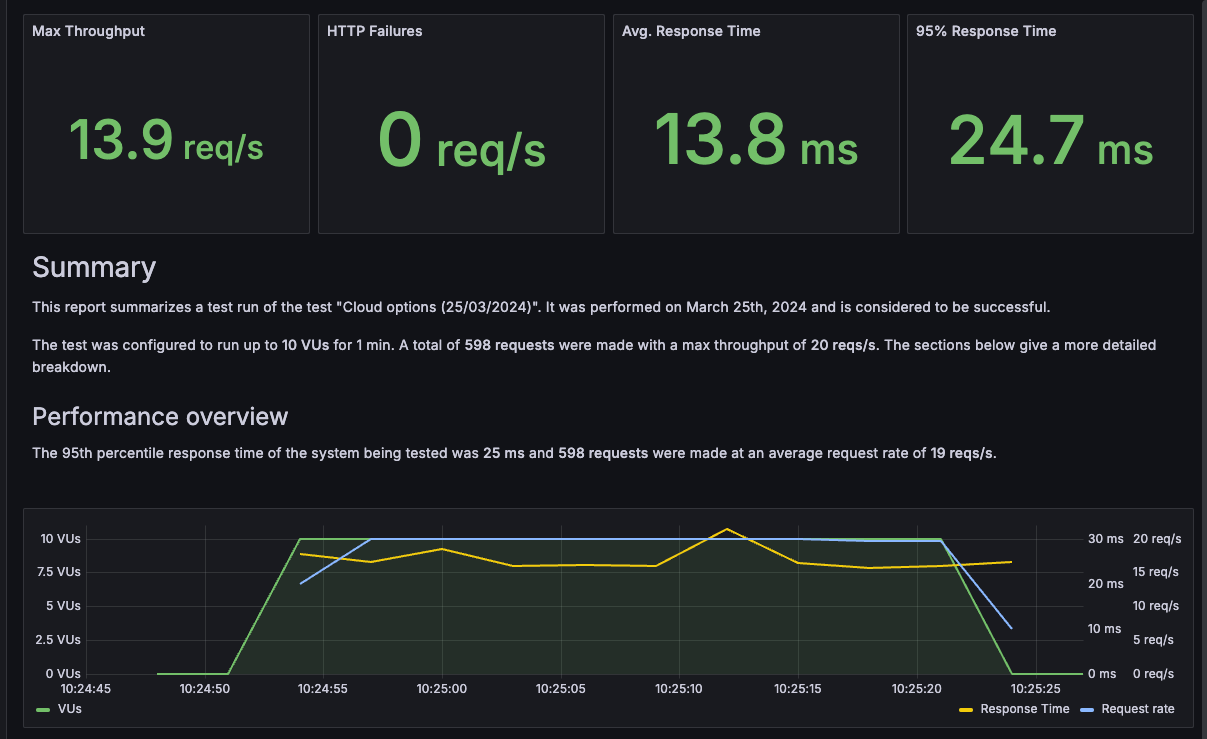
You can export your test results as a dashboard to track and share your data with other team members. The exported dashboard serves as an executive summary of the test results’ most relevant metrics and performance data.

A Grafana dashboard, showing different panels for a Grafana Cloud k6 test result metrics, including HTTP failures, average response time, a summary describing the test was successful, and a performance overview graph.

Before you begin

  • You must have a Grafana Cloud account with the dashboards:create or dashboards:write permission.
    • If you only have the dashboards:create permission, you can only export summaries to the root folder.

For more information, refer to RBAC permissions, actions, and scopes.

Export summary to dashboard

To export a summary:

  1. Navigate to a specific test result.
  2. Click the three-dots icon in the top right corner to open the test results menu.
  3. Select Export summary.

This action opens a dialog box where you can choose a name and destination for the summary and customize its layout.

Choose a folder

Note

You can only see this step if you have the dashboards:write permission.

Creating folders also requires the folders:create permission. If you don’t have permission to create folders, the option to create one won’t appear.

Under Folder, you can select the folder where your dashboard should be created.

You can also create a folder by selecting the Folder field, typing in the new folder name, and selecting Create in a new folder called.

Change layout

The editor includes several sections that you can include or exclude from your summary. Each section represents a time series graph for that metric over the test run time.

To customize the data included in the summary:

  1. Expand the Sections section in the export dialog box.
  2. Select the sections you want to include/exclude.

The sections include:

OptionDescription
Response timeThe response time in different percentiles.
ThroughputThe request rate.
BandwidthThe amount of data sent and received.

Additional options

You can find additional options under Options.

OptionDescription
Include load zonesAdd sections summarizing the test results for each load zone.

Edit summary and share as PDF

After generating the summary dashboard, you can edit and share it like any other dashboard.

For instance, you can share the summary as a PDF by using the PDF export feature in Grafana.

Export as CSV

To export a test result as a CSV file:

  1. Select the test result you want to export.
  2. Click the three-dots icon in the top-right, and select Export data.
    1. If you have already exported the data from a test result, you’ll see a Download export data option instead.
  3. Click Confirm in the dialog box.

Depending on your test result, the CSV export might take some time. You can:

  • Wait for the dialog box to update, and click Download once the report is ready, or;
  • Close the tab and download the report when it’s ready by going to the test result page, clicking the three-dots icon in the top right, and selecting Download export data.

The exported data you can download is a ZIP file that contains a number of CSV files.

Each metric, such as VUs and HTTP requests, has its own separate file. The export also contains a metrics.csv file with the list of exported metrics.

A typical k6 HTTP test includes the following files:

File nameMetricColumns
metrics.csvIndex of exported metricsmetric,type,origin
metric_checks.csvcheckstime,metric,scenario,group,check,load_zone,tags,nz_count,count
metric_data_received.csvdata_receivedtime,metric,scenario,group,load_zone,tags,count
metric_data_sent.csvdata_senttime,metric,scenario,group,load_zone,tags,count
metric_group_duration.csvgroup_durationtime,metric,scenario,group,load_zone,tags,count,min,mean,median,p95,p99,max,stdev
metric_http_reqs.csvhttp_reqstime,metric,group,scenario,name,method,status,expected_response,load_zone,tags,count
metric_http_req_duration.csvhttp_req_durationtime,metric,group,scenario,name,method,status,expected_response,load_zone,tags,count,min,mean,median,p95,p99,max,stdev
metric_iteration_duration.csviteration_durationtime,metric,scenario,group,load_zone,tags,count,min,mean,median,p95,p99,max,stdev
metric_iterations.csviterationstime,metric,scenario,group,load_zone,tags,count
metric_load_generator_ cpu_percent.csvload_generator_cpu_percenttime,metric,scenario,group,load_zone,tags,count,min,mean,max,last
metric_load_generator_ file_handles.csvload_generator_file_handlestime,metric,scenario,group,load_zone,tags,count,min,mean,max,last
metric_load_generator_ memory_used_percent.csvload_generator_memory_used_percenttime,metric,scenario,group,load_zone,tags,count,min,mean,max,last
metric_vus.csvvustime,metric,scenario,group,load_zone,tags,count,min,mean,max,last
metric_vus_max.csvvus_maxtime,metric,scenario,group,load_zone,tags,count,min,mean,max,last
metric_myCustomCounter.csvUser-defined myCustomCounter Countertime,metric,scenario,group,load_zone,tags,count
metric_myCustomGauge.csvUser-defined myCustomGauge Gaugetime,metric,scenario,group,load_zone,tags,count,min,mean,max,last
metric_myCustomRate.csvUser-defined myCustomRate Ratetime,metric,scenario,group,load_zone,tags,nz_count,count
metric_myCustomTrend.csvUser-defined myCustomTrend Trendtime,metric,scenario,group,load_zone,tags,count,min,mean,median,p95,p99,max,stdev

The following table is a reference for the columns in the CSV data, with examples, data types, and descriptions.

ColumnExampleType (unit)Description
time2019-03-25 11:12:48.927949+00:00datetime (UTC)The ISO-8601 timestamp when this data point was captured (when the HTTP request was made).
metrichttp_req_durationstringThe metric name that this data point represents.
group“my group”stringThe group name group() from where this request was made.
scenariodefaultstringThe name of the scenario that this metric was collected in.
urlhttp://test.k6.io/style.cssstringThe URL requested.
methodGETstringThe HTTP method of the request that this data point represents.
status200numberThe HTTP response status code of the request that this data point represents.
count1.0numberNumber of samples that this data point represents (if > 1 response_time is an aggregate value).
load_zoneamazon:us:ashburnstringThe load zone where the requests were sent from.
tags{“staticAsset”:“true”}stringJSON formatted list of {"name": "value"} tags as specified for the request in the script.
min1.008016number (ms)The minimum response time for samples collected within the time bucket.
mean3.008016number (ms)The mean response time for samples collected within the time bucket.
median5.468016number (ms)The median response time for samples collected within the time bucket.
p9510.10816number (ms)The 95th percentile response time for samples collected within the time bucket.
p9914.08016number (ms)The 99th percentile response time for samples collected within the time bucket.
max15.08016number (ms)The maximum response time for samples collected within the time bucket.
stdev0.075112number (ms)The standard deviation time for samples collected within the time bucket.