
MinIO integration for Grafana Cloud
MinIO is a Kubernetes-native high-performance object storage server which is designed for large-scale private cloud infrastructure and compatible with Amazon S3.
This integration includes 2 useful alerts and 1 pre-built dashboard to help monitor and visualize MinIO metrics.
Grafana Alloy configuration
Before you begin
By default, the agent configuration expects the MINIO_PROMETHEUS_AUTH_TYPE to be set to ‘public’.
If you choose not to set this flag you will need to generate a bearer_token with mc admin prometheus generate <alias> command to generate the scrape config compatible with Grafana Alloy. To learn more, see monitoring minio docs.
Install MinIO integration for Grafana Cloud
- In your Grafana Cloud stack, click Connections in the left-hand menu.
- Find MinIO and click its tile to open the integration.
- Review the prerequisites in the Configuration Details tab and set up Grafana Agent to send MinIO metrics to your Grafana Cloud instance.
- Click Install to add this integration’s pre-built dashboard and alerts to your Grafana Cloud instance, and you can start monitoring your MinIO setup.
Configuration snippets for Grafana Alloy
Simple mode
These snippets are configured to scrape a single MinIO instance running locally with default ports.
Copy and paste the following snippets into your Grafana Alloy configuration file.
Metrics snippets
discovery.relabel "metrics_integrations_integrations_minio" {
	targets = [{
		__address__ = "localhost:9000",
	}]

	rule {
		target_label = "instance"
		replacement  = constants.hostname
	}
}

prometheus.scrape "metrics_integrations_integrations_minio" {
	targets      = discovery.relabel.metrics_integrations_integrations_minio.output
	forward_to   = [prometheus.remote_write.metrics_service.receiver]
	job_name     = "integrations/minio"
	metrics_path = "/minio/prometheus/metrics"
}
Advanced mode
The following snippets provide examples to guide you through the configuration process.
To instruct Grafana Alloy to scrape your MinIO instances, copy and paste the snippets to your configuration file and follow subsequent instructions.
Advanced metrics snippets
discovery.relabel "metrics_integrations_integrations_minio" {
	targets = [{
		__address__ = "localhost:9000",
	}]

	rule {
		target_label = "instance"
		replacement  = constants.hostname
	}
}

prometheus.scrape "metrics_integrations_integrations_minio" {
	targets      = discovery.relabel.metrics_integrations_integrations_minio.output
	forward_to   = [prometheus.remote_write.metrics_service.receiver]
	job_name     = "integrations/minio"
	metrics_path = "/minio/prometheus/metrics"
}
To monitor your MinIO instance, you must use a discovery.relabel component to discover your MinIO Prometheus endpoint and apply appropriate labels, followed by a prometheus.scrape component to scrape it.
Configure the following properties within each discovery.relabel component:
__address__: The address to your MinIO Prometheus metrics endpoint.instancelabel:constants.hostnamesets theinstancelabel to your Grafana Alloy server hostname. If that is not suitable, change it to a value uniquely identifies this MinIO instance.
If you have multiple MinIO servers to scrape, configure one discovery.relabel for each and scrape them by including each under targets within the prometheus.scrape component.
Grafana Agent configuration
Before you begin
By default, the agent configuration expects the MINIO_PROMETHEUS_AUTH_TYPE to be set to ‘public’.
If you choose not to set this flag you will need to generate a bearer_token with mc admin prometheus generate <alias> command to generate the scrape config compatible with Grafana agent. To learn more, see monitoring minio docs.
Install MinIO integration for Grafana Cloud
- In your Grafana Cloud stack, click Connections in the left-hand menu.
- Find MinIO and click its tile to open the integration.
- Review the prerequisites in the Configuration Details tab and set up Grafana Agent to send MinIO metrics to your Grafana Cloud instance.
- Click Install to add this integration’s pre-built dashboard and alerts to your Grafana Cloud instance, and you can start monitoring your MinIO setup.
Post-install configuration for the MinIO integration
This integration uses MinIO metrics exposed at /minio/prometheus/metrics endpoint. To scrape it, add the provided snippet to your agent configuration file.
Make sure to change targets in the snippet according to your environment.
Configuration snippets for Grafana Agent
Below metrics.configs.scrape_configs, insert the following lines and change the URLs according to your environment:
    - job_name: 'integrations/minio'
      metrics_path: /minio/prometheus/metrics
      relabel_configs:
        - replacement: '<your-instance-name>'
          target_label: instance
      static_configs:
        - targets: ['localhost:9000']
Full example configuration for Grafana Agent
Refer to the following Grafana Agent configuration for a complete example that contains all the snippets used for the MinIO integration. This example also includes metrics that are sent to monitor your Grafana Agent instance.
integrations:
  prometheus_remote_write:
  - basic_auth:
      password: <your_prom_pass>
      username: <your_prom_user>
    url: <your_prom_url>
  agent:
    enabled: true
    relabel_configs:
    - action: replace
      source_labels:
      - agent_hostname
      target_label: instance
    - action: replace
      target_label: job
      replacement: "integrations/agent-check"
    metric_relabel_configs:
    - action: keep
      regex: (prometheus_target_sync_length_seconds_sum|prometheus_target_scrapes_.*|prometheus_target_interval.*|prometheus_sd_discovered_targets|agent_build.*|agent_wal_samples_appended_total|process_start_time_seconds)
      source_labels:
      - __name__
  # Add here any snippet that belongs to the `integrations` section.
  # For a correct indentation, paste snippets copied from Grafana Cloud at the beginning of the line.
logs:
  configs:
  - clients:
    - basic_auth:
        password: <your_loki_pass>
        username: <your_loki_user>
      url: <your_loki_url>
    name: integrations
    positions:
      filename: /tmp/positions.yaml
    scrape_configs:
      # Add here any snippet that belongs to the `logs.configs.scrape_configs` section.
      # For a correct indentation, paste snippets copied from Grafana Cloud at the beginning of the line.
metrics:
  configs:
  - name: integrations
    remote_write:
    - basic_auth:
        password: <your_prom_pass>
        username: <your_prom_user>
      url: <your_prom_url>
    scrape_configs:
      # Add here any snippet that belongs to the `metrics.configs.scrape_configs` section.
      # For a correct indentation, paste snippets copied from Grafana Cloud at the beginning of the line.
    - job_name: 'integrations/minio'
      metrics_path: /minio/prometheus/metrics
      relabel_configs:
        - replacement: '<your-instance-name>'
          target_label: instance
      static_configs:
        - targets: ['localhost:9000']
  global:
    scrape_interval: 60s
  wal_directory: /tmp/grafana-agent-wal
Dashboards
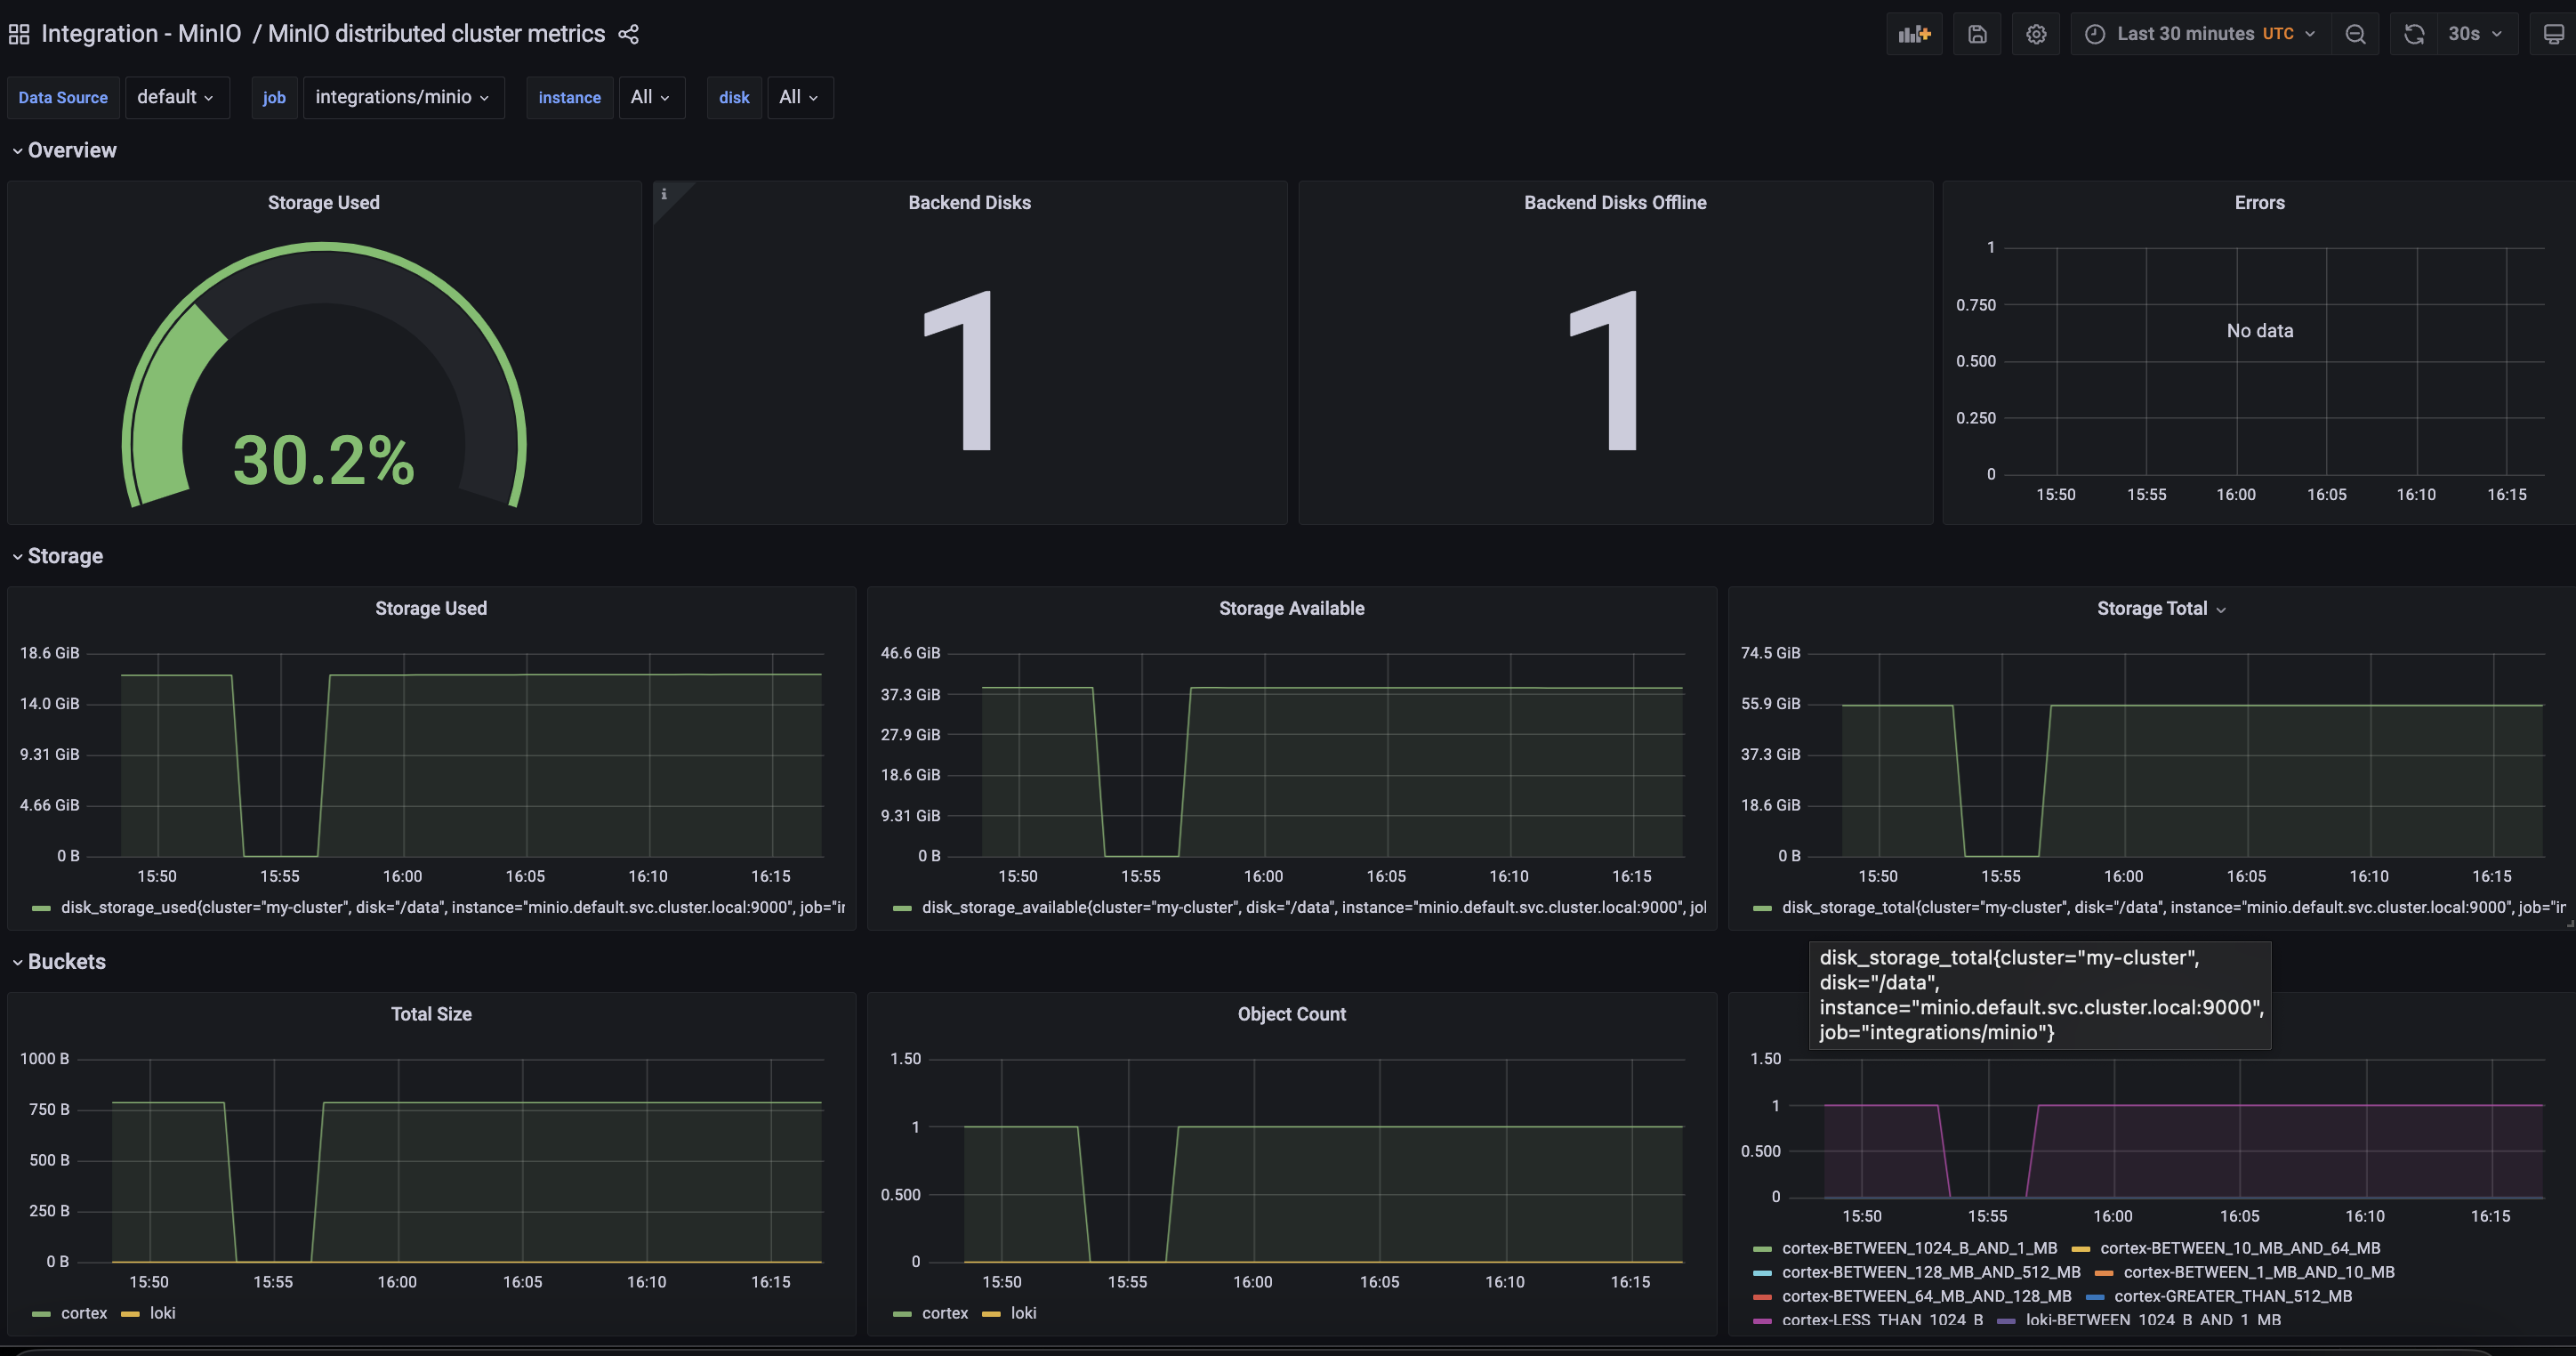
The MinIO integration installs the following dashboards in your Grafana Cloud instance to help monitor your system.
- MinIO distributed cluster metrics
MinIO distributed metrics overview
Alerts
The MinIO integration includes the following useful alerts:
| Alert | Description |
|---|---|
| MinioDisksOffline | Critical: MinIO disks offline. |
| MinioStorageUsed | Warning: MinIO disks high storage used percentage. |
Metrics
The most important metrics provided by the MinIO integration, which are used on the pre-built dashboard and Prometheus alerts, are as follows:
- bucket_objects_count
- bucket_objects_histogram
- bucket_usage_size
- disk_storage_available
- disk_storage_total
- disk_storage_used
- internode_rx_bytes_total
- internode_tx_bytes_total
- minio_disks_offline
- minio_disks_total
- minio_version_info
- s3_errors_total
- s3_requests_total
- s3_ttfb_seconds_bucket
- s3_ttfb_seconds_count
- s3_ttfb_seconds_sum
- up
Changelog
# 0.0.6 - September 2023

* New Filter Metrics option for configuring the Grafana Agent, which saves on metrics cost by dropping any metric not used by this integration. Beware that anything custom built using metrics that are not on the snippet will stop working.
* New hostname relabel option, which applies the instance name you write on the text box to the Grafana Agent configuration snippets, making it easier and less error prone to configure this mandatory label.

# 0.0.5 - May 2023

* Fix query in 'Storage Used' panel

# 0.0.4 - December 2022

* Update mixin to latest
  - Add instance selector
* Add screenshot

# 0.0.3 - September 2022

* Update dashboard panels descriptions.

# 0.0.2 - October 2021

* Update mixin to latest version:
  - Update queries to use $__rate_interval

# 0.0.1 - November 2020

* Initial release
Cost
By connecting your MinIO instance to Grafana Cloud, you might incur charges. To view information on the number of active series that your Grafana Cloud account uses for metrics included in each Cloud tier, see Active series and dpm usage and Cloud tier pricing.
Was this page helpful?
Related resources from Grafana Labs


