
Self-hosted Grafana Mimir integration for Grafana Cloud
Grafana Mimir is an open source software project that provides a scalable long-term storage for Prometheus. Grafana Enterprise Metrics (or GEM) is the enterprise version of Grafana Mimir. You can install both of these products via the Grafana Mimir Helm chart.
This integration comes with dashboards, recording and alerting rules to help monitor the health of your Mimir or GEM cluster as well as understand per-tenant usage and behavior.
Note: an updated version of this integration is available under the Kubernetes App, which makes use of the Grafana Agent Operator, a more automated and easily maintained solution.
This integration includes 73 useful alerts and 25 pre-built dashboards to help monitor and visualize Self-hosted Grafana Mimir metrics and logs.
Grafana Alloy configuration
Before you begin
This integration is primarily targeted on monitoring a Mimir or GEM cluster that has been installed via the Helm chart, but it is also possible to use this integration if Mimir has been deployed another way.
The integration relies on metrics from kube-state-metrics, cAdvisor, and kubelet. Make sure that you have installed and enabled them in your Kubernetes cluster before you begin. Otherwise, some of the dashboards in the
integration will display No data. Some of the dashboards contain panels related to disk usage. These panels rely on node_exporter metrics. To include them, see Additional resources metrics.
If you are using Helm chart version 3.0.0 or higher, you can skip setting up a Grafana Alloy instance, since it is included within the chart. All you will need to do is configure the chart to use the credentials and URLs of your Grafana Cloud Metrics and Logs instances. Please follow the instructions on Collect metrics and logs from the Helm chart. For information about how to create a Grafana Cloud API key, see Create a Grafana Cloud API key.
If you are not using the Helm chart, or are using an older version, follow the instructions on the next step.
Install Self-hosted Grafana Mimir integration for Grafana Cloud
- In your Grafana Cloud stack, click Connections in the left-hand menu.
- Find Self-hosted Grafana Mimir and click its tile to open the integration.
- Review the prerequisites in the Configuration Details tab and set up Grafana Agent to send Self-hosted Grafana Mimir metrics and logs to your Grafana Cloud instance.
- Click Install to add this integration’s pre-built dashboards and alerts to your Grafana Cloud instance, and you can start monitoring your Self-hosted Grafana Mimir setup.
Configuration snippets for Grafana Alloy
Simple mode
These snippets are configured to scrape a single Self-hosted Grafana Mimir instance running locally with default ports.
First, manually copy and append the following snippets into your alloy configuration file.
Metrics snippets
discovery.kubernetes "metrics_integrations_integrations_grafana_mimir_kube_state_metrics" {
	role = "pod"
}

discovery.kubernetes "metrics_integrations_integrations_grafana_mimir_kubelet" {
	role = "node"
}

discovery.kubernetes "metrics_integrations_integrations_grafana_mimir_cadvisor" {
	role = "node"
}

discovery.kubernetes "metrics_integrations_integrations_grafana_mimir_metrics" {
	role = "pod"
}

discovery.relabel "metrics_integrations_integrations_grafana_mimir_kube_state_metrics" {
	targets = discovery.kubernetes.metrics_integrations_integrations_grafana_mimir_kube_state_metrics.targets

	rule {
		source_labels = ["__meta_kubernetes_pod_label_app_kubernetes_io_name"]
		regex         = "kube-state-metrics"
		action        = "keep"
	}

	rule {
		source_labels = ["cluster"]
		separator     = ""
		regex         = ""
		target_label  = "cluster"
		replacement   = "k8s-cluster"
	}
}

discovery.relabel "metrics_integrations_integrations_grafana_mimir_kubelet" {
	targets = discovery.kubernetes.metrics_integrations_integrations_grafana_mimir_kubelet.targets

	rule {
		target_label = "__address__"
		replacement  = "kubernetes.default.svc.cluster.local:443"
	}

	rule {
		source_labels = ["__meta_kubernetes_node_name"]
		regex         = "(.+)"
		target_label  = "__metrics_path__"
		replacement   = "/api/v1/nodes/${1}/proxy/metrics"
	}

	rule {
		source_labels = ["cluster"]
		separator     = ""
		regex         = ""
		target_label  = "cluster"
		replacement   = "k8s-cluster"
	}
}

discovery.relabel "metrics_integrations_integrations_grafana_mimir_cadvisor" {
	targets = discovery.kubernetes.metrics_integrations_integrations_grafana_mimir_cadvisor.targets

	rule {
		target_label = "__address__"
		replacement  = "kubernetes.default.svc.cluster.local:443"
	}

	rule {
		source_labels = ["__meta_kubernetes_node_name"]
		regex         = "(.+)"
		target_label  = "__metrics_path__"
		replacement   = "/api/v1/nodes/${1}/proxy/metrics/cadvisor"
	}

	rule {
		source_labels = ["cluster"]
		separator     = ""
		regex         = ""
		target_label  = "cluster"
		replacement   = "k8s-cluster"
	}
}

discovery.relabel "metrics_integrations_integrations_grafana_mimir_metrics" {
	targets = discovery.kubernetes.metrics_integrations_integrations_grafana_mimir_metrics.targets

	rule {
		source_labels = ["__meta_kubernetes_pod_container_port_name"]
		regex         = ".*metrics"
		action        = "keep"
	}

	rule {
		source_labels = ["__meta_kubernetes_pod_label_helm_sh_chart"]
		regex         = "mimir-distributed-.*"
		action        = "keep"
	}

	rule {
		source_labels = ["cluster"]
		separator     = ""
		regex         = ""
		target_label  = "cluster"
		replacement   = "k8s-cluster"
	}

	rule {
		source_labels = ["__meta_kubernetes_namespace"]
		target_label  = "namespace"
	}

	rule {
		source_labels = ["__meta_kubernetes_pod_name"]
		target_label  = "pod"
	}

	rule {
		source_labels = ["__meta_kubernetes_pod_container_name"]
		target_label  = "container"
	}

	rule {
		source_labels = ["__meta_kubernetes_pod_label_name", "__meta_kubernetes_pod_label_app_kubernetes_io_component"]
		separator     = ""
		target_label  = "__tmp_component_name"
	}

	rule {
		source_labels = ["__meta_kubernetes_pod_node_name"]
		target_label  = "instance"
	}
}

prometheus.scrape "metrics_integrations_integrations_grafana_mimir_kube_state_metrics" {
	targets    = discovery.relabel.metrics_integrations_integrations_grafana_mimir_kube_state_metrics.output
	forward_to = [prometheus.relabel.metrics_integrations_integrations_grafana_mimir_kube_state_metrics.receiver]
	job_name   = "integrations/grafana-mimir/kube-state-metrics"
}

prometheus.scrape "metrics_integrations_integrations_grafana_mimir_kubelet" {
	targets    = discovery.relabel.metrics_integrations_integrations_grafana_mimir_kubelet.output
	forward_to = [prometheus.relabel.metrics_integrations_integrations_grafana_mimir_kubelet.receiver]
	job_name   = "integrations/grafana-mimir/kubelet"
	scheme     = "https"

	authorization {
		type             = "Bearer"
		credentials_file = "/var/run/secrets/kubernetes.io/serviceaccount/token"
	}

	tls_config {
		ca_file     = "/var/run/secrets/kubernetes.io/serviceaccount/ca.crt"
		server_name = "kubernetes"
	}
}

prometheus.scrape "metrics_integrations_integrations_grafana_mimir_cadvisor" {
	targets    = discovery.relabel.metrics_integrations_integrations_grafana_mimir_cadvisor.output
	forward_to = [prometheus.relabel.metrics_integrations_integrations_grafana_mimir_cadvisor.receiver]
	job_name   = "integrations/grafana-mimir/cadvisor"
	scheme     = "https"

	authorization {
		type             = "Bearer"
		credentials_file = "/var/run/secrets/kubernetes.io/serviceaccount/token"
	}

	tls_config {
		ca_file     = "/var/run/secrets/kubernetes.io/serviceaccount/ca.crt"
		server_name = "kubernetes"
	}
}

prometheus.scrape "metrics_integrations_integrations_grafana_mimir_metrics" {
	targets    = discovery.relabel.metrics_integrations_integrations_grafana_mimir_metrics.output
	forward_to = [prometheus.remote_write.metrics_service.receiver]
	job_name   = "integrations/grafana-mimir/metrics"
}

prometheus.relabel "metrics_integrations_integrations_grafana_mimir_kube_state_metrics" {
	forward_to = [prometheus.remote_write.metrics_service.receiver]

	rule {
		source_labels = ["deployment", "statefulset", "pod"]
		separator     = ""
		regex         = "(.*mimir-)?alertmanager.*|(.*mimir-)?alertmanager-im.*|(.*mimir-)?(query-scheduler|ruler-query-scheduler|ruler|store-gateway|compactor|alertmanager|overrides-exporter|mimir-backend).*|(.*mimir-)?compactor.*|(.*mimir-)?distributor.*|(.*mimir-)?(gateway|cortex-gw|cortex-gw-internal).*|(.*mimir-)?ingester.*|(.*mimir-)?mimir-backend.*|(.*mimir-)?mimir-read.*|(.*mimir-)?mimir-write.*|(.*mimir-)?overrides-exporter.*|(.*mimir-)?querier.*|(.*mimir-)?query-frontend.*|(.*mimir-)?query-scheduler.*|(.*mimir-)?(query-frontend|querier|ruler-query-frontend|ruler-querier|mimir-read).*|(.*mimir-)?ruler.*|(.*mimir-)?ruler-querier.*|(.*mimir-)?ruler-query-frontend.*|(.*mimir-)?ruler-query-scheduler.*|(.*mimir-)?store-gateway.*|(.*mimir-)?(distributor|ingester|mimir-write).*"
		action        = "keep"
	}
}

prometheus.relabel "metrics_integrations_integrations_grafana_mimir_kubelet" {
	forward_to = [prometheus.remote_write.metrics_service.receiver]

	rule {
		source_labels = ["__name__"]
		regex         = "kubelet_volume_stats.*"
		action        = "keep"
	}
}

prometheus.relabel "metrics_integrations_integrations_grafana_mimir_cadvisor" {
	forward_to = [prometheus.remote_write.metrics_service.receiver]

	rule {
		source_labels = ["pod"]
		regex         = "(.*mimir-)?alertmanager.*|(.*mimir-)?alertmanager-im.*|(.*mimir-)?(query-scheduler|ruler-query-scheduler|ruler|store-gateway|compactor|alertmanager|overrides-exporter|mimir-backend).*|(.*mimir-)?compactor.*|(.*mimir-)?distributor.*|(.*mimir-)?(gateway|cortex-gw|cortex-gw-internal).*|(.*mimir-)?ingester.*|(.*mimir-)?mimir-backend.*|(.*mimir-)?mimir-read.*|(.*mimir-)?mimir-write.*|(.*mimir-)?overrides-exporter.*|(.*mimir-)?querier.*|(.*mimir-)?query-frontend.*|(.*mimir-)?query-scheduler.*|(.*mimir-)?(query-frontend|querier|ruler-query-frontend|ruler-querier|mimir-read).*|(.*mimir-)?ruler.*|(.*mimir-)?ruler-querier.*|(.*mimir-)?ruler-query-frontend.*|(.*mimir-)?ruler-query-scheduler.*|(.*mimir-)?store-gateway.*|(.*mimir-)?(distributor|ingester|mimir-write).*"
		action        = "keep"
	}
}
Logs snippets
linux
discovery.kubernetes "logs_integrations_integrations_grafana_mimir_logs" {
	role = "pod"
}

discovery.relabel "logs_integrations_integrations_grafana_mimir_logs" {
	targets = discovery.kubernetes.logs_integrations_integrations_grafana_mimir_logs.targets

	rule {
		source_labels = ["__meta_kubernetes_pod_label_helm_sh_chart"]
		regex         = "mimir-distributed-.*"
		action        = "keep"
	}

	rule {
		source_labels = ["__meta_kubernetes_pod_node_name"]
		target_label  = "__host__"
	}

	rule {
		source_labels = ["__meta_kubernetes_namespace", "__meta_kubernetes_pod_container_name"]
		separator     = "/"
		target_label  = "job"
	}

	rule {
		source_labels = ["cluster"]
		separator     = ""
		regex         = ""
		target_label  = "cluster"
		replacement   = "k8s-cluster"
	}

	rule {
		source_labels = ["__meta_kubernetes_namespace"]
		target_label  = "namespace"
	}

	rule {
		source_labels = ["__meta_kubernetes_pod_name"]
		target_label  = "pod"
	}

	rule {
		source_labels = ["__meta_kubernetes_pod_container_name"]
		target_label  = "name"
	}

	rule {
		source_labels = ["__meta_kubernetes_pod_container_name"]
		target_label  = "container"
	}

	rule {
		source_labels = ["__meta_kubernetes_pod_uid", "__meta_kubernetes_pod_container_name"]
		separator     = "/"
		target_label  = "__path__"
		replacement   = "/var/log/pods/*$1/*.log"
	}
}

local.file_match "logs_integrations_integrations_grafana_mimir_logs" {
	path_targets = discovery.relabel.logs_integrations_integrations_grafana_mimir_logs.output
}

loki.process "logs_integrations_integrations_grafana_mimir_logs" {
	forward_to = [loki.write.grafana_cloud_loki.receiver]

	stage.cri { }
}

loki.source.file "logs_integrations_integrations_grafana_mimir_logs" {
	targets    = local.file_match.logs_integrations_integrations_grafana_mimir_logs.targets
	forward_to = [loki.process.logs_integrations_integrations_grafana_mimir_logs.receiver]
}
Advanced mode
The following snippets provide examples to guide you through the configuration process.
To instruct Grafana Alloy to scrape your Self-hosted Grafana Mimir instances, manually copy and append the snippets to your alloy configuration file, then follow subsequent instructions.
Advanced metrics snippets
discovery.kubernetes "metrics_integrations_integrations_grafana_mimir_kube_state_metrics" {
	role = "pod"
}

discovery.kubernetes "metrics_integrations_integrations_grafana_mimir_kubelet" {
	role = "node"
}

discovery.kubernetes "metrics_integrations_integrations_grafana_mimir_cadvisor" {
	role = "node"
}

discovery.kubernetes "metrics_integrations_integrations_grafana_mimir_metrics" {
	role = "pod"
}

discovery.relabel "metrics_integrations_integrations_grafana_mimir_kube_state_metrics" {
	targets = discovery.kubernetes.metrics_integrations_integrations_grafana_mimir_kube_state_metrics.targets

	rule {
		source_labels = ["__meta_kubernetes_pod_label_app_kubernetes_io_name"]
		regex         = "kube-state-metrics"
		action        = "keep"
	}

	rule {
		source_labels = ["cluster"]
		separator     = ""
		regex         = ""
		target_label  = "cluster"
		replacement   = "k8s-cluster"
	}
}

discovery.relabel "metrics_integrations_integrations_grafana_mimir_kubelet" {
	targets = discovery.kubernetes.metrics_integrations_integrations_grafana_mimir_kubelet.targets

	rule {
		target_label = "__address__"
		replacement  = "kubernetes.default.svc.cluster.local:443"
	}

	rule {
		source_labels = ["__meta_kubernetes_node_name"]
		regex         = "(.+)"
		target_label  = "__metrics_path__"
		replacement   = "/api/v1/nodes/${1}/proxy/metrics"
	}

	rule {
		source_labels = ["cluster"]
		separator     = ""
		regex         = ""
		target_label  = "cluster"
		replacement   = "k8s-cluster"
	}
}

discovery.relabel "metrics_integrations_integrations_grafana_mimir_cadvisor" {
	targets = discovery.kubernetes.metrics_integrations_integrations_grafana_mimir_cadvisor.targets

	rule {
		target_label = "__address__"
		replacement  = "kubernetes.default.svc.cluster.local:443"
	}

	rule {
		source_labels = ["__meta_kubernetes_node_name"]
		regex         = "(.+)"
		target_label  = "__metrics_path__"
		replacement   = "/api/v1/nodes/${1}/proxy/metrics/cadvisor"
	}

	rule {
		source_labels = ["cluster"]
		separator     = ""
		regex         = ""
		target_label  = "cluster"
		replacement   = "k8s-cluster"
	}
}

discovery.relabel "metrics_integrations_integrations_grafana_mimir_metrics" {
	targets = discovery.kubernetes.metrics_integrations_integrations_grafana_mimir_metrics.targets

	rule {
		source_labels = ["__meta_kubernetes_pod_container_port_name"]
		regex         = ".*metrics"
		action        = "keep"
	}

	rule {
		source_labels = ["__meta_kubernetes_pod_label_helm_sh_chart"]
		regex         = "mimir-distributed-.*"
		action        = "keep"
	}

	rule {
		source_labels = ["cluster"]
		separator     = ""
		regex         = ""
		target_label  = "cluster"
		replacement   = "k8s-cluster"
	}

	rule {
		source_labels = ["__meta_kubernetes_namespace"]
		target_label  = "namespace"
	}

	rule {
		source_labels = ["__meta_kubernetes_pod_name"]
		target_label  = "pod"
	}

	rule {
		source_labels = ["__meta_kubernetes_pod_container_name"]
		target_label  = "container"
	}

	rule {
		source_labels = ["__meta_kubernetes_pod_label_name", "__meta_kubernetes_pod_label_app_kubernetes_io_component"]
		separator     = ""
		target_label  = "__tmp_component_name"
	}

	rule {
		source_labels = ["__meta_kubernetes_pod_node_name"]
		target_label  = "instance"
	}
}

prometheus.scrape "metrics_integrations_integrations_grafana_mimir_kube_state_metrics" {
	targets    = discovery.relabel.metrics_integrations_integrations_grafana_mimir_kube_state_metrics.output
	forward_to = [prometheus.relabel.metrics_integrations_integrations_grafana_mimir_kube_state_metrics.receiver]
	job_name   = "integrations/grafana-mimir/kube-state-metrics"
}

prometheus.scrape "metrics_integrations_integrations_grafana_mimir_kubelet" {
	targets    = discovery.relabel.metrics_integrations_integrations_grafana_mimir_kubelet.output
	forward_to = [prometheus.relabel.metrics_integrations_integrations_grafana_mimir_kubelet.receiver]
	job_name   = "integrations/grafana-mimir/kubelet"
	scheme     = "https"

	authorization {
		type             = "Bearer"
		credentials_file = "/var/run/secrets/kubernetes.io/serviceaccount/token"
	}

	tls_config {
		ca_file     = "/var/run/secrets/kubernetes.io/serviceaccount/ca.crt"
		server_name = "kubernetes"
	}
}

prometheus.scrape "metrics_integrations_integrations_grafana_mimir_cadvisor" {
	targets    = discovery.relabel.metrics_integrations_integrations_grafana_mimir_cadvisor.output
	forward_to = [prometheus.relabel.metrics_integrations_integrations_grafana_mimir_cadvisor.receiver]
	job_name   = "integrations/grafana-mimir/cadvisor"
	scheme     = "https"

	authorization {
		type             = "Bearer"
		credentials_file = "/var/run/secrets/kubernetes.io/serviceaccount/token"
	}

	tls_config {
		ca_file     = "/var/run/secrets/kubernetes.io/serviceaccount/ca.crt"
		server_name = "kubernetes"
	}
}

prometheus.scrape "metrics_integrations_integrations_grafana_mimir_metrics" {
	targets    = discovery.relabel.metrics_integrations_integrations_grafana_mimir_metrics.output
	forward_to = [prometheus.remote_write.metrics_service.receiver]
	job_name   = "integrations/grafana-mimir/metrics"
}

prometheus.relabel "metrics_integrations_integrations_grafana_mimir_kube_state_metrics" {
	forward_to = [prometheus.remote_write.metrics_service.receiver]

	rule {
		source_labels = ["deployment", "statefulset", "pod"]
		separator     = ""
		regex         = "(.*mimir-)?alertmanager.*|(.*mimir-)?alertmanager-im.*|(.*mimir-)?(query-scheduler|ruler-query-scheduler|ruler|store-gateway|compactor|alertmanager|overrides-exporter|mimir-backend).*|(.*mimir-)?compactor.*|(.*mimir-)?distributor.*|(.*mimir-)?(gateway|cortex-gw|cortex-gw-internal).*|(.*mimir-)?ingester.*|(.*mimir-)?mimir-backend.*|(.*mimir-)?mimir-read.*|(.*mimir-)?mimir-write.*|(.*mimir-)?overrides-exporter.*|(.*mimir-)?querier.*|(.*mimir-)?query-frontend.*|(.*mimir-)?query-scheduler.*|(.*mimir-)?(query-frontend|querier|ruler-query-frontend|ruler-querier|mimir-read).*|(.*mimir-)?ruler.*|(.*mimir-)?ruler-querier.*|(.*mimir-)?ruler-query-frontend.*|(.*mimir-)?ruler-query-scheduler.*|(.*mimir-)?store-gateway.*|(.*mimir-)?(distributor|ingester|mimir-write).*"
		action        = "keep"
	}
}

prometheus.relabel "metrics_integrations_integrations_grafana_mimir_kubelet" {
	forward_to = [prometheus.remote_write.metrics_service.receiver]

	rule {
		source_labels = ["__name__"]
		regex         = "kubelet_volume_stats.*"
		action        = "keep"
	}
}

prometheus.relabel "metrics_integrations_integrations_grafana_mimir_cadvisor" {
	forward_to = [prometheus.remote_write.metrics_service.receiver]

	rule {
		source_labels = ["pod"]
		regex         = "(.*mimir-)?alertmanager.*|(.*mimir-)?alertmanager-im.*|(.*mimir-)?(query-scheduler|ruler-query-scheduler|ruler|store-gateway|compactor|alertmanager|overrides-exporter|mimir-backend).*|(.*mimir-)?compactor.*|(.*mimir-)?distributor.*|(.*mimir-)?(gateway|cortex-gw|cortex-gw-internal).*|(.*mimir-)?ingester.*|(.*mimir-)?mimir-backend.*|(.*mimir-)?mimir-read.*|(.*mimir-)?mimir-write.*|(.*mimir-)?overrides-exporter.*|(.*mimir-)?querier.*|(.*mimir-)?query-frontend.*|(.*mimir-)?query-scheduler.*|(.*mimir-)?(query-frontend|querier|ruler-query-frontend|ruler-querier|mimir-read).*|(.*mimir-)?ruler.*|(.*mimir-)?ruler-querier.*|(.*mimir-)?ruler-query-frontend.*|(.*mimir-)?ruler-query-scheduler.*|(.*mimir-)?store-gateway.*|(.*mimir-)?(distributor|ingester|mimir-write).*"
		action        = "keep"
	}
}
To monitor your Self-hosted Grafana Mimir instance, you must use a discovery.relabel component to discover your Self-hosted Grafana Mimir Prometheus endpoint and apply appropriate labels, followed by a prometheus.scrape component to scrape it.
Configure the following properties within each discovery.relabel component:
__address__: The address to your Self-hosted Grafana Mimir Prometheus metrics endpoint.instancelabel:constants.hostnamesets theinstancelabel to your Grafana Alloy server hostname. If that is not suitable, change it to a value uniquely identifies this Self-hosted Grafana Mimir instance. Make sure this label value is the same for all telemetry data collected for this instance.cluster: Theclusterlabel to group your Self-hosted Grafana Mimir instances within a cluster. Set the same value for all nodes within your cluster.
If you have multiple Self-hosted Grafana Mimir servers to scrape, configure one discovery.relabel for each and scrape them by including each under targets within the prometheus.scrape component.
Advanced logs snippets
linux
discovery.kubernetes "logs_integrations_integrations_grafana_mimir_logs" {
	role = "pod"
}

discovery.relabel "logs_integrations_integrations_grafana_mimir_logs" {
	targets = discovery.kubernetes.logs_integrations_integrations_grafana_mimir_logs.targets

	rule {
		source_labels = ["__meta_kubernetes_pod_label_helm_sh_chart"]
		regex         = "mimir-distributed-.*"
		action        = "keep"
	}

	rule {
		source_labels = ["__meta_kubernetes_pod_node_name"]
		target_label  = "__host__"
	}

	rule {
		source_labels = ["__meta_kubernetes_namespace", "__meta_kubernetes_pod_container_name"]
		separator     = "/"
		target_label  = "job"
	}

	rule {
		source_labels = ["cluster"]
		separator     = ""
		regex         = ""
		target_label  = "cluster"
		replacement   = "k8s-cluster"
	}

	rule {
		source_labels = ["__meta_kubernetes_namespace"]
		target_label  = "namespace"
	}

	rule {
		source_labels = ["__meta_kubernetes_pod_name"]
		target_label  = "pod"
	}

	rule {
		source_labels = ["__meta_kubernetes_pod_container_name"]
		target_label  = "name"
	}

	rule {
		source_labels = ["__meta_kubernetes_pod_container_name"]
		target_label  = "container"
	}

	rule {
		source_labels = ["__meta_kubernetes_pod_uid", "__meta_kubernetes_pod_container_name"]
		separator     = "/"
		target_label  = "__path__"
		replacement   = "/var/log/pods/*$1/*.log"
	}
}

local.file_match "logs_integrations_integrations_grafana_mimir_logs" {
	path_targets = discovery.relabel.logs_integrations_integrations_grafana_mimir_logs.output
}

loki.process "logs_integrations_integrations_grafana_mimir_logs" {
	forward_to = [loki.write.grafana_cloud_loki.receiver]

	stage.cri { }
}

loki.source.file "logs_integrations_integrations_grafana_mimir_logs" {
	targets    = local.file_match.logs_integrations_integrations_grafana_mimir_logs.targets
	forward_to = [loki.process.logs_integrations_integrations_grafana_mimir_logs.receiver]
}
To monitor your Self-hosted Grafana Mimir instance logs, you will use a combination of the following components:
- local.file_match defines where to find the log file to be scraped. Change the following properties according to your environment:
__address__: The Self-hosted Grafana Mimir instance address__path__: The path to the log file.instancelabel:constants.hostnamesets theinstancelabel to your Grafana Alloy server hostname. If that is not suitable, change it to a value uniquely identifies this Self-hosted Grafana Mimir instance. Make sure this label value is the same for all telemetry data collected for this instance.cluster: Theclusterlabel to group your Self-hosted Grafana Mimir instances within a cluster. Set the same value for all nodes within your cluster.
- loki.process defines how to process logs before sending it to Loki.
- discovery.relabel defines any relabeling needed before sending logs to Loki.
- loki.source.file sends logs to Loki.
Grafana Agent configuration
Before you begin
This integration is primarily targeted on monitoring a Mimir or GEM cluster that has been installed via the Helm chart, but it is also possible to use this integration if Mimir has been deployed another way.
The integration relies on metrics from kube-state-metrics, cAdvisor, and kubelet. Make sure that you have installed and enabled them in your Kubernetes cluster before you begin. Otherwise, some of the dashboards in the
integration will display No data. Some of the dashboards contain panels related to disk usage. These panels rely on node_exporter metrics. To include them, see Additional resources metrics.
If you are using Helm chart version 3.0.0 or higher, you can skip setting up a Grafana Agent instance, since it is included within the chart. All you will need to do is configure the chart to use the credentials and URLs of your Grafana Cloud Metrics and Logs instances. Please follow the instructions on Collect metrics and logs from the Helm chart. For information about how to create a Grafana Cloud API key, see Create a Grafana Cloud API key.
If you are not using the Helm chart, or are using an older version, follow the instructions on the next step.
Install Self-hosted Grafana Mimir integration for Grafana Cloud
- In your Grafana Cloud stack, click Connections in the left-hand menu.
- Find Self-hosted Grafana Mimir and click its tile to open the integration.
- Review the prerequisites in the Configuration Details tab and set up Grafana Agent to send Self-hosted Grafana Mimir metrics and logs to your Grafana Cloud instance.
- Click Install to add this integration’s pre-built dashboards and alerts to your Grafana Cloud instance, and you can start monitoring your Self-hosted Grafana Mimir setup.
Post-install configuration for the Self-hosted Grafana Mimir integration
Please follow the instructions on Collect metrics and logs without the Helm chart if you are using a Helm chart version older than v3.0.0, or deployed Mimir without the Helm chart. The provided snippets are based on the ones present in this documentation, and might need updating.
Configuration snippets for Grafana Agent
Below metrics.configs.scrape_configs, insert the following lines and change the URLs according to your environment:
    - job_name: integrations/grafana-mimir/kube-state-metrics
      kubernetes_sd_configs:
        - role: pod
      relabel_configs:
        - source_labels: [__meta_kubernetes_pod_label_app_kubernetes_io_name]
          action: keep
          regex: kube-state-metrics
        - action: replace # Replace the cluster label if it isn't present already
          regex: ""
          replacement: k8s-cluster
          separator: ""
          source_labels:
            - cluster
          target_label: cluster
      metric_relabel_configs:
        - regex: '(.*mimir-)?alertmanager.*|(.*mimir-)?alertmanager-im.*|(.*mimir-)?(query-scheduler|ruler-query-scheduler|ruler|store-gateway|compactor|alertmanager|overrides-exporter|mimir-backend).*|(.*mimir-)?compactor.*|(.*mimir-)?distributor.*|(.*mimir-)?(gateway|cortex-gw|cortex-gw-internal).*|(.*mimir-)?ingester.*|(.*mimir-)?mimir-backend.*|(.*mimir-)?mimir-read.*|(.*mimir-)?mimir-write.*|(.*mimir-)?overrides-exporter.*|(.*mimir-)?querier.*|(.*mimir-)?query-frontend.*|(.*mimir-)?query-scheduler.*|(.*mimir-)?(query-frontend|querier|ruler-query-frontend|ruler-querier|mimir-read).*|(.*mimir-)?ruler.*|(.*mimir-)?ruler-querier.*|(.*mimir-)?ruler-query-frontend.*|(.*mimir-)?ruler-query-scheduler.*|(.*mimir-)?store-gateway.*|(.*mimir-)?(distributor|ingester|mimir-write).*'
          action: keep
          separator: ''
          source_labels: [ deployment, statefulset, pod ]
    - job_name: integrations/grafana-mimir/kubelet
      bearer_token_file: /var/run/secrets/kubernetes.io/serviceaccount/token
      kubernetes_sd_configs:
        - role: node
      relabel_configs:
        - replacement: kubernetes.default.svc.cluster.local:443
          target_label: __address__
        - regex: (.+)
          replacement: /api/v1/nodes/${1}/proxy/metrics
          source_labels:
            - __meta_kubernetes_node_name
          target_label: __metrics_path__
        - action: replace # Replace the cluster label if it isn't present already
          regex: ""
          replacement: k8s-cluster
          separator: ""
          source_labels:
            - cluster
          target_label: cluster
      metric_relabel_configs:
        - regex: kubelet_volume_stats.*
          action: keep
          source_labels: [ __name__ ]
      scheme: https
      tls_config:
          ca_file: /var/run/secrets/kubernetes.io/serviceaccount/ca.crt
          insecure_skip_verify: false
          server_name: kubernetes
    - job_name: integrations/grafana-mimir/cadvisor
      bearer_token_file: /var/run/secrets/kubernetes.io/serviceaccount/token
      kubernetes_sd_configs:
        - role: node
      relabel_configs:
        - replacement: kubernetes.default.svc.cluster.local:443
          target_label: __address__
        - regex: (.+)
          replacement: /api/v1/nodes/${1}/proxy/metrics/cadvisor
          source_labels:
            - __meta_kubernetes_node_name
          target_label: __metrics_path__
        - action: replace # Replace the cluster label if it isn't present already
          regex: ""
          replacement: k8s-cluster
          separator: ""
          source_labels:
            - cluster
          target_label: cluster
      metric_relabel_configs:
        - regex: '(.*mimir-)?alertmanager.*|(.*mimir-)?alertmanager-im.*|(.*mimir-)?(query-scheduler|ruler-query-scheduler|ruler|store-gateway|compactor|alertmanager|overrides-exporter|mimir-backend).*|(.*mimir-)?compactor.*|(.*mimir-)?distributor.*|(.*mimir-)?(gateway|cortex-gw|cortex-gw-internal).*|(.*mimir-)?ingester.*|(.*mimir-)?mimir-backend.*|(.*mimir-)?mimir-read.*|(.*mimir-)?mimir-write.*|(.*mimir-)?overrides-exporter.*|(.*mimir-)?querier.*|(.*mimir-)?query-frontend.*|(.*mimir-)?query-scheduler.*|(.*mimir-)?(query-frontend|querier|ruler-query-frontend|ruler-querier|mimir-read).*|(.*mimir-)?ruler.*|(.*mimir-)?ruler-querier.*|(.*mimir-)?ruler-query-frontend.*|(.*mimir-)?ruler-query-scheduler.*|(.*mimir-)?store-gateway.*|(.*mimir-)?(distributor|ingester|mimir-write).*'
          action: keep
          source_labels: [ pod ]
      scheme: https
      tls_config:
        ca_file: /var/run/secrets/kubernetes.io/serviceaccount/ca.crt
        insecure_skip_verify: false
        server_name: kubernetes
    - job_name: integrations/grafana-mimir/metrics
      kubernetes_sd_configs:
        - role: pod
      relabel_configs:
        # The mimir-distributed Helm chart names all ports which expose a /metrics endpoint with the 'metrics' suffix, so we keep only those targets.
        - regex: .*metrics
          action: keep
          source_labels:
            - __meta_kubernetes_pod_container_port_name
        # Keep only targets which are a part of the expected Helm chart
        - action: keep
          regex: mimir-distributed-.*
          source_labels:
            - __meta_kubernetes_pod_label_helm_sh_chart
        # The following labels are required to ensure the pre-built dashboards are fully functional later.
        - action: replace  # Replace the cluster label if it isn't present already
          regex: ""
          replacement: k8s-cluster
          separator: ""
          source_labels:
            - cluster
          target_label: cluster
        - action: replace
          source_labels:
            - __meta_kubernetes_namespace
          target_label: namespace
        - action: replace
          source_labels:
            - __meta_kubernetes_pod_name
          target_label: pod
        - action: replace
          source_labels:
            - __meta_kubernetes_pod_container_name
          target_label: container
        - action: replace
          separator: ""
          source_labels:
            - __meta_kubernetes_pod_label_name
            - __meta_kubernetes_pod_label_app_kubernetes_io_component
          target_label: __tmp_component_name
        - action: replace
          source_labels:
            - __meta_kubernetes_pod_node_name
          target_label: instance
Below logs.configs.scrape_configs, insert the following lines according to your environment.
    - job_name: integrations/grafana-mimir-logs
      kubernetes_sd_configs:
        - role: pod
      pipeline_stages:
        - cri: {}
      relabel_configs:
        - action: keep
          regex: mimir-distributed-.*
          source_labels:
            - __meta_kubernetes_pod_label_helm_sh_chart
        - source_labels:
            - __meta_kubernetes_pod_node_name
          target_label: __host__
        - action: replace
          replacement: $1
          separator: /
          source_labels:
            - __meta_kubernetes_namespace
            - __meta_kubernetes_pod_container_name
          target_label: job
        - action: replace # Replace the cluster label if it isn't present already
          regex: ''
          replacement: k8s-cluster
          separator: ''
          source_labels:
            - cluster
          target_label: cluster
        - action: replace
          source_labels:
            - __meta_kubernetes_namespace
          target_label: namespace
        - action: replace
          source_labels:
            - __meta_kubernetes_pod_name
          target_label: pod
        - action: replace # Necessary for slow queries dashboard
          source_labels:
            - __meta_kubernetes_pod_container_name
          target_label: name
        - action: replace # Not actually necessary, here for consistency with metrics
          source_labels:
            - __meta_kubernetes_pod_container_name
          target_label: container
        - replacement: /var/log/pods/*$1/*.log
          separator: /
          source_labels:
            - __meta_kubernetes_pod_uid
            - __meta_kubernetes_pod_container_name
          target_label: __path__
Full example configuration for Grafana Agent
Refer to the following Grafana Agent configuration for a complete example that contains all the snippets used for the Self-hosted Grafana Mimir integration. This example also includes metrics that are sent to monitor your Grafana Agent instance.
integrations:
  prometheus_remote_write:
  - basic_auth:
      password: <your_prom_pass>
      username: <your_prom_user>
    url: <your_prom_url>
  agent:
    enabled: true
    relabel_configs:
    - action: replace
      source_labels:
      - agent_hostname
      target_label: instance
    - action: replace
      target_label: job
      replacement: "integrations/agent-check"
    metric_relabel_configs:
    - action: keep
      regex: (prometheus_target_sync_length_seconds_sum|prometheus_target_scrapes_.*|prometheus_target_interval.*|prometheus_sd_discovered_targets|agent_build.*|agent_wal_samples_appended_total|process_start_time_seconds)
      source_labels:
      - __name__
  # Add here any snippet that belongs to the `integrations` section.
  # For a correct indentation, paste snippets copied from Grafana Cloud at the beginning of the line.
logs:
  configs:
  - clients:
    - basic_auth:
        password: <your_loki_pass>
        username: <your_loki_user>
      url: <your_loki_url>
    name: integrations
    positions:
      filename: /tmp/positions.yaml
    scrape_configs:
      # Add here any snippet that belongs to the `logs.configs.scrape_configs` section.
      # For a correct indentation, paste snippets copied from Grafana Cloud at the beginning of the line.
    - job_name: integrations/grafana-mimir-logs
      kubernetes_sd_configs:
        - role: pod
      pipeline_stages:
        - cri: {}
      relabel_configs:
        - action: keep
          regex: mimir-distributed-.*
          source_labels:
            - __meta_kubernetes_pod_label_helm_sh_chart
        - source_labels:
            - __meta_kubernetes_pod_node_name
          target_label: __host__
        - action: replace
          replacement: $1
          separator: /
          source_labels:
            - __meta_kubernetes_namespace
            - __meta_kubernetes_pod_container_name
          target_label: job
        - action: replace # Replace the cluster label if it isn't present already
          regex: ''
          replacement: k8s-cluster
          separator: ''
          source_labels:
            - cluster
          target_label: cluster
        - action: replace
          source_labels:
            - __meta_kubernetes_namespace
          target_label: namespace
        - action: replace
          source_labels:
            - __meta_kubernetes_pod_name
          target_label: pod
        - action: replace # Necessary for slow queries dashboard
          source_labels:
            - __meta_kubernetes_pod_container_name
          target_label: name
        - action: replace # Not actually necessary, here for consistency with metrics
          source_labels:
            - __meta_kubernetes_pod_container_name
          target_label: container
        - replacement: /var/log/pods/*$1/*.log
          separator: /
          source_labels:
            - __meta_kubernetes_pod_uid
            - __meta_kubernetes_pod_container_name
          target_label: __path__
metrics:
  configs:
  - name: integrations
    remote_write:
    - basic_auth:
        password: <your_prom_pass>
        username: <your_prom_user>
      url: <your_prom_url>
    scrape_configs:
      # Add here any snippet that belongs to the `metrics.configs.scrape_configs` section.
      # For a correct indentation, paste snippets copied from Grafana Cloud at the beginning of the line.
    - job_name: integrations/grafana-mimir/kube-state-metrics
      kubernetes_sd_configs:
        - role: pod
      relabel_configs:
        - source_labels: [__meta_kubernetes_pod_label_app_kubernetes_io_name]
          action: keep
          regex: kube-state-metrics
        - action: replace # Replace the cluster label if it isn't present already
          regex: ""
          replacement: k8s-cluster
          separator: ""
          source_labels:
            - cluster
          target_label: cluster
      metric_relabel_configs:
        - regex: '(.*mimir-)?alertmanager.*|(.*mimir-)?alertmanager-im.*|(.*mimir-)?(query-scheduler|ruler-query-scheduler|ruler|store-gateway|compactor|alertmanager|overrides-exporter|mimir-backend).*|(.*mimir-)?compactor.*|(.*mimir-)?distributor.*|(.*mimir-)?(gateway|cortex-gw|cortex-gw-internal).*|(.*mimir-)?ingester.*|(.*mimir-)?mimir-backend.*|(.*mimir-)?mimir-read.*|(.*mimir-)?mimir-write.*|(.*mimir-)?overrides-exporter.*|(.*mimir-)?querier.*|(.*mimir-)?query-frontend.*|(.*mimir-)?query-scheduler.*|(.*mimir-)?(query-frontend|querier|ruler-query-frontend|ruler-querier|mimir-read).*|(.*mimir-)?ruler.*|(.*mimir-)?ruler-querier.*|(.*mimir-)?ruler-query-frontend.*|(.*mimir-)?ruler-query-scheduler.*|(.*mimir-)?store-gateway.*|(.*mimir-)?(distributor|ingester|mimir-write).*'
          action: keep
          separator: ''
          source_labels: [ deployment, statefulset, pod ]
    - job_name: integrations/grafana-mimir/kubelet
      bearer_token_file: /var/run/secrets/kubernetes.io/serviceaccount/token
      kubernetes_sd_configs:
        - role: node
      relabel_configs:
        - replacement: kubernetes.default.svc.cluster.local:443
          target_label: __address__
        - regex: (.+)
          replacement: /api/v1/nodes/${1}/proxy/metrics
          source_labels:
            - __meta_kubernetes_node_name
          target_label: __metrics_path__
        - action: replace # Replace the cluster label if it isn't present already
          regex: ""
          replacement: k8s-cluster
          separator: ""
          source_labels:
            - cluster
          target_label: cluster
      metric_relabel_configs:
        - regex: kubelet_volume_stats.*
          action: keep
          source_labels: [ __name__ ]
      scheme: https
      tls_config:
          ca_file: /var/run/secrets/kubernetes.io/serviceaccount/ca.crt
          insecure_skip_verify: false
          server_name: kubernetes
    - job_name: integrations/grafana-mimir/cadvisor
      bearer_token_file: /var/run/secrets/kubernetes.io/serviceaccount/token
      kubernetes_sd_configs:
        - role: node
      relabel_configs:
        - replacement: kubernetes.default.svc.cluster.local:443
          target_label: __address__
        - regex: (.+)
          replacement: /api/v1/nodes/${1}/proxy/metrics/cadvisor
          source_labels:
            - __meta_kubernetes_node_name
          target_label: __metrics_path__
        - action: replace # Replace the cluster label if it isn't present already
          regex: ""
          replacement: k8s-cluster
          separator: ""
          source_labels:
            - cluster
          target_label: cluster
      metric_relabel_configs:
        - regex: '(.*mimir-)?alertmanager.*|(.*mimir-)?alertmanager-im.*|(.*mimir-)?(query-scheduler|ruler-query-scheduler|ruler|store-gateway|compactor|alertmanager|overrides-exporter|mimir-backend).*|(.*mimir-)?compactor.*|(.*mimir-)?distributor.*|(.*mimir-)?(gateway|cortex-gw|cortex-gw-internal).*|(.*mimir-)?ingester.*|(.*mimir-)?mimir-backend.*|(.*mimir-)?mimir-read.*|(.*mimir-)?mimir-write.*|(.*mimir-)?overrides-exporter.*|(.*mimir-)?querier.*|(.*mimir-)?query-frontend.*|(.*mimir-)?query-scheduler.*|(.*mimir-)?(query-frontend|querier|ruler-query-frontend|ruler-querier|mimir-read).*|(.*mimir-)?ruler.*|(.*mimir-)?ruler-querier.*|(.*mimir-)?ruler-query-frontend.*|(.*mimir-)?ruler-query-scheduler.*|(.*mimir-)?store-gateway.*|(.*mimir-)?(distributor|ingester|mimir-write).*'
          action: keep
          source_labels: [ pod ]
      scheme: https
      tls_config:
        ca_file: /var/run/secrets/kubernetes.io/serviceaccount/ca.crt
        insecure_skip_verify: false
        server_name: kubernetes
    - job_name: integrations/grafana-mimir/metrics
      kubernetes_sd_configs:
        - role: pod
      relabel_configs:
        # The mimir-distributed Helm chart names all ports which expose a /metrics endpoint with the 'metrics' suffix, so we keep only those targets.
        - regex: .*metrics
          action: keep
          source_labels:
            - __meta_kubernetes_pod_container_port_name
        # Keep only targets which are a part of the expected Helm chart
        - action: keep
          regex: mimir-distributed-.*
          source_labels:
            - __meta_kubernetes_pod_label_helm_sh_chart
        # The following labels are required to ensure the pre-built dashboards are fully functional later.
        - action: replace  # Replace the cluster label if it isn't present already
          regex: ""
          replacement: k8s-cluster
          separator: ""
          source_labels:
            - cluster
          target_label: cluster
        - action: replace
          source_labels:
            - __meta_kubernetes_namespace
          target_label: namespace
        - action: replace
          source_labels:
            - __meta_kubernetes_pod_name
          target_label: pod
        - action: replace
          source_labels:
            - __meta_kubernetes_pod_container_name
          target_label: container
        - action: replace
          separator: ""
          source_labels:
            - __meta_kubernetes_pod_label_name
            - __meta_kubernetes_pod_label_app_kubernetes_io_component
          target_label: __tmp_component_name
        - action: replace
          source_labels:
            - __meta_kubernetes_pod_node_name
          target_label: instance
  global:
    scrape_interval: 60s
  wal_directory: /tmp/grafana-agent-wal
Dashboards
The Self-hosted Grafana Mimir integration installs the following dashboards in your Grafana Cloud instance to help monitor your system.
- Mimir / Alertmanager
- Mimir / Alertmanager resources
- Mimir / Compactor
- Mimir / Compactor resources
- Mimir / Config
- Mimir / Object Store
- Mimir / Overrides
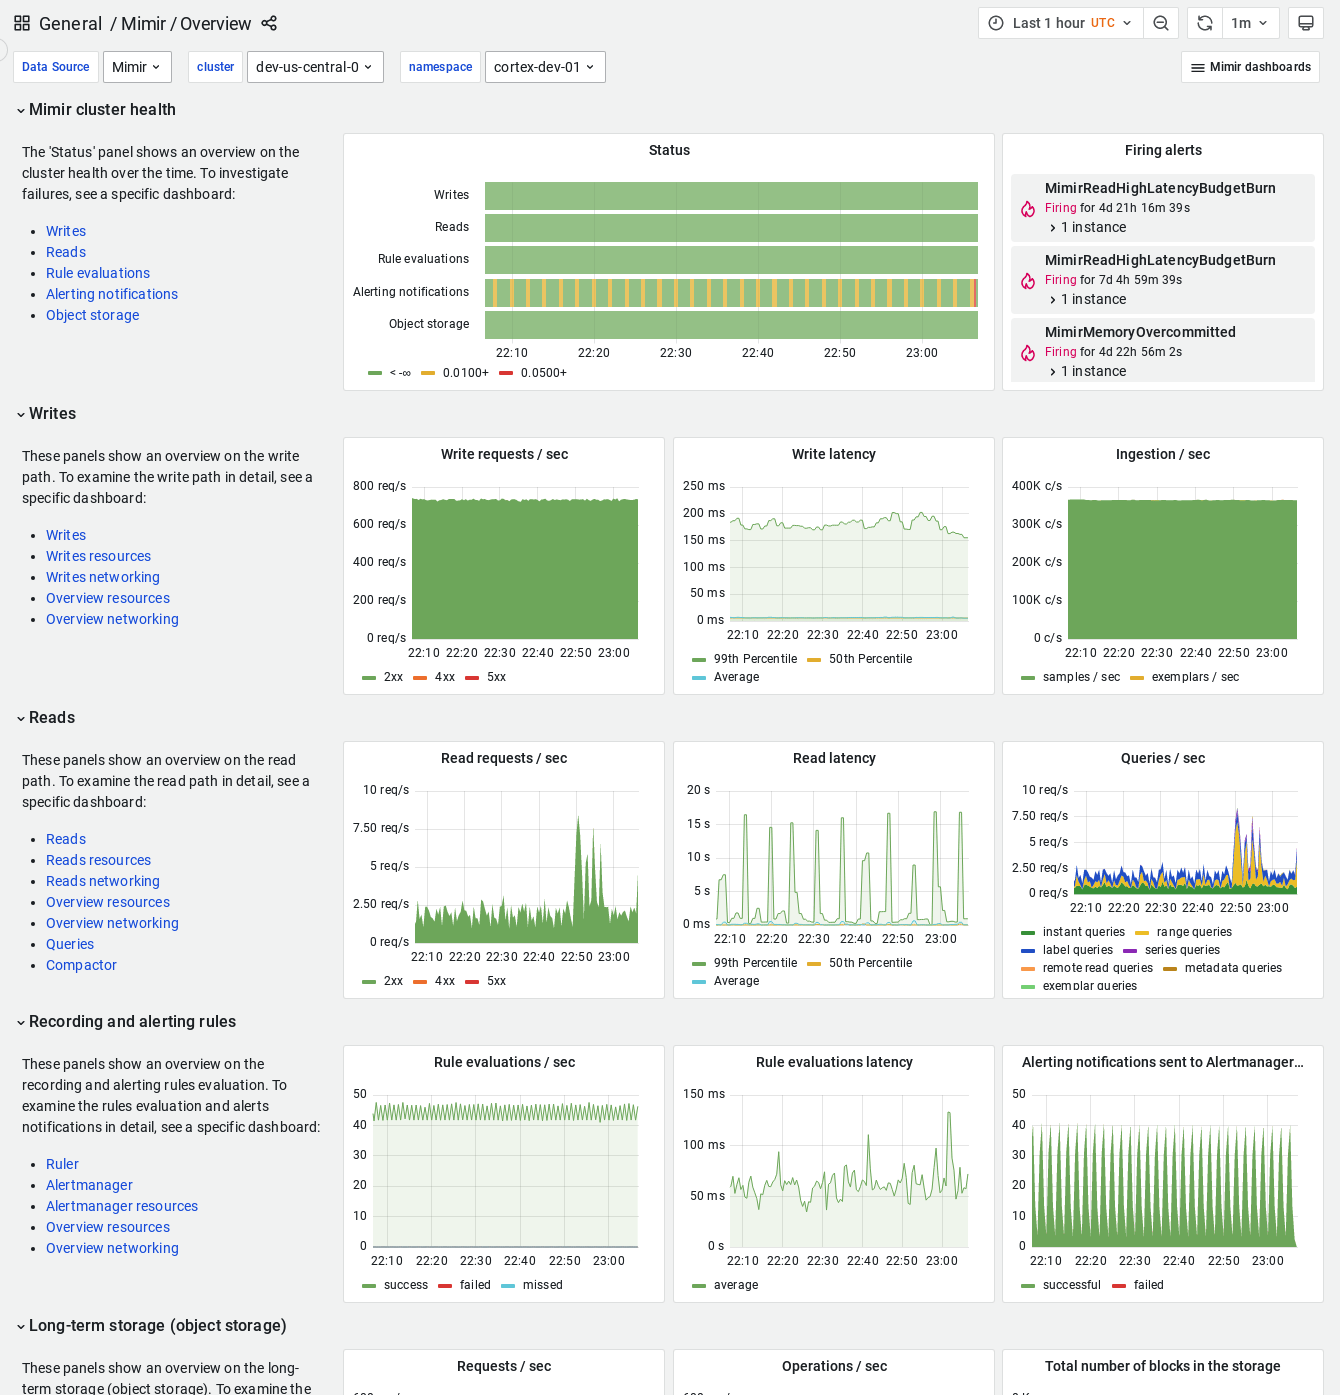
- Mimir / Overview
- Mimir / Overview networking
- Mimir / Overview resources
- Mimir / Queries
- Mimir / Reads
- Mimir / Reads networking
- Mimir / Reads resources
- Mimir / Remote ruler reads
- Mimir / Remote ruler reads resources
- Mimir / Rollout progress
- Mimir / Ruler
- Mimir / Scaling
- Mimir / Slow queries
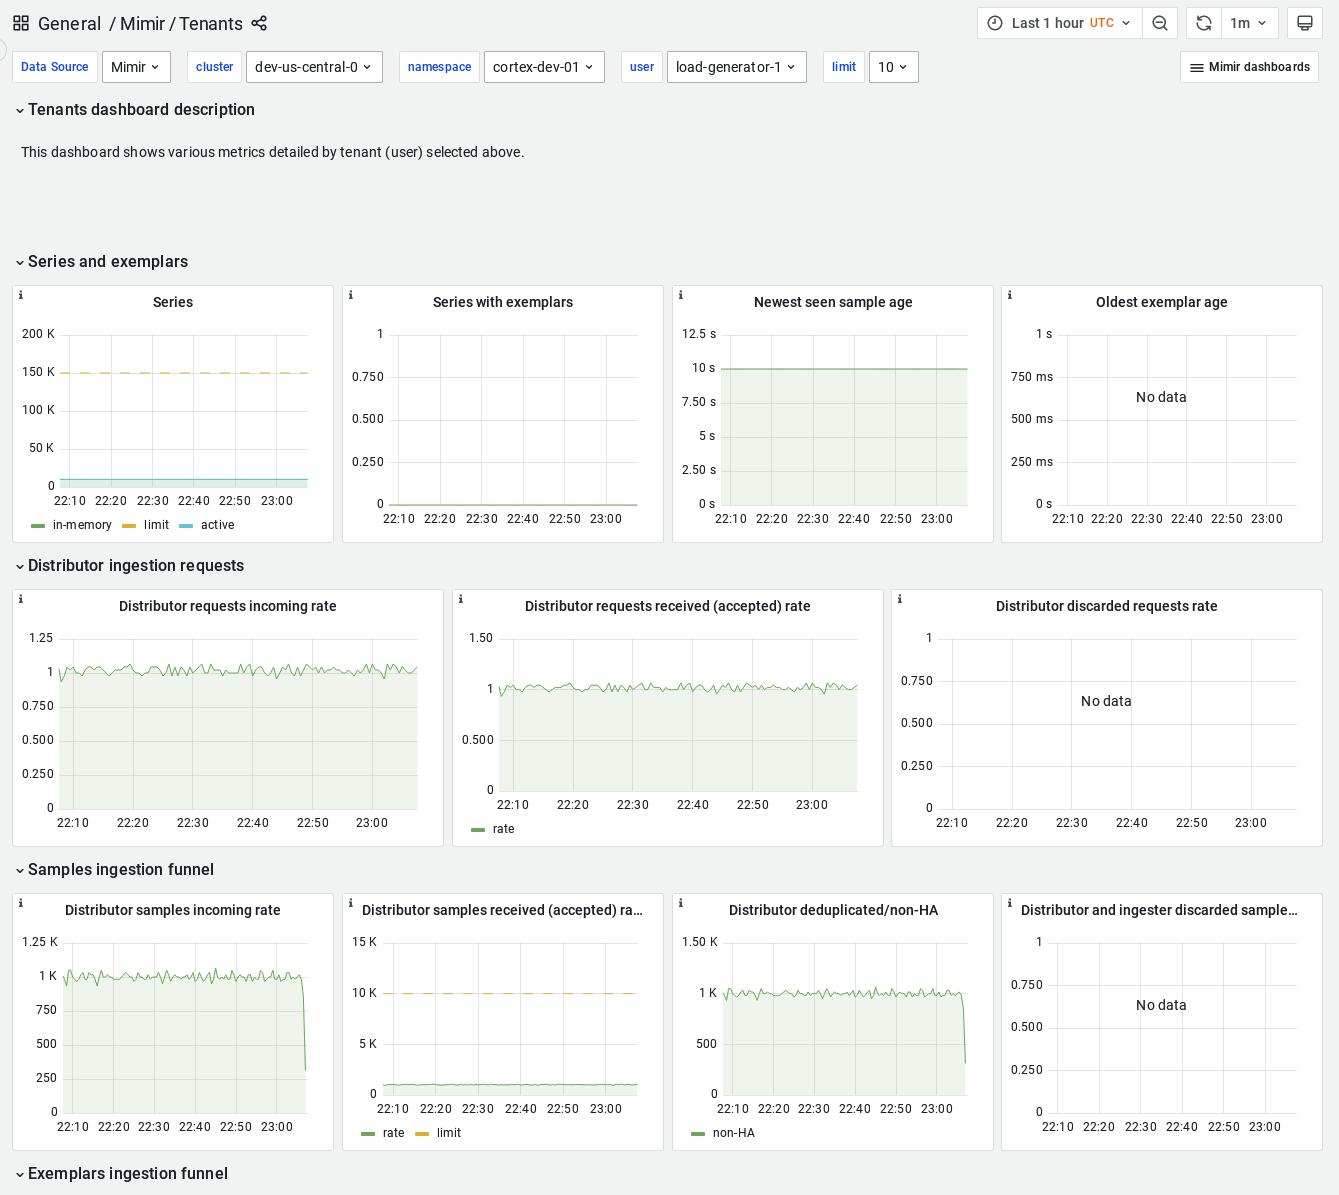
- Mimir / Tenants
- Mimir / Top tenants
- Mimir / Writes
- Mimir / Writes networking
- Mimir / Writes resources
Tenants
Overview
Alerts
The Self-hosted Grafana Mimir integration includes the following useful alerts:
mimir_alerts
| Alert | Description |
|---|---|
| MimirIngesterUnhealthy | Critical: Mimir cluster {{ $labels.cluster }}/{{ $labels.namespace }} has {{ printf “%f” $value }} unhealthy ingester(s). |
| MimirRequestErrors | Critical: The route {{ $labels.route }} in {{ $labels.cluster }}/{{ $labels.namespace }} is experiencing {{ printf “%.2f” $value }}% errors. |
| MimirRequestLatency | Warning: {{ $labels.job }} {{ $labels.route }} is experiencing {{ printf “%.2f” $value }}s 99th percentile latency. |
| MimirQueriesIncorrect | Warning: The Mimir cluster {{ $labels.cluster }}/{{ $labels.namespace }} is experiencing {{ printf “%.2f” $value }}% incorrect query results. |
| MimirInconsistentRuntimeConfig | Critical: An inconsistent runtime config file is used across cluster {{ $labels.cluster }}/{{ $labels.namespace }}. |
| MimirBadRuntimeConfig | Critical: {{ $labels.job }} failed to reload runtime config. |
| MimirFrontendQueriesStuck | Critical: There are {{ $value }} queued up queries in {{ $labels.cluster }}/{{ $labels.namespace }} {{ $labels.job }}. |
| MimirSchedulerQueriesStuck | Critical: There are {{ $value }} queued up queries in {{ $labels.cluster }}/{{ $labels.namespace }} {{ $labels.job }}. |
| MimirCacheRequestErrors | Warning: The cache {{ $labels.name }} used by Mimir {{ $labels.cluster }}/{{ $labels.namespace }} is experiencing {{ printf “%.2f” $value }}% errors for {{ $labels.operation }} operation. |
| MimirIngesterRestarts | Warning: Mimir {{ $labels.pod }} in {{ $labels.cluster }}/{{ $labels.namespace }} has restarted {{ printf “%.2f” $value }} times in the last 30 mins. |
| MimirKVStoreFailure | Critical: Mimir {{ $labels.pod }} in {{ $labels.cluster }}/{{ $labels.namespace }} is failing to talk to the KV store {{ $labels.kv_name }}. |
| MimirMemoryMapAreasTooHigh | Critical: {{ $labels.job }}/{{ $labels.pod }} has a number of mmap-ed areas close to the limit. |
| MimirIngesterInstanceHasNoTenants | Warning: Mimir ingester {{ $labels.pod }} in {{ $labels.cluster }}/{{ $labels.namespace }} has no tenants assigned. |
| MimirRulerInstanceHasNoRuleGroups | Warning: Mimir ruler {{ $labels.pod }} in {{ $labels.cluster }}/{{ $labels.namespace }} has no rule groups assigned. |
| MimirIngestedDataTooFarInTheFuture | Warning: Mimir ingester {{ $labels.pod }} in {{ $labels.cluster }}/{{ $labels.namespace }} has ingested samples with timestamps more than 1h in the future. |
| MimirStoreGatewayTooManyFailedOperations | Warning: Mimir store-gateway {{ $labels.pod }} in {{ $labels.cluster }}/{{ $labels.namespace }} is experiencing {{ $value |
| MimirRingMembersMismatch | Warning: Number of members in Mimir ingester hash ring does not match the expected number in {{ $labels.cluster }}/{{ $labels.namespace }}. |
mimir_instance_limits_alerts
| Alert | Description |
|---|---|
| MimirIngesterReachingSeriesLimit | Warning: Ingester {{ $labels.job }}/{{ $labels.pod }} has reached {{ $value |
| MimirIngesterReachingSeriesLimit | Critical: Ingester {{ $labels.job }}/{{ $labels.pod }} has reached {{ $value |
| MimirIngesterReachingTenantsLimit | Warning: Ingester {{ $labels.job }}/{{ $labels.pod }} has reached {{ $value |
| MimirIngesterReachingTenantsLimit | Critical: Ingester {{ $labels.job }}/{{ $labels.pod }} has reached {{ $value |
| MimirReachingTCPConnectionsLimit | Critical: Mimir instance {{ $labels.job }}/{{ $labels.pod }} has reached {{ $value |
| MimirDistributorReachingInflightPushRequestLimit | Critical: Distributor {{ $labels.job }}/{{ $labels.pod }} has reached {{ $value |
mimir-rollout-alerts
| Alert | Description |
|---|---|
| MimirRolloutStuck | Warning: The {{ $labels.rollout_group }} rollout is stuck in {{ $labels.cluster }}/{{ $labels.namespace }}. |
| MimirRolloutStuck | Warning: The {{ $labels.rollout_group }} rollout is stuck in {{ $labels.cluster }}/{{ $labels.namespace }}. |
| RolloutOperatorNotReconciling | Critical: Rollout operator is not reconciling the rollout group {{ $labels.rollout_group }} in {{ $labels.cluster }}/{{ $labels.namespace }}. |
mimir-provisioning
| Alert | Description |
|---|---|
| MimirAllocatingTooMuchMemory | Warning: Instance {{ $labels.pod }} in {{ $labels.cluster }}/{{ $labels.namespace }} is using too much memory. |
| MimirAllocatingTooMuchMemory | Critical: Instance {{ $labels.pod }} in {{ $labels.cluster }}/{{ $labels.namespace }} is using too much memory. |
ruler_alerts
| Alert | Description |
|---|---|
| MimirRulerTooManyFailedPushes | Critical: Mimir Ruler {{ $labels.pod }} in {{ $labels.cluster }}/{{ $labels.namespace }} is experiencing {{ printf “%.2f” $value }}% write (push) errors. |
| MimirRulerTooManyFailedQueries | Critical: Mimir Ruler {{ $labels.pod }} in {{ $labels.cluster }}/{{ $labels.namespace }} is experiencing {{ printf “%.2f” $value }}% errors while evaluating rules. |
| MimirRulerMissedEvaluations | Warning: Mimir Ruler {{ $labels.pod }} in {{ $labels.cluster }}/{{ $labels.namespace }} is experiencing {{ printf “%.2f” $value }}% missed iterations for the rule group {{ $labels.rule_group }}. |
| MimirRulerFailedRingCheck | Critical: Mimir Rulers in {{ $labels.cluster }}/{{ $labels.namespace }} are experiencing errors when checking the ring for rule group ownership. |
| MimirRulerRemoteEvaluationFailing | Warning: Mimir rulers in {{ $labels.cluster }}/{{ $labels.namespace }} are failing to perform {{ printf “%.2f” $value }}% of remote evaluations through the ruler-query-frontend. |
gossip_alerts
| Alert | Description |
|---|---|
| MimirGossipMembersTooHigh | Warning: One or more Mimir instances in {{ $labels.cluster }}/{{ $labels.namespace }} consistently sees a higher than expected number of gossip members. |
| MimirGossipMembersTooLow | Warning: One or more Mimir instances in {{ $labels.cluster }}/{{ $labels.namespace }} consistently sees a lower than expected number of gossip members. |
etcd_alerts
| Alert | Description |
|---|---|
| EtcdAllocatingTooMuchMemory | Warning: Too much memory being used by {{ $labels.namespace }}/{{ $labels.pod }} - bump memory limit. |
| EtcdAllocatingTooMuchMemory | Critical: Too much memory being used by {{ $labels.namespace }}/{{ $labels.pod }} - bump memory limit. |
alertmanager_alerts
| Alert | Description |
|---|---|
| MimirAlertmanagerSyncConfigsFailing | Critical: Mimir Alertmanager {{ $labels.job }}/{{ $labels.pod }} is failing to read tenant configurations from storage. |
| MimirAlertmanagerRingCheckFailing | Critical: Mimir Alertmanager {{ $labels.job }}/{{ $labels.pod }} is unable to check tenants ownership via the ring. |
| MimirAlertmanagerPartialStateMergeFailing | Critical: Mimir Alertmanager {{ $labels.job }}/{{ $labels.pod }} is failing to merge partial state changes received from a replica. |
| MimirAlertmanagerReplicationFailing | Critical: Mimir Alertmanager {{ $labels.job }}/{{ $labels.pod }} is failing to replicating partial state to its replicas. |
| MimirAlertmanagerPersistStateFailing | Critical: Mimir Alertmanager {{ $labels.job }}/{{ $labels.pod }} is unable to persist full state snaphots to remote storage. |
| MimirAlertmanagerInitialSyncFailed | Critical: Mimir Alertmanager {{ $labels.job }}/{{ $labels.pod }} was unable to obtain some initial state when starting up. |
| MimirAlertmanagerAllocatingTooMuchMemory | Warning: Alertmanager {{ $labels.pod }} in {{ $labels.cluster }}/{{ $labels.namespace }} is using too much memory. |
| MimirAlertmanagerAllocatingTooMuchMemory | Critical: Alertmanager {{ $labels.pod }} in {{ $labels.cluster }}/{{ $labels.namespace }} is using too much memory. |
| MimirAlertmanagerInstanceHasNoTenants | Warning: Mimir alertmanager {{ $labels.pod }} in {{ $labels.cluster }}/{{ $labels.namespace }} owns no tenants. |
mimir_blocks_alerts
| Alert | Description |
|---|---|
| MimirIngesterHasNotShippedBlocks | Critical: Mimir Ingester {{ $labels.pod }} in {{ $labels.cluster }}/{{ $labels.namespace }} has not shipped any block in the last 4 hours. |
| MimirIngesterHasNotShippedBlocksSinceStart | Critical: Mimir Ingester {{ $labels.pod }} in {{ $labels.cluster }}/{{ $labels.namespace }} has not shipped any block in the last 4 hours. |
| MimirIngesterHasUnshippedBlocks | Critical: Mimir Ingester {{ $labels.pod }} in {{ $labels.cluster }}/{{ $labels.namespace }} has compacted a block {{ $value |
| MimirIngesterTSDBHeadCompactionFailed | Critical: Mimir Ingester {{ $labels.pod }} in {{ $labels.cluster }}/{{ $labels.namespace }} is failing to compact TSDB head. |
| MimirIngesterTSDBHeadTruncationFailed | Critical: Mimir Ingester {{ $labels.pod }} in {{ $labels.cluster }}/{{ $labels.namespace }} is failing to truncate TSDB head. |
| MimirIngesterTSDBCheckpointCreationFailed | Critical: Mimir Ingester {{ $labels.pod }} in {{ $labels.cluster }}/{{ $labels.namespace }} is failing to create TSDB checkpoint. |
| MimirIngesterTSDBCheckpointDeletionFailed | Critical: Mimir Ingester {{ $labels.pod }} in {{ $labels.cluster }}/{{ $labels.namespace }} is failing to delete TSDB checkpoint. |
| MimirIngesterTSDBWALTruncationFailed | Warning: Mimir Ingester {{ $labels.pod }} in {{ $labels.cluster }}/{{ $labels.namespace }} is failing to truncate TSDB WAL. |
| MimirIngesterTSDBWALCorrupted | Critical: Mimir Ingester {{ $labels.pod }} in {{ $labels.cluster }}/{{ $labels.namespace }} got a corrupted TSDB WAL. |
| MimirIngesterTSDBWALCorrupted | Critical: Mimir Ingester {{ $labels.pod }} in {{ $labels.cluster }}/{{ $labels.namespace }} got a corrupted TSDB WAL. |
| MimirIngesterTSDBWALWritesFailed | Critical: Mimir Ingester {{ $labels.pod }} in {{ $labels.cluster }}/{{ $labels.namespace }} is failing to write to TSDB WAL. |
| MimirStoreGatewayHasNotSyncTheBucket | Critical: Mimir store-gateway {{ $labels.pod }} in {{ $labels.cluster }}/{{ $labels.namespace }} has not successfully synched the bucket since {{ $value |
| MimirStoreGatewayNoSyncedTenants | Warning: Mimir store-gateway {{ $labels.pod }} in {{ $labels.cluster }}/{{ $labels.namespace }} is not syncing any blocks for any tenant. |
| MimirBucketIndexNotUpdated | Critical: Mimir bucket index for tenant {{ $labels.user }} in {{ $labels.cluster }}/{{ $labels.namespace }} has not been updated since {{ $value |
mimir_compactor_alerts
| Alert | Description |
|---|---|
| MimirCompactorHasNotSuccessfullyCleanedUpBlocks | Critical: Mimir Compactor {{ $labels.pod }} in {{ $labels.cluster }}/{{ $labels.namespace }} has not successfully cleaned up blocks in the last 6 hours. |
| MimirCompactorHasNotSuccessfullyRunCompaction | Critical: Mimir Compactor {{ $labels.pod }} in {{ $labels.cluster }}/{{ $labels.namespace }} has not run compaction in the last 24 hours. |
| MimirCompactorHasNotSuccessfullyRunCompaction | Critical: Mimir Compactor {{ $labels.pod }} in {{ $labels.cluster }}/{{ $labels.namespace }} has not run compaction in the last 24 hours. |
| MimirCompactorHasNotSuccessfullyRunCompaction | Critical: Mimir Compactor {{ $labels.pod }} in {{ $labels.cluster }}/{{ $labels.namespace }} failed to run 2 consecutive compactions. |
| MimirCompactorHasNotUploadedBlocks | Critical: Mimir Compactor {{ $labels.pod }} in {{ $labels.cluster }}/{{ $labels.namespace }} has not uploaded any block in the last 24 hours. |
| MimirCompactorHasNotUploadedBlocks | Critical: Mimir Compactor {{ $labels.pod }} in {{ $labels.cluster }}/{{ $labels.namespace }} has not uploaded any block since its start. |
| MimirCompactorSkippedUnhealthyBlocks | Warning: Mimir Compactor {{ $labels.pod }} in {{ $labels.cluster }}/{{ $labels.namespace }} has found and ignored unhealthy blocks. |
| MimirCompactorSkippedUnhealthyBlocks | Critical: Mimir Compactor {{ $labels.pod }} in {{ $labels.cluster }}/{{ $labels.namespace }} has found and ignored unhealthy blocks. |
mimir_autoscaling
| Alert | Description |
|---|---|
| MimirAutoscalerNotActive | Critical: The Horizontal Pod Autoscaler (HPA) {{ $labels.horizontalpodautoscaler }} in {{ $labels.namespace }} is not active. |
| MimirAutoscalerKedaFailing | Critical: The Keda ScaledObject {{ $labels.scaledObject }} in {{ $labels.namespace }} is experiencing errors. |
mimir_continuous_test
| Alert | Description |
|---|---|
| MimirContinuousTestNotRunningOnWrites | Warning: Mimir continuous test {{ $labels.test }} in {{ $labels.cluster }}/{{ $labels.namespace }} is not effectively running because writes are failing. |
| MimirContinuousTestNotRunningOnReads | Warning: Mimir continuous test {{ $labels.test }} in {{ $labels.cluster }}/{{ $labels.namespace }} is not effectively running because queries are failing. |
| MimirContinuousTestFailed | Warning: Mimir continuous test {{ $labels.test }} in {{ $labels.cluster }}/{{ $labels.namespace }} failed when asserting query results. |
Metrics
The most important metrics provided by the Self-hosted Grafana Mimir integration, which are used on the pre-built dashboards and Prometheus alerts, are as follows:
- cluster_job:cortex_alertmanager_alerts_invalid_total:rate5m
- cluster_job:cortex_alertmanager_alerts_received_total:rate5m
- cluster_job:cortex_alertmanager_partial_state_merges_failed_total:rate5m
- cluster_job:cortex_alertmanager_partial_state_merges_total:rate5m
- cluster_job:cortex_alertmanager_state_replication_failed_total:rate5m
- cluster_job:cortex_alertmanager_state_replication_total:rate5m
- cluster_job:cortex_ingester_queried_exemplars_bucket:sum_rate
- cluster_job:cortex_ingester_queried_exemplars_count:sum_rate
- cluster_job:cortex_ingester_queried_exemplars_sum:sum_rate
- cluster_job:cortex_ingester_queried_samples_bucket:sum_rate
- cluster_job:cortex_ingester_queried_samples_count:sum_rate
- cluster_job:cortex_ingester_queried_samples_sum:sum_rate
- cluster_job:cortex_ingester_queried_series_bucket:sum_rate
- cluster_job:cortex_ingester_queried_series_count:sum_rate
- cluster_job:cortex_ingester_queried_series_sum:sum_rate
- cluster_job_integration:cortex_alertmanager_notifications_failed_total:rate5m
- cluster_job_integration:cortex_alertmanager_notifications_total:rate5m
- cluster_job_pod:cortex_alertmanager_alerts:sum
- cluster_job_pod:cortex_alertmanager_silences:sum
- cluster_job_route:cortex_querier_request_duration_seconds_bucket:sum_rate
- cluster_job_route:cortex_querier_request_duration_seconds_count:sum_rate
- cluster_job_route:cortex_querier_request_duration_seconds_sum:sum_rate
- cluster_job_route:cortex_request_duration_seconds_bucket:sum_rate
- cluster_job_route:cortex_request_duration_seconds_count:sum_rate
- cluster_job_route:cortex_request_duration_seconds_sum:sum_rate
- cluster_namespace_deployment:actual_replicas:count
- cluster_namespace_deployment_reason:required_replicas:count
- cluster_namespace_job:cortex_distributor_exemplars_in:rate5m
- cluster_namespace_job:cortex_distributor_received_exemplars:rate5m
- cluster_namespace_job:cortex_distributor_received_samples:rate5m
- cluster_namespace_job:cortex_ingester_ingested_exemplars:rate5m
- cluster_namespace_job:cortex_ingester_tsdb_exemplar_exemplars_appended:rate5m
- cluster_namespace_job_route:cortex_request_duration_seconds:99quantile
- cluster_namespace_pod:cortex_ingester_ingested_samples_total:rate1m
- container_cpu_usage_seconds_total
- container_fs_writes_bytes_total
- container_memory_rss
- container_memory_usage_bytes
- container_memory_working_set_bytes
- container_network_receive_bytes_total
- container_network_transmit_bytes_total
- container_spec_cpu_period
- container_spec_cpu_quota
- container_spec_memory_limit_bytes
- cortex_alertmanager_alerts
- cortex_alertmanager_alerts_invalid_total
- cortex_alertmanager_alerts_received_total
- cortex_alertmanager_dispatcher_aggregation_groups
- cortex_alertmanager_notification_latency_seconds_bucket
- cortex_alertmanager_notification_latency_seconds_count
- cortex_alertmanager_notification_latency_seconds_sum
- cortex_alertmanager_notifications_failed_total
- cortex_alertmanager_notifications_total
- cortex_alertmanager_partial_state_merges_failed_total
- cortex_alertmanager_partial_state_merges_total
- cortex_alertmanager_ring_check_errors_total
- cortex_alertmanager_silences
- cortex_alertmanager_state_fetch_replica_state_failed_total
- cortex_alertmanager_state_fetch_replica_state_total
- cortex_alertmanager_state_initial_sync_completed_total
- cortex_alertmanager_state_initial_sync_duration_seconds_bucket
- cortex_alertmanager_state_initial_sync_duration_seconds_count
- cortex_alertmanager_state_initial_sync_duration_seconds_sum
- cortex_alertmanager_state_persist_failed_total
- cortex_alertmanager_state_persist_total
- cortex_alertmanager_state_replication_failed_total
- cortex_alertmanager_state_replication_total
- cortex_alertmanager_sync_configs_failed_total
- cortex_alertmanager_sync_configs_total
- cortex_alertmanager_tenants_discovered
- cortex_alertmanager_tenants_owned
- cortex_bucket_blocks_count
- cortex_bucket_index_estimated_compaction_jobs
- cortex_bucket_index_estimated_compaction_jobs_errors_total
- cortex_bucket_index_last_successful_update_timestamp_seconds
- cortex_bucket_index_load_duration_seconds_bucket
- cortex_bucket_index_load_duration_seconds_count
- cortex_bucket_index_load_duration_seconds_sum
- cortex_bucket_index_load_failures_total
- cortex_bucket_index_loaded
- cortex_bucket_index_loads_total
- cortex_bucket_store_block_drop_failures_total
- cortex_bucket_store_block_drops_total
- cortex_bucket_store_block_load_failures_total
- cortex_bucket_store_block_loads_total
- cortex_bucket_store_blocks_loaded
- cortex_bucket_store_indexheader_lazy_load_duration_seconds_bucket
- cortex_bucket_store_indexheader_lazy_load_duration_seconds_count
- cortex_bucket_store_indexheader_lazy_load_duration_seconds_sum
- cortex_bucket_store_indexheader_lazy_load_total
- cortex_bucket_store_indexheader_lazy_unload_total
- cortex_bucket_store_series_batch_preloading_load_duration_seconds_sum
- cortex_bucket_store_series_batch_preloading_wait_duration_seconds_sum
- cortex_bucket_store_series_blocks_queried_sum
- cortex_bucket_store_series_data_size_fetched_bytes_sum
- cortex_bucket_store_series_data_size_touched_bytes_sum
- cortex_bucket_store_series_hash_cache_hits_total
- cortex_bucket_store_series_hash_cache_requests_total
- cortex_bucket_store_series_request_stage_duration_seconds_bucket
- cortex_bucket_store_series_request_stage_duration_seconds_count
- cortex_bucket_store_series_request_stage_duration_seconds_sum
- cortex_bucket_stores_blocks_last_successful_sync_timestamp_seconds
- cortex_bucket_stores_gate_duration_seconds_bucket
- cortex_bucket_stores_gate_duration_seconds_count
- cortex_bucket_stores_gate_duration_seconds_sum
- cortex_bucket_stores_tenants_synced
- cortex_build_info
- cortex_cache_memory_hits_total
- cortex_cache_memory_requests_total
- cortex_cache_request_duration_seconds_bucket
- cortex_cache_request_duration_seconds_count
- cortex_cache_request_duration_seconds_sum
- cortex_compactor_block_cleanup_failures_total
- cortex_compactor_block_cleanup_last_successful_run_timestamp_seconds
- cortex_compactor_blocks_cleaned_total
- cortex_compactor_blocks_marked_for_deletion_total
- cortex_compactor_blocks_marked_for_no_compaction_total
- cortex_compactor_group_compaction_runs_started_total
- cortex_compactor_last_successful_run_timestamp_seconds
- cortex_compactor_meta_sync_duration_seconds_bucket
- cortex_compactor_meta_sync_duration_seconds_count
- cortex_compactor_meta_sync_duration_seconds_sum
- cortex_compactor_meta_sync_failures_total
- cortex_compactor_meta_syncs_total
- cortex_compactor_runs_completed_total
- cortex_compactor_runs_failed_total
- cortex_compactor_runs_started_total
- cortex_compactor_tenants_discovered
- cortex_compactor_tenants_processing_failed
- cortex_compactor_tenants_processing_succeeded
- cortex_compactor_tenants_skipped
- cortex_config_hash
- cortex_discarded_exemplars_total
- cortex_discarded_requests_total
- cortex_discarded_samples_total
- cortex_distributor_deduped_samples_total
- cortex_distributor_exemplars_in_total
- cortex_distributor_inflight_push_requests
- cortex_distributor_instance_limits
- cortex_distributor_instance_rejected_requests_total
- cortex_distributor_latest_seen_sample_timestamp_seconds
- cortex_distributor_non_ha_samples_received_total
- cortex_distributor_received_exemplars_total
- cortex_distributor_received_requests_total
- cortex_distributor_received_samples_total
- cortex_distributor_replication_factor
- cortex_distributor_requests_in_total
- cortex_distributor_samples_in_total
- cortex_frontend_query_range_duration_seconds_count
- cortex_frontend_query_result_cache_attempted_total
- cortex_frontend_query_result_cache_hits_total
- cortex_frontend_query_result_cache_requests_total
- cortex_frontend_query_result_cache_skipped_total
- cortex_frontend_query_sharding_rewrites_attempted_total
- cortex_frontend_query_sharding_rewrites_succeeded_total
- cortex_frontend_sharded_queries_per_query_bucket
- cortex_frontend_sharded_queries_per_query_count
- cortex_frontend_sharded_queries_per_query_sum
- cortex_frontend_split_queries_total
- cortex_inflight_requests
- cortex_ingester_active_native_histogram_buckets
- cortex_ingester_active_native_histogram_buckets_custom_tracker
- cortex_ingester_active_native_histogram_series
- cortex_ingester_active_native_histogram_series_custom_tracker
- cortex_ingester_active_series
- cortex_ingester_active_series_custom_tracker
- cortex_ingester_client_request_duration_seconds_bucket
- cortex_ingester_client_request_duration_seconds_count
- cortex_ingester_client_request_duration_seconds_sum
- cortex_ingester_ingested_exemplars_total
- cortex_ingester_ingested_samples_total
- cortex_ingester_instance_limits
- cortex_ingester_instance_rejected_requests_total
- cortex_ingester_memory_series
- cortex_ingester_memory_series_created_total
- cortex_ingester_memory_series_removed_total
- cortex_ingester_memory_users
- cortex_ingester_oldest_unshipped_block_timestamp_seconds
- cortex_ingester_queried_exemplars_bucket
- cortex_ingester_queried_exemplars_count
- cortex_ingester_queried_exemplars_sum
- cortex_ingester_queried_samples_bucket
- cortex_ingester_queried_samples_count
- cortex_ingester_queried_samples_sum
- cortex_ingester_queried_series_bucket
- cortex_ingester_queried_series_count
- cortex_ingester_queried_series_sum
- cortex_ingester_shipper_last_successful_upload_timestamp_seconds
- cortex_ingester_shipper_upload_failures_total
- cortex_ingester_shipper_uploads_total
- cortex_ingester_tsdb_checkpoint_creations_failed_total
- cortex_ingester_tsdb_checkpoint_creations_total
- cortex_ingester_tsdb_checkpoint_deletions_failed_total
- cortex_ingester_tsdb_compaction_duration_seconds_bucket
- cortex_ingester_tsdb_compaction_duration_seconds_count
- cortex_ingester_tsdb_compaction_duration_seconds_sum
- cortex_ingester_tsdb_compactions_failed_total
- cortex_ingester_tsdb_compactions_total
- cortex_ingester_tsdb_exemplar_exemplars_appended_total
- cortex_ingester_tsdb_exemplar_exemplars_in_storage
- cortex_ingester_tsdb_exemplar_last_exemplars_timestamp_seconds
- cortex_ingester_tsdb_exemplar_series_with_exemplars_in_storage
- cortex_ingester_tsdb_head_max_timestamp_seconds
- cortex_ingester_tsdb_head_truncations_failed_total
- cortex_ingester_tsdb_mmap_chunk_corruptions_total
- cortex_ingester_tsdb_storage_blocks_bytes
- cortex_ingester_tsdb_symbol_table_size_bytes
- cortex_ingester_tsdb_wal_corruptions_total
- cortex_ingester_tsdb_wal_truncate_duration_seconds_count
- cortex_ingester_tsdb_wal_truncate_duration_seconds_sum
- cortex_ingester_tsdb_wal_truncations_failed_total
- cortex_ingester_tsdb_wal_truncations_total
- cortex_ingester_tsdb_wal_writes_failed_total
- cortex_kv_request_duration_seconds_bucket
- cortex_kv_request_duration_seconds_count
- cortex_kv_request_duration_seconds_sum
- cortex_limits_defaults
- cortex_limits_overrides
- cortex_memcache_request_duration_seconds_bucket
- cortex_memcache_request_duration_seconds_count
- cortex_memcache_request_duration_seconds_sum
- cortex_prometheus_notifications_dropped_total
- cortex_prometheus_notifications_errors_total
- cortex_prometheus_notifications_queue_capacity
- cortex_prometheus_notifications_queue_length
- cortex_prometheus_notifications_sent_total
- cortex_prometheus_rule_evaluation_duration_seconds_count
- cortex_prometheus_rule_evaluation_duration_seconds_sum
- cortex_prometheus_rule_evaluation_failures_total
- cortex_prometheus_rule_evaluations_total
- cortex_prometheus_rule_group_duration_seconds_count
- cortex_prometheus_rule_group_duration_seconds_sum
- cortex_prometheus_rule_group_iterations_missed_total
- cortex_prometheus_rule_group_iterations_total
- cortex_prometheus_rule_group_rules
- cortex_querier_blocks_consistency_checks_failed_total
- cortex_querier_blocks_consistency_checks_total
- cortex_querier_queries_rejected_total
- cortex_querier_request_duration_seconds_bucket
- cortex_querier_request_duration_seconds_count
- cortex_querier_request_duration_seconds_sum
- cortex_querier_storegateway_instances_hit_per_query_bucket
- cortex_querier_storegateway_instances_hit_per_query_count
- cortex_querier_storegateway_instances_hit_per_query_sum
- cortex_querier_storegateway_refetches_per_query_bucket
- cortex_querier_storegateway_refetches_per_query_count
- cortex_querier_storegateway_refetches_per_query_sum
- cortex_query_frontend_queries_total
- cortex_query_frontend_queue_duration_seconds_bucket
- cortex_query_frontend_queue_duration_seconds_count
- cortex_query_frontend_queue_duration_seconds_sum
- cortex_query_frontend_queue_length
- cortex_query_frontend_retries_bucket
- cortex_query_frontend_retries_count
- cortex_query_frontend_retries_sum
- cortex_query_scheduler_queue_duration_seconds_bucket
- cortex_query_scheduler_queue_duration_seconds_count
- cortex_query_scheduler_queue_duration_seconds_sum
- cortex_query_scheduler_queue_length
- cortex_request_duration_seconds_bucket
- cortex_request_duration_seconds_count
- cortex_request_duration_seconds_sum
- cortex_ring_members
- cortex_ruler_managers_total
- cortex_ruler_queries_failed_total
- cortex_ruler_queries_total
- cortex_ruler_ring_check_errors_total
- cortex_ruler_write_requests_failed_total
- cortex_ruler_write_requests_total
- cortex_runtime_config_hash
- cortex_runtime_config_last_reload_successful
- cortex_tcp_connections
- cortex_tcp_connections_limit
- go_memstats_heap_inuse_bytes
- keda_scaler_errors
- keda_scaler_metrics_value
- kube_deployment_spec_replicas
- kube_deployment_status_replicas_unavailable
- kube_deployment_status_replicas_updated
- kube_horizontalpodautoscaler_spec_target_metric
- kube_horizontalpodautoscaler_status_condition
- kube_persistentvolumeclaim_labels
- kube_pod_container_info
- kube_pod_container_resource_requests
- kube_pod_container_resource_requests_cpu_cores
- kube_pod_container_resource_requests_memory_bytes
- kube_pod_container_status_restarts_total
- kube_statefulset_replicas
- kube_statefulset_status_current_revision
- kube_statefulset_status_replicas_current
- kube_statefulset_status_replicas_ready
- kube_statefulset_status_replicas_updated
- kube_statefulset_status_update_revision
- kubelet_volume_stats_capacity_bytes
- kubelet_volume_stats_used_bytes
- memberlist_client_cluster_members_count
- memcached_limit_bytes
- mimir_continuous_test_queries_failed_total
- mimir_continuous_test_query_result_checks_failed_total
- mimir_continuous_test_writes_failed_total
- node_disk_read_bytes_total
- node_disk_written_bytes_total
- process_memory_map_areas
- process_memory_map_areas_limit
- prometheus_tsdb_compaction_duration_seconds_bucket
- prometheus_tsdb_compaction_duration_seconds_count
- prometheus_tsdb_compaction_duration_seconds_sum
- prometheus_tsdb_compactions_total
- rollout_operator_last_successful_group_reconcile_timestamp_seconds
- test_exporter_test_case_result_total
- thanos_cache_hits_total
- thanos_cache_memcached_hits_total
- thanos_cache_memcached_requests_total
- thanos_cache_operation_duration_seconds_bucket
- thanos_cache_operation_duration_seconds_count
- thanos_cache_operation_duration_seconds_sum
- thanos_cache_operation_failures_total
- thanos_cache_operations_total
- thanos_cache_requests_total
- thanos_memcached_operation_duration_seconds_bucket
- thanos_memcached_operation_duration_seconds_count
- thanos_memcached_operation_duration_seconds_sum
- thanos_memcached_operation_failures_total
- thanos_memcached_operations_total
- thanos_objstore_bucket_last_successful_upload_time
- thanos_objstore_bucket_operation_duration_seconds_bucket
- thanos_objstore_bucket_operation_duration_seconds_count
- thanos_objstore_bucket_operation_duration_seconds_sum
- thanos_objstore_bucket_operation_failures_total
- thanos_objstore_bucket_operations_total
- thanos_store_index_cache_hits_total
- thanos_store_index_cache_requests_total
- up
Changelog
# 2.1.0 - March 2024

* [ENHANCEMENT] Dashboards: Show queries per second for the `/api/v1/cardinality/` endpoints on the "Overview" dashboard.
* [ENHANCEMENT] Dashboards: show query-scheduler queue length on "Reads" and "Remote Ruler Reads" dashboards.
* [ENHANCEMENT] Dashboards: Add estimated number of compaction jobs to "Compactor", "Tenants" and "Top tenants" dashboards.
* [BUGFIX] Dashboards: drop `step` parameter from targets as it is not supported.
* [BUGFIX] Dashboards: replace deprecated `graph` panels with `timeseries` panels.

# 2.0.0 - November 2023

This updates the Mixin to its version close to the release of Mimir v2.11.

* [CHANGE] KEDA metrics only work for KEDA versions > 2.9 and require scraping the KEDA operator instead of the KEDA metrics server.
* [CHANGE] Alerts: Remove `MimirQuerierHighRefetchRate`.
* [CHANGE] Alerts: Remove `MimirTenantHasPartialBlocks`. This is obsoleted by the changed default of `-compactor.partial-block-deletion-delay` to `1d`, which will auto remediate this alert.
* [CHANGE] Alerts: don't raise `MimirRequestErrors` or `MimirRequestLatency` alert for the `/debug/pprof` endpoint.
* [CHANGE] Alerts: remove `MimirGossipMembersMismatch` alert and replace it with `MimirGossipMembersTooHigh` and `MimirGossipMembersTooLow` alerts that should have a higher signal-to-noise ratio.
* [CHANGE] Alerts: removed `MimirProvisioningTooManyActiveSeries` alert. You should configure `-ingester.instance-limits.max-series` and rely on `MimirIngesterReachingSeriesLimit` alert instead.
* [CHANGE] Alerts: removed `MimirProvisioningTooManyWrites` alert. The alerting threshold used in this alert was chosen arbitrarily and ingesters receiving an higher number of samples / sec don't necessarily have any issue. You should rely on SLOs metrics and alerts instead.
* [CHANGE] Dashboards: default to shared crosshair on all dashboards.
* [CHANGE] Dashboards: enabled reporting gRPC codes as `status_code` label in Mimir dashboards. In case of gRPC calls, the successful `status_code` label on `cortex_request_duration_seconds` and gRPC client request duration metrics has changed from 'success' and '2xx' to 'OK'.
* [CHANGE] Dashboards: removed "Query results cache misses" panel on the "Mimir / Queries" dashboard.
* [CHANGE] Dashboards: show all workloads in selected namespace on "rollout progress" dashboard.
* [CHANGE] Dashboards: show the number of updated and ready pods for each workload in the "rollout progress" panel on the "rollout progress" dashboard.
* [CHANGE] Dashboards: sort variable drop-down lists from A to Z, rather than Z to A.
* [CHANGE] The `job` label matcher for distributor and gateway have been extended to include any deployment matching `distributor.*` and `cortex-gw.*` respectively. This change allows to match custom and multi-zone distributor and gateway deployments too.
* [BUGFIX] Alerts: Fix `MimirGossipMembersMismatch` to include `admin-api` and custom compactor pods. `admin-api` is a GEM component.
* [BUGFIX] Alerts: Fix autoscaling alerts for KEDA > 2.9. [Requires scraping the KEDA operator for metrics since they moved](https://github.com/kedacore/keda/issues/3972).
* [BUGFIX] Alerts: fix `MimirIngesterRestarts` to fire only when the ingester container is restarted, excluding the cases the pod is rescheduled.
* [BUGFIX] Alerts: fixed `MimirIngesterHasNotShippedBlocks` and `MimirIngesterHasNotShippedBlocksSinceStart` alerts.
* [BUGFIX] Alerts: fixed issue where `GossipMembersMismatch` warning message referred to per-instance labels that were not produced by the alert query.
* [BUGFIX] Dashboards: Fix autoscaling dashboard panels for KEDA > 2.9. [Requires scraping the KEDA operator for metrics since they moved](https://github.com/kedacore/keda/issues/3972).
* [BUGFIX] Dashboards: fix "unhealthy pods" panel on "rollout progress" dashboard showing only a number rather than the name of the workload and the number of unhealthy pods if only one workload has unhealthy pods.
* [BUGFIX] Dashboards: fix autoscaling dashboard panels that could show multiple series for a single component.
* [BUGFIX] Dashboards: fix dashboard panels that showed percentages with axes from 0 to 10000%.
* [BUGFIX] Dashboards: fix ruler-querier scaling metric panel query and split into CPU and memory scaling metric panels.
* [BUGFIX] Dashboards: show cancelled requests in a different color to successful requests in throughput panels on dashboards.
* [ENHANCEMENT] Alertmanager dashboard: display active aggregation groups
* [ENHANCEMENT] Alerts: Add `MimirIngestedDataTooFarInTheFuture` warning alert that triggers when Mimir ingests sample with timestamp more than 1h in the future.
* [ENHANCEMENT] Alerts: `MimirIngesterTSDBWALCorrupted` now only fires when there are more than one corrupted WALs in single-zone deployments and when there are more than two zones affected in multi-zone deployments.
* [ENHANCEMENT] Alerts: added a critical alert for `CompactorSkippedBlocksWithOutOfOrderChunks` when multiple blocks are affected.
* [ENHANCEMENT] Alerts: added labels to duplicated `MimirRolloutStuck` and `MimirCompactorHasNotUploadedBlocks` rules in order to distinguish them.
* [ENHANCEMENT] Alerts: do not fire `MimirAllocatingTooMuchMemory` alert for any matching container outside of namespaces where Mimir is running.
* [ENHANCEMENT] Dashboards: Added the min-replicas for autoscaling dashboards.
* [ENHANCEMENT] Dashboards: Optionally show rejected requests on Mimir Writes dashboard. Useful when used together with "early request rejection" in ingester and distributor.
* [ENHANCEMENT] Dashboards: add "rejected queries" panel to "queries" dashboard.
* [ENHANCEMENT] Dashboards: add native histogram active series and active buckets to "tenants" dashboard.
* [ENHANCEMENT] Dashboards: add panels to "Mimir / Writes" for requests rejected for per-instance limits.
* [ENHANCEMENT] Dashboards: adjust layout of "rollout progress" dashboard panels so that the "rollout progress" panel doesn't require scrolling.
* [ENHANCEMENT] Dashboards: fix holes in graph for lightly loaded clusters
* [ENHANCEMENT] Dashboards: rename "Blocks currently loaded" to "Blocks currently owned" in the "Mimir / Queries" dashboard.
* [ENHANCEMENT] Dashboards: show container name first in "pods count per version" panel on "rollout progress" dashboard.
* [ENHANCEMENT] Dashboards: show time spend waiting for turn when lazy loading index headers in the "index-header lazy load gate latency" panel on the "queries" dashboard.
* [ENHANCEMENT] Dashboards: split query results cache hit ratio by request type in "Query results cache hit ratio" panel on the "Mimir / Queries" dashboard.
* [ENHANCEMENT] Dashboards: Add panels for alertmanager activity of a tenant
* [ENHANCEMENT] Dashboards: Add graphs to "Slow Queries" dashboard.
* [ENHANCEMENT] Dashboards: remove legacy `graph` panel from Rollout Progress dashboard.
* [ENHANCEMENT] Dashboards: Make most columns in "Slow Queries" sortable.
* [ENHANCEMENT] Dashboards: Render graph panels at full resolution as opposed to at half resolution.

# 1.0.2 - September 2023

* New Filter Metrics option for configuring the Grafana Agent, which saves on metrics cost by dropping any metric not used by this integration. Beware that anything custom built using metrics that are not on the snippet will stop working.

# 1.0.1 - August 2023

* Add regex filter for logs datasource

# 1.0.0 - June 2023

* [FEATURE] Enable alerts.
* [BUGFIX] Dashboards: Fix `Rollout Progress` dashboard incorrectly using Gateway metrics when Gateway was not enabled.
* [BUGFIX] Pod selector regex for deployments: change `(.*-mimir-)` to `(.*mimir-)`.
* [BUGFIX] Ruler dashboard: show data for reads from ingesters.
* [BUGFIX] Tenants dashboard: Correctly show the ruler-query-scheduler queue size.
* [BUGFIX] Tenants dashboard: Make it compatible with all deployment types.
* [CHANGE] Make distributor auto-scaling metric panels show desired number of replicas.
* [CHANGE] Move auto-scaling panel rows down beneath logical network path in Reads and Writes dashboards.
* [ENHANCEMENT] Add auto-scaling panels to ruler dashboard.
* [ENHANCEMENT] Add gateway auto-scaling panels to Reads and Writes dashboards.
* [ENHANCEMENT] Add query-frontend and ruler-query-frontend auto-scaling panels to Reads and Ruler dashboards.
* [ENHANCEMENT] Alertmanager dashboard: display active aggregation groups
* [ENHANCEMENT] Dashboards: Add read path insights row to the "Mimir / Tenants" dashboard.
* [ENHANCEMENT] Dashboards: distinguish between label names and label values queries.
* [ENHANCEMENT] Dashboards: querier autoscaling now supports multiple scaled objects (configurable via `$._config.autoscale.querier.hpa_name`).
* [ENHANCEMENT] Queries dashboard: remove mention to store-gateway "streaming enabled" in panels because store-gateway only support streaming series since Mimir 2.7.
* [ENHANCEMENT] Queries: Display data touched per sec in bytes instead of number of items.
* [ENHANCEMENT] Ruler: Add panel description for Read QPS panel in Ruler dashboard to explain values when in remote ruler mode.
* [ENHANCEMENT] Support for baremetal deployment for alerts and scaling recording rules.
* [ENHANCEMENT] `_config.job_names.<job>` values can now be arrays of regular expressions in addition to a single string. Strings are still supported and behave as before.
* [ENHANCEMENT] dashboards: fix holes in graph for lightly loaded clusters

# 0.0.6 - March 2023

* [ENHANCEMENT] Add support for kubernetes via Grafana Agent Operator

# 0.0.5 - January 2023

* [BUGFIX] Dashboards: Fix `Rollout Progress` dashboard incorrectly using Gateway metrics when Gateway was not enabled.
* [BUGFIX] Dashboards: Fix legend showing `persistentvolumeclaim` when using `deployment_type=baremetal` for `Disk space utilization` panels.
* [BUGFIX] Dashboards: Remove "Inflight requests" from object store panels because the panel is not tracking the inflight requests to object storage.
* [BUGFIX] Ingester: remove series from ephemeral storage even if there are no persistent series.
* [BUGFIX] Tenants dashboard: Make it compatible with all deployment types.
* [CHANGE] Configuration: The format of the `autoscaling` section of the configuration has changed to support more components.
    * Instead of specific config variables for each component, they are listed in a dictionary. For example, `autoscaling.querier_enabled` becomes `autoscaling.querier.enabled`.
* [CHANGE] Dashboards: Removed the `Querier > Stages` panel from the `Mimir / Queries` dashboard.
* [CHANGE] Move auto-scaling panel rows down beneath logical network path in Reads and Writes dashboards.
* [ENHANCEMENT] Add auto-scaling panels to ruler dashboard.
* [ENHANCEMENT] Add gateway auto-scaling panels to Reads and Writes dashboards.
* [ENHANCEMENT] Configuration: Make it possible to configure namespace label, job label, and job prefix.
* [ENHANCEMENT] Dashboards: Add "remote read", "metadata", and "exemplar" queries to "Mimir / Overview" dashboard.
* [ENHANCEMENT] Dashboards: Add optional row about the Distributor's metric forwarding feature to the `Mimir / Writes` dashboard.
* [ENHANCEMENT] Dashboards: Add read path insights row to the "Mimir / Tenants" dashboard.
* [ENHANCEMENT] Dashboards: Add support to multi-zone deployments for the experimental read-write deployment mode.
* [ENHANCEMENT] Dashboards: Fix legend showing on per-pod panels.
* [ENHANCEMENT] Dashboards: If enabled, add new row to the `Mimir / Writes` for distributor autoscaling metrics.
* [ENHANCEMENT] Dashboards: Include inflight object store requests in "Reads" dashboard.
* [ENHANCEMENT] Dashboards: Include per-tenant request rate in "Tenants" dashboard.
* [ENHANCEMENT] Dashboards: Include rate of label and series queries in "Reads" dashboard.
* [ENHANCEMENT] Dashboards: Make queries used to find job, cluster and namespace for dropdown menus configurable.
* [ENHANCEMENT] Dashboards: Remove the "Instance Mapper" row from the "Alertmanager Resources Dashboard". This is a Grafana Cloud specific service and not relevant for external users.
* [ENHANCEMENT] Dashboards: Updated the "Writes" and "Rollout progress" dashboards to account for samples ingested via the new OTLP ingestion endpoint.
* [ENHANCEMENT] Dashboards: Use a consistent color across dashboards for the error rate.
* [ENHANCEMENT] Dashboards: Use non-red colors for non-error series in the "Mimir / Overview" dashboard.
* [ENHANCEMENT] Dashboards: Use the "req/s" unit on panels showing the requests rate.
* [ENHANCEMENT] Dashboards: improved resources and networking dashboards to work with read-write deployment mode too.
* [ENHANCEMENT] Dashboards: querier autoscaling now supports multiple scaled objects (configurable via `$._config.autoscale.querier.hpa_name`).
* [ENHANCEMENT] Improve phrasing in Overview dashboard.
* [ENHANCEMENT] Support for baremetal deployment for scaling recording rules.
* [FEATURE] Compile baremetal mixin along k8s mixin.
* [FEATURE] Dashboards: Added "Mimir / Overview networking" dashboard, providing an high level view over a Mimir cluster network bandwidth, inflight requests and TCP connections.
* [FEATURE] Dashboards: Added "Mimir / Overview resources" dashboard, providing an high level view over a Mimir cluster resources utilization.
* [FEATURE] Dashboards: Added "Mimir / Overview" dashboards, providing an high level view over a Mimir cluster.

# 0.0.4 - October 2022

* [CHANGE] remove the "Cache - Latency (old)" panel from the "Mimir / Queries" dashboard.
* [FEATURE] Added "Mimir / Overview" dashboards, providing an high level view over a Mimir cluster.
* [FEATURE] added support to experimental read-write deployment mode.
* [ENHANCEMENT] Updated the "Writes" and "Rollout progress" dashboards to account for samples ingested via the new OTLP ingestion endpoint.
* [ENHANCEMENT] Include per-tenant request rate in "Tenants" dashboard.
* [ENHANCEMENT] Include inflight object store requests in "Reads" dashboard.
* [ENHANCEMENT] Make queries used to find job, cluster and namespace for dropdown menus configurable.
* [ENHANCEMENT] Include rate of label and series queries in "Reads" dashboard.
* [ENHANCEMENT] Fix legend showing on per-pod panels.
* [ENHANCEMENT] Use the "req/s" unit on panels showing the requests rate.
* [ENHANCEMENT] Use a consistent color across dashboards for the error rate.
* [ENHANCEMENT] allow to configure graph tooltip.
* [ENHANCEMENT] added support to query-tee in front of ruler-query-frontend in the "Remote ruler reads" dashboard.
* [ENHANCEMENT] Introduce support for baremetal deployment, setting `deployment_type: 'baremetal'` in the mixin `_config`.
* [ENHANCEMENT] use timeseries panel to show exemplars.
* [BUGFIX] stop setting 'interval' in dashboards; it should be set on your datasource.

# 0.0.3 - September 2022

* Update mixin to latest version.

# 0.0.2 - June 2022

* Update documentation to mention the Helm chart metamonitoring feature

# 0.0.1 - June 2022

* Initial release
Cost
By connecting your Self-hosted Grafana Mimir instance to Grafana Cloud, you might incur charges. To view information on the number of active series that your Grafana Cloud account uses for metrics included in each Cloud tier, see Active series and dpm usage and Cloud tier pricing.
Was this page helpful?
Related resources from Grafana Labs


