
Create and manage a Grafana Cloud stack using Ansible
Learn how to add a data source, a dashboard, and a folder to a Grafana Cloud stack using Ansible collection for Grafana.
Before you begin
Before you begin, you should have the following available:
- A Grafana Cloud account.
- Ansible installed on your machine
Create a Cloud stack
Create a Grafana Cloud Access Policy and get a token. You’ll need this for the Ansible playbook to be able to create a Grafana Cloud stack. See Create a Grafana Cloud Access Policy.
Create an Ansible playbook file.
This Ansible playbook will create a Grafana Cloud stack by using the Cloud stack module.
Create a file named
cloud-stack.ymland add the following:- name: Create Grafana Cloud stack connection: local hosts: localhost vars: grafana_cloud_api_key: '<Your Cloud Access Policy token>' stack_name: '<stack-name>' org_name: '<org-name>' tasks: - name: Create a Grafana Cloud stack grafana.grafana.cloud_stack: name: '{{ stack_name }}' stack_slug: '{{ stack_name }}' cloud_api_key: '{{ grafana_cloud_api_key }}' org_slug: '{{ org_name }}' state: presentReplace the following field values:
<token>with a token from the Cloud Access Policy you created in the Grafana Cloud portal.<stack-name>with the name of your stack.<org-name>with the name of the organization in Grafana Cloud.
Create an API key in the Grafana stack
Create an API key in the Grafana stack. You’ll need this key to configure Ansible to be able to create data source, folders, and dashboards.
- Log into your Grafana Cloud instance.
- Click Administration and select API keys.
- Click Add API key.
- In Key name, enter a name for your API key.
- In Role, select Admin or Editor to associate the role with this API key.
- Click Copy to save it for later use.
Add a data source
This guide uses the InfluxDB data source. The required arguments vary depending on the type of data source you select.
Create a file named
data-source.ymland add the following:- name: Add/Update data source connection: local hosts: localhost vars: data_sources: [ { name: '<data-source-name>', type: 'influxdb', url: '<data-source-url>', user: '<username>', secureJsonData: { password: '<password>' }, database: '<db-name>', id: <id>, uid: '<uid>', access: 'proxy', }, ] grafana_api_key: '<API-Key>' stack_name: '<stack-name>' tasks: - name: Create/Update Data sources grafana.grafana.datasource: datasource: '{{ item }}' stack_slug: '{{ stack_name }}' grafana_api_key: '{{ grafana_api_key }}' state: present loop: '{{ data_sources }}'Replace the following field values:
<data-source-name>with the name of the data source to be added in Grafana.<data-source-url>with URL of your data source.<username>with the username for authenticating with your data source.<password>with the password for authenticating with your data source.<db-name>with name of your database.<id>with the ID for your data source in Grafana.<uid>wth the UID for your data source in Grafana.<stack-name>with the name of your stack.<API-key>with the API key created in the Grafana instance.
Add a folder
This Ansible playbook creates a folder in your Grafana instance by using the Folder module.
Create a file named
folder.ymland add the following:- name: Add/Update Folders connection: local hosts: localhost vars: folders: [{ title: '<folder-name>', uid: '<uid>' }] stack_name: '<stack-name>' grafana_api_key: <API-key> tasks: - name: Create/Update a Folder in Grafana grafana.grafana.folder: title: '{{ item.title }}' uid: '{{ item.uid }}' stack_slug: '{{ stack_name }}' grafana_api_key: '{{ grafana_api_key }}' state: present loop: '{{ folders }}'Replace the following field values:
<folder-name>with the name of the folder to be added in Grafana.<uid>with the UID for your folder in Grafana.<stack-name>with the name of your stack.<API-key>with the API key created in the Grafana instance.
Add a dashboard to the folder
This Ansible playbook iterates through the dashboard JSON source code files in the folder referenced in dashboards_path and adds them in the Grafana instance by using the Dashboard module.
Create a file named
dashboard.ymland add the following:- name: Add/Update Dashboards connection: local hosts: localhost vars: dashboards_path: <path-to-dashboard-files> # Example "./dashboards" stack_name: "<stack-name>" grafana_api_key: <API-key> tasks: - name: Find dashboard files find: paths: "{{ dashboards_path }}" file_type: file recurse: Yes patterns: "*.json" register: files_matched no_log: True - name: Create list of dashboard file names set_fact: dashboard_file_names: "{{ dashboard_file_names | default ([]) + [item.path] }}" loop: "{{ files_matched.files }}" no_log: True - name: Create/Update a dashboard grafana.grafana.dashboard: dashboard: "{{ lookup('ansible.builtin.file','{{ item }}' ) }}" stack_slug: "{{ stack_name }}" grafana_api_key: "{{ grafana_api_key }}" state: present loop: "{{ dashboard_file_names }}"Replace the following field values:
<path-to-dashboard-files>with the path to the folder containing dashboard JSON source code files.<stack-name>with the name of your stack.<API-key>with the API key created in the Grafana instance.
Run the Ansible playbooks
In a terminal, run the following commands from the directory where all of the Ansible playbooks are located.
To create the Grafana Cloud stack.
ansible-playbook cloud-stack.ymlTo add a data source to the Grafana stack.
ansible-playbook data-source.ymlTo add a folder to the Grafana stack
ansible-playbook folder.ymlTo add a dashboard to the folder in your Grafana stack.
ansible-playbook dashboard.yml
Validation
Once you run the Ansible playbooks, you should be able to verify the following:
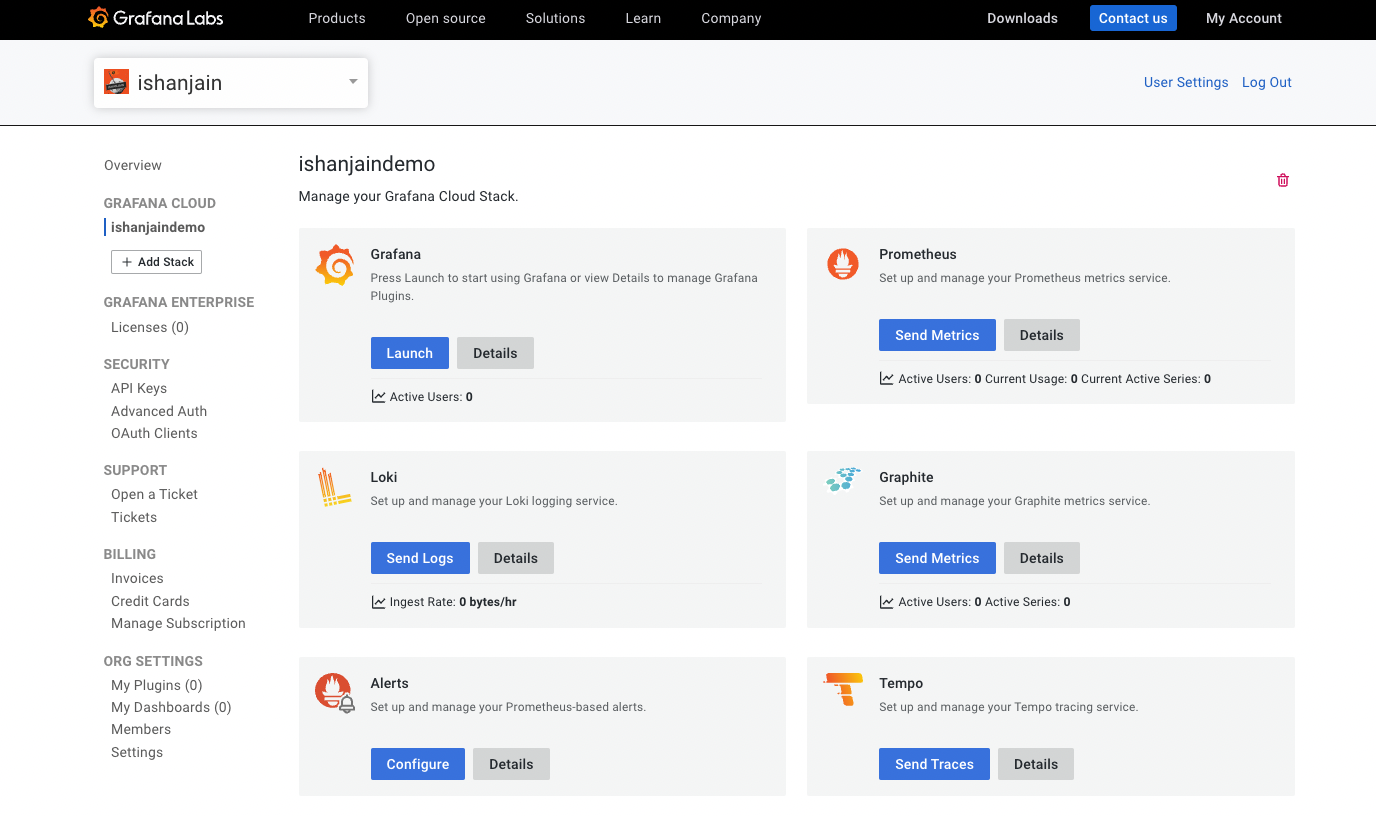
The new Grafana stack is created and visible in the Cloud Portal.
![Cloud Portal]()
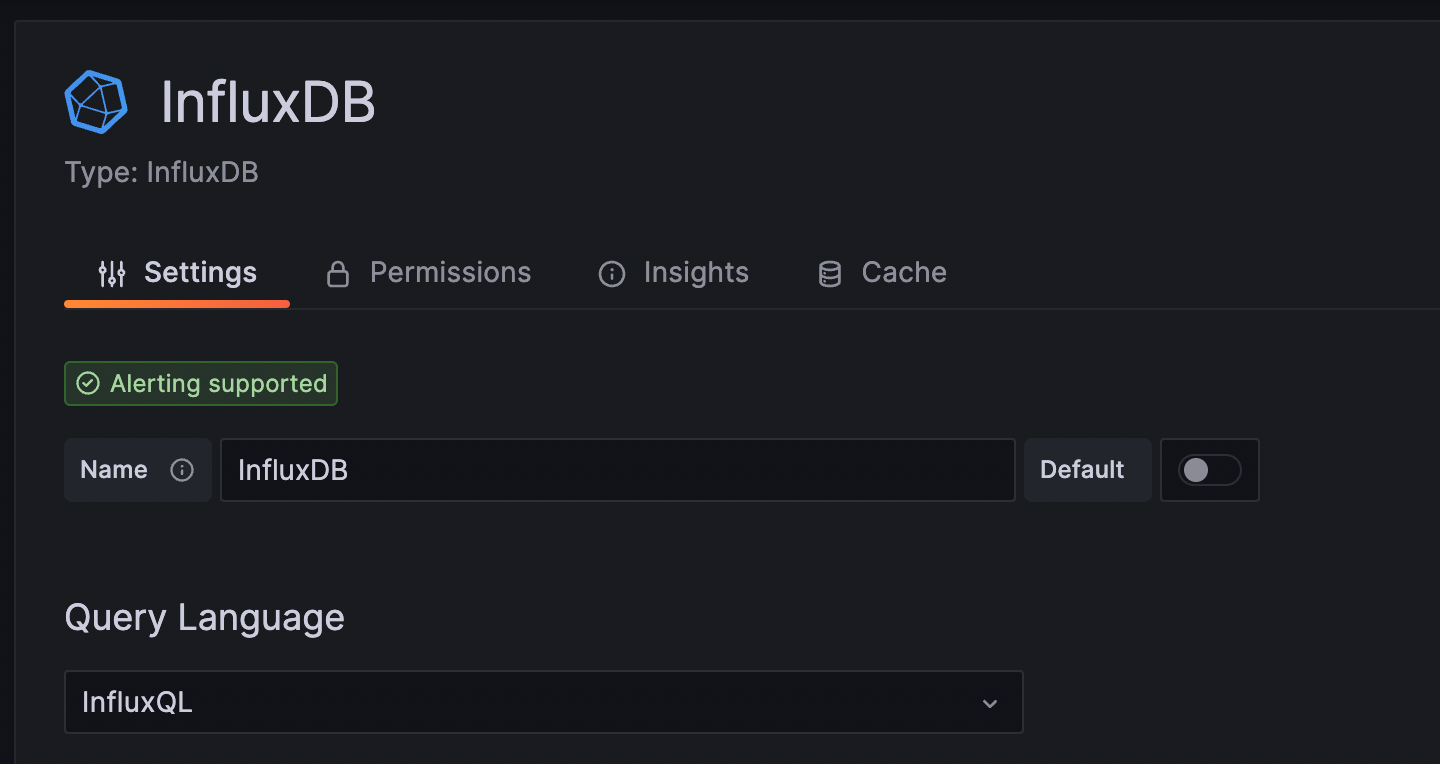
A new data source (InfluxDB in this example) is visible in the Grafana stack.
![InfluxDB datasource]()
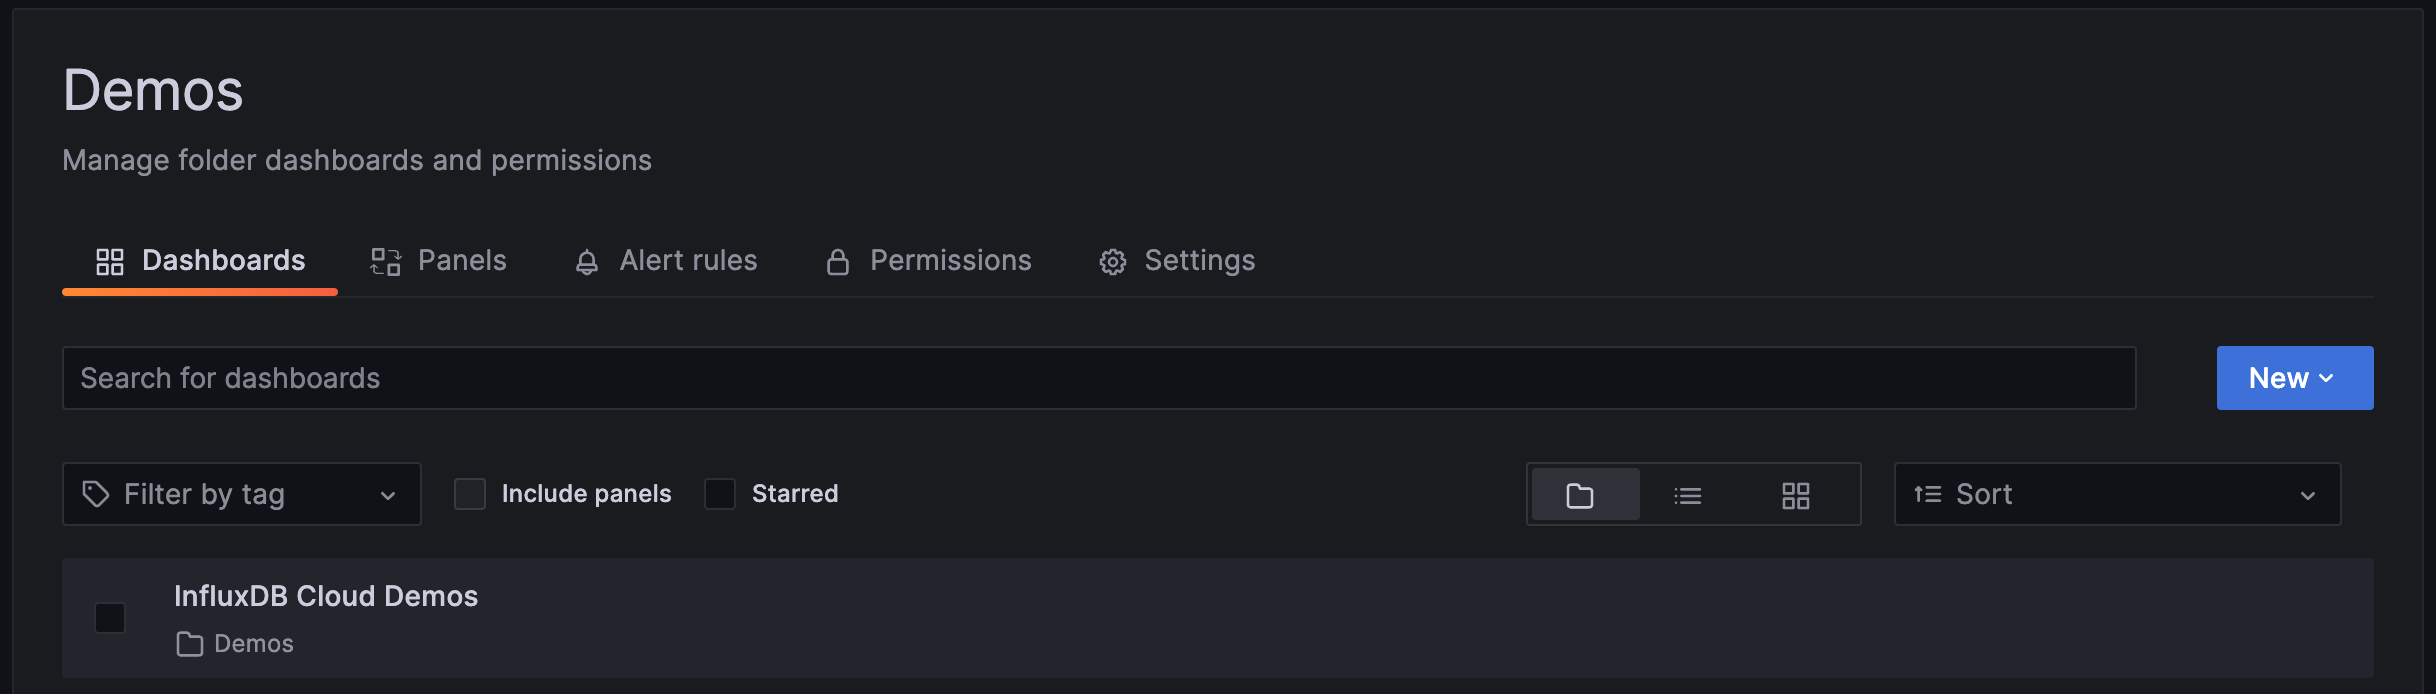
A new folder in Grafana. In the following image, a folder named
Demoswas added.![Folder]()
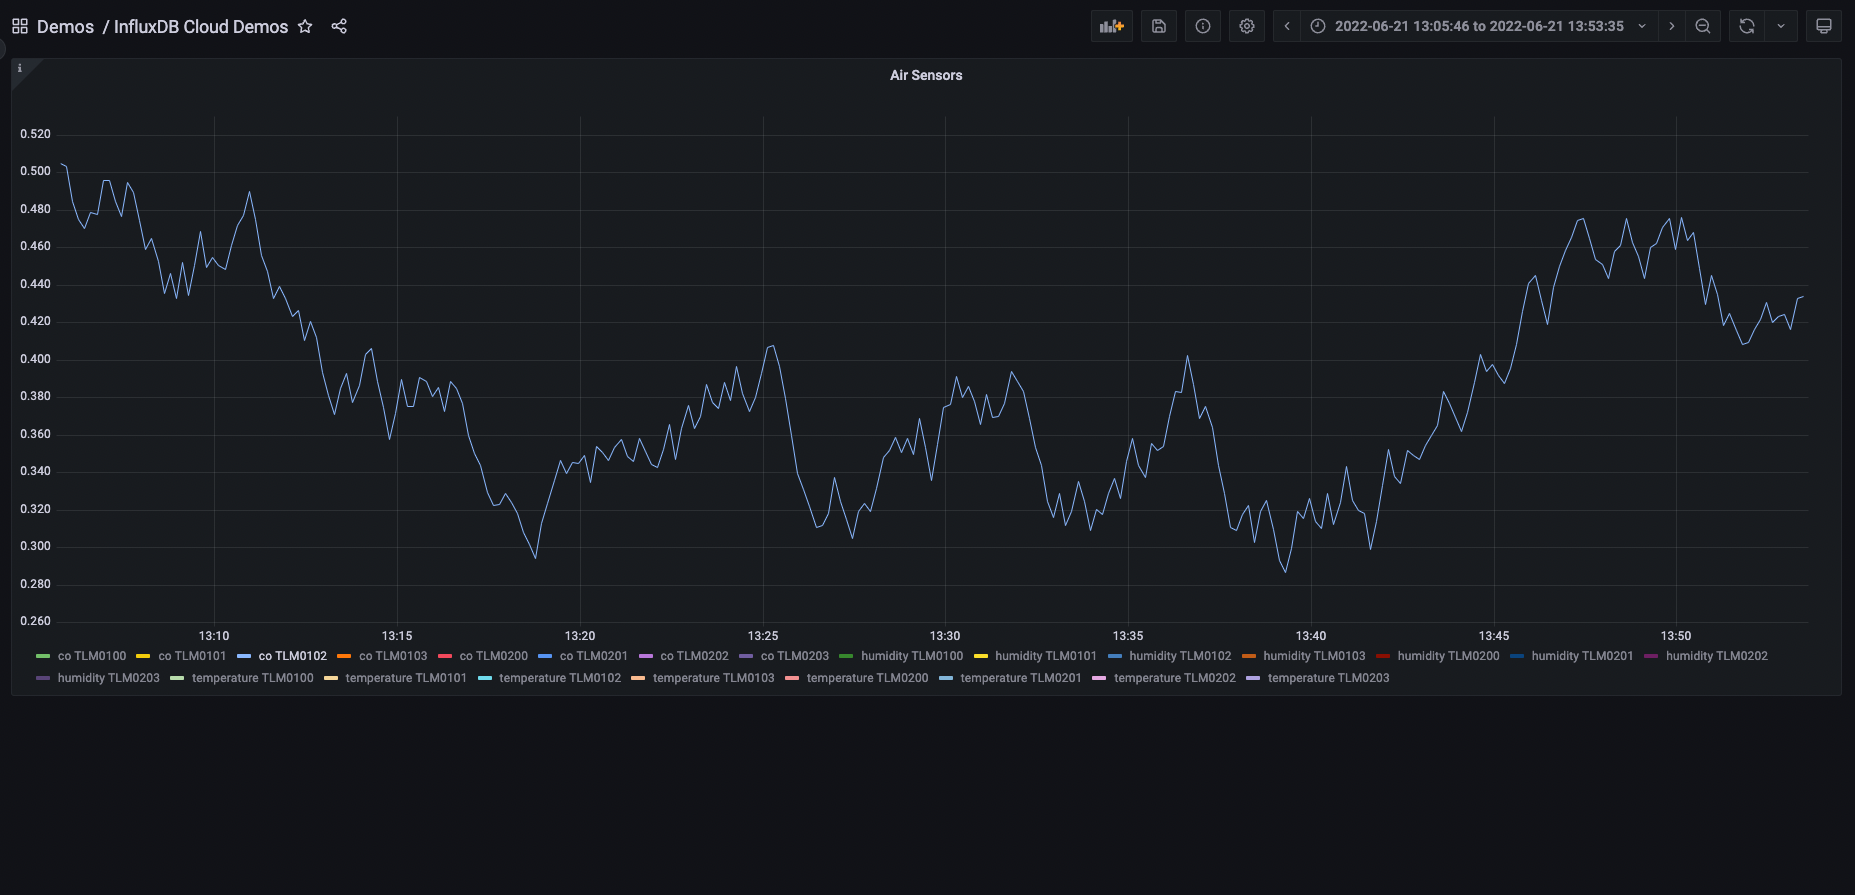
A new dashboard in the Grafana stack. In the following image a dashboard named
InfluxDB Cloud Demoswas created inside the “Demos” folder.![InfluxDB dashboard]()
Summary
In this guide, you created a Grafana Cloud stack along with a data source, folder, and dashboard imported from a JSON file using Ansible.
To learn more about managing Grafana using Ansible, refer to the Grafana Ansible collection.
Was this page helpful?
Related resources from Grafana Labs


