
Monitor Prometheus for ingest errors
There are a few places to look for problems and errors when sending metrics to Grafana Cloud.
- The Grafana Cloud billing and usage dashboard available by default and shows ingest errors.
- Both Prometheus and the Grafana Agent log errors, where there are internal metrics you can look out for.
Problems and solutions are described below.
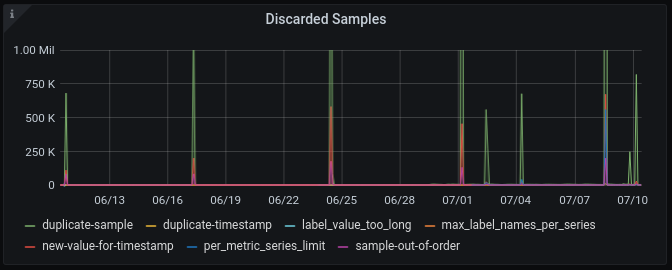
Usage dashboard
The bottom-right graph shows Discarded Samples aggregated by reason.
It queries the metric grafanacloud_instance_samples_discarded from the grafanacloud-usage data source.
This can help you detect problems, but sometimes you’ll need to do a bit of investigation on your side to locate the source of the issue. See the details below in the Ingest problems section.
If you are hitting rate limits or number limits, please contact Grafana Labs support.
See Usage monitoring for more information about the Grafana Cloud billing and usage dashboard.
Prometheus internal metrics
Prometheus exposes internal metrics on its /metrics endpoint on port 9090 by default.
Make sure to scrape this.
https://prometheus.io/docs/prometheus/latest/getting_started/#configuring-prometheus-to-monitor-itself
The metrics to look for (and probably configure an alert for) are:
| Metric | Type | Help |
|---|---|---|
prometheus_remote_storage_failed_samples_total | counter | Total number of samples which failed on send to remote storage. |
prometheus_remote_storage_dropped_samples_total | counter | Total number of samples which were dropped due to the queue being full. |
prometheus_remote_storage_queue_length | gauge | The number of processed samples queued to be sent to the remote storage. |
prometheus_remote_storage_sent_batch_duration_seconds | histogram | Duration of sample batch send calls to the remote storage. |
prometheus_remote_storage_succeeded_samples_total | counter | Total number of samples successfully sent to remote storage. |
There are also some metrics from the go-conntrack library for monitoring HTTP connections.
https://gitlab.cncf.ci/prometheus/prometheus/commit/6a633eece19a782cfeddac435b60c1a7abc2488a
| Metric | Type | Help |
|---|---|---|
net_conntrack_dialer_conn_attempted_total{dialer_name="remote_storage"} | counter | Total number of connections attempted by the given dialer a given name. |
net_conntrack_dialer_conn_closed_total{dialer_name="remote_storage"} | counter | Total number of connections closed which originated from the dialer of a given name. |
net_conntrack_dialer_conn_established_total{dialer_name="remote_storage"} | counter | Total number of connections successfully established by the given dialer a given name. |
net_conntrack_dialer_conn_failed_total{dialer_name="remote_storage"} | counter | Total number of connections failed to dial by the dialer a given name. This is broken down by reason: refused, resolution, timeout or unknown. |
Prometheus logs
There are small logs recording remote_write activity in Prometheus logs.
Failed authentication is logged, but other problems are exposed through internal metrics (see above).
Ingest problems
You may face some issues when sending metrics to Grafana Cloud. For example, hitting some limits or getting failed authentication errors. This section explains the most common errors you may encounter and how to fix them.
Per-metric series limit
The default per-metric series limit is 20k. This is also known as the max cardinality per metric, or the max number of different label values combinations a single metric can have. Grafana Labs support will usually increase this limit after communicating with you, unless this is really a misconfiguration.
From Prometheus best practices on Labels:
Caution
Remember that every unique combination of key-value label pairs represents a new time series, which can dramatically increase the amount of data stored. Do not use labels to store dimensions with high cardinality (many different label values), such as user IDs, email addresses, or other unbounded sets of values. https://prometheus.io/docs/practices/naming/#labels
Per-user series limit
The default active series limit per user is 150k. This is mostly to protect the cloud platform against misconfigured clients. If you receive an email notification that you have reached your account limit and you need a limit increase, contact support.
Max label names per series
You may set up to 40 label names per series. However, Grafana Labs recommends setting fewer than 30 to prevent performance problems.
Greater than max sample age
Grafana Cloud will reject samples older than 1 hour with “out of bounds” error.
Rate limited
There is a soft cap at 25K datapoints per seconds. This is mostly to protect the cloud platform against misconfigured clients. Grafana Labs support will usually increase this limit after communicating with you.
Failed authentication
This error will not show up on the Discarded Samples graph,
but you can detect it by monitoring Prometheus logs or the internal metric prometheus_remote_storage_failed_samples_total.
Below is a sample Prometheus client error log message for Invalid token. Ensure you have the correct scope, metrics:write, and a realm for the stack you wish to write metrics to:
ts=2020-06-30T17:25:45.255Z caller=dedupe.go:112 component=remote level=error remote_name=c78ed9 url=https://prometheus-us-central1.grafana.net/api/prom/push msg="non-recoverable error" count=100 err="server returned HTTP status 401 Unauthorized: {\"status\": \"error\", \"error\": \"Invalid token\"}"Slow requests
Grafana Cloud enforces a maximum time allowed to receive the HTTP request body. This timeout is enforced for any request, including Prometheus requests to write metrics to Grafana Cloud, and is used to protect the system from abuse. The default timeout is configured to be long enough to give clients the time to send the request, and it shouldn’t be reached in normal conditions.
In the event a client is very slow sending the HTTP request body, or it hangs while sending the request, and the timeout is reached, Grafana Cloud may return the custom HTTP status code 598.
Was this page helpful?
Related resources from Grafana Labs


