
Application Performance Overview
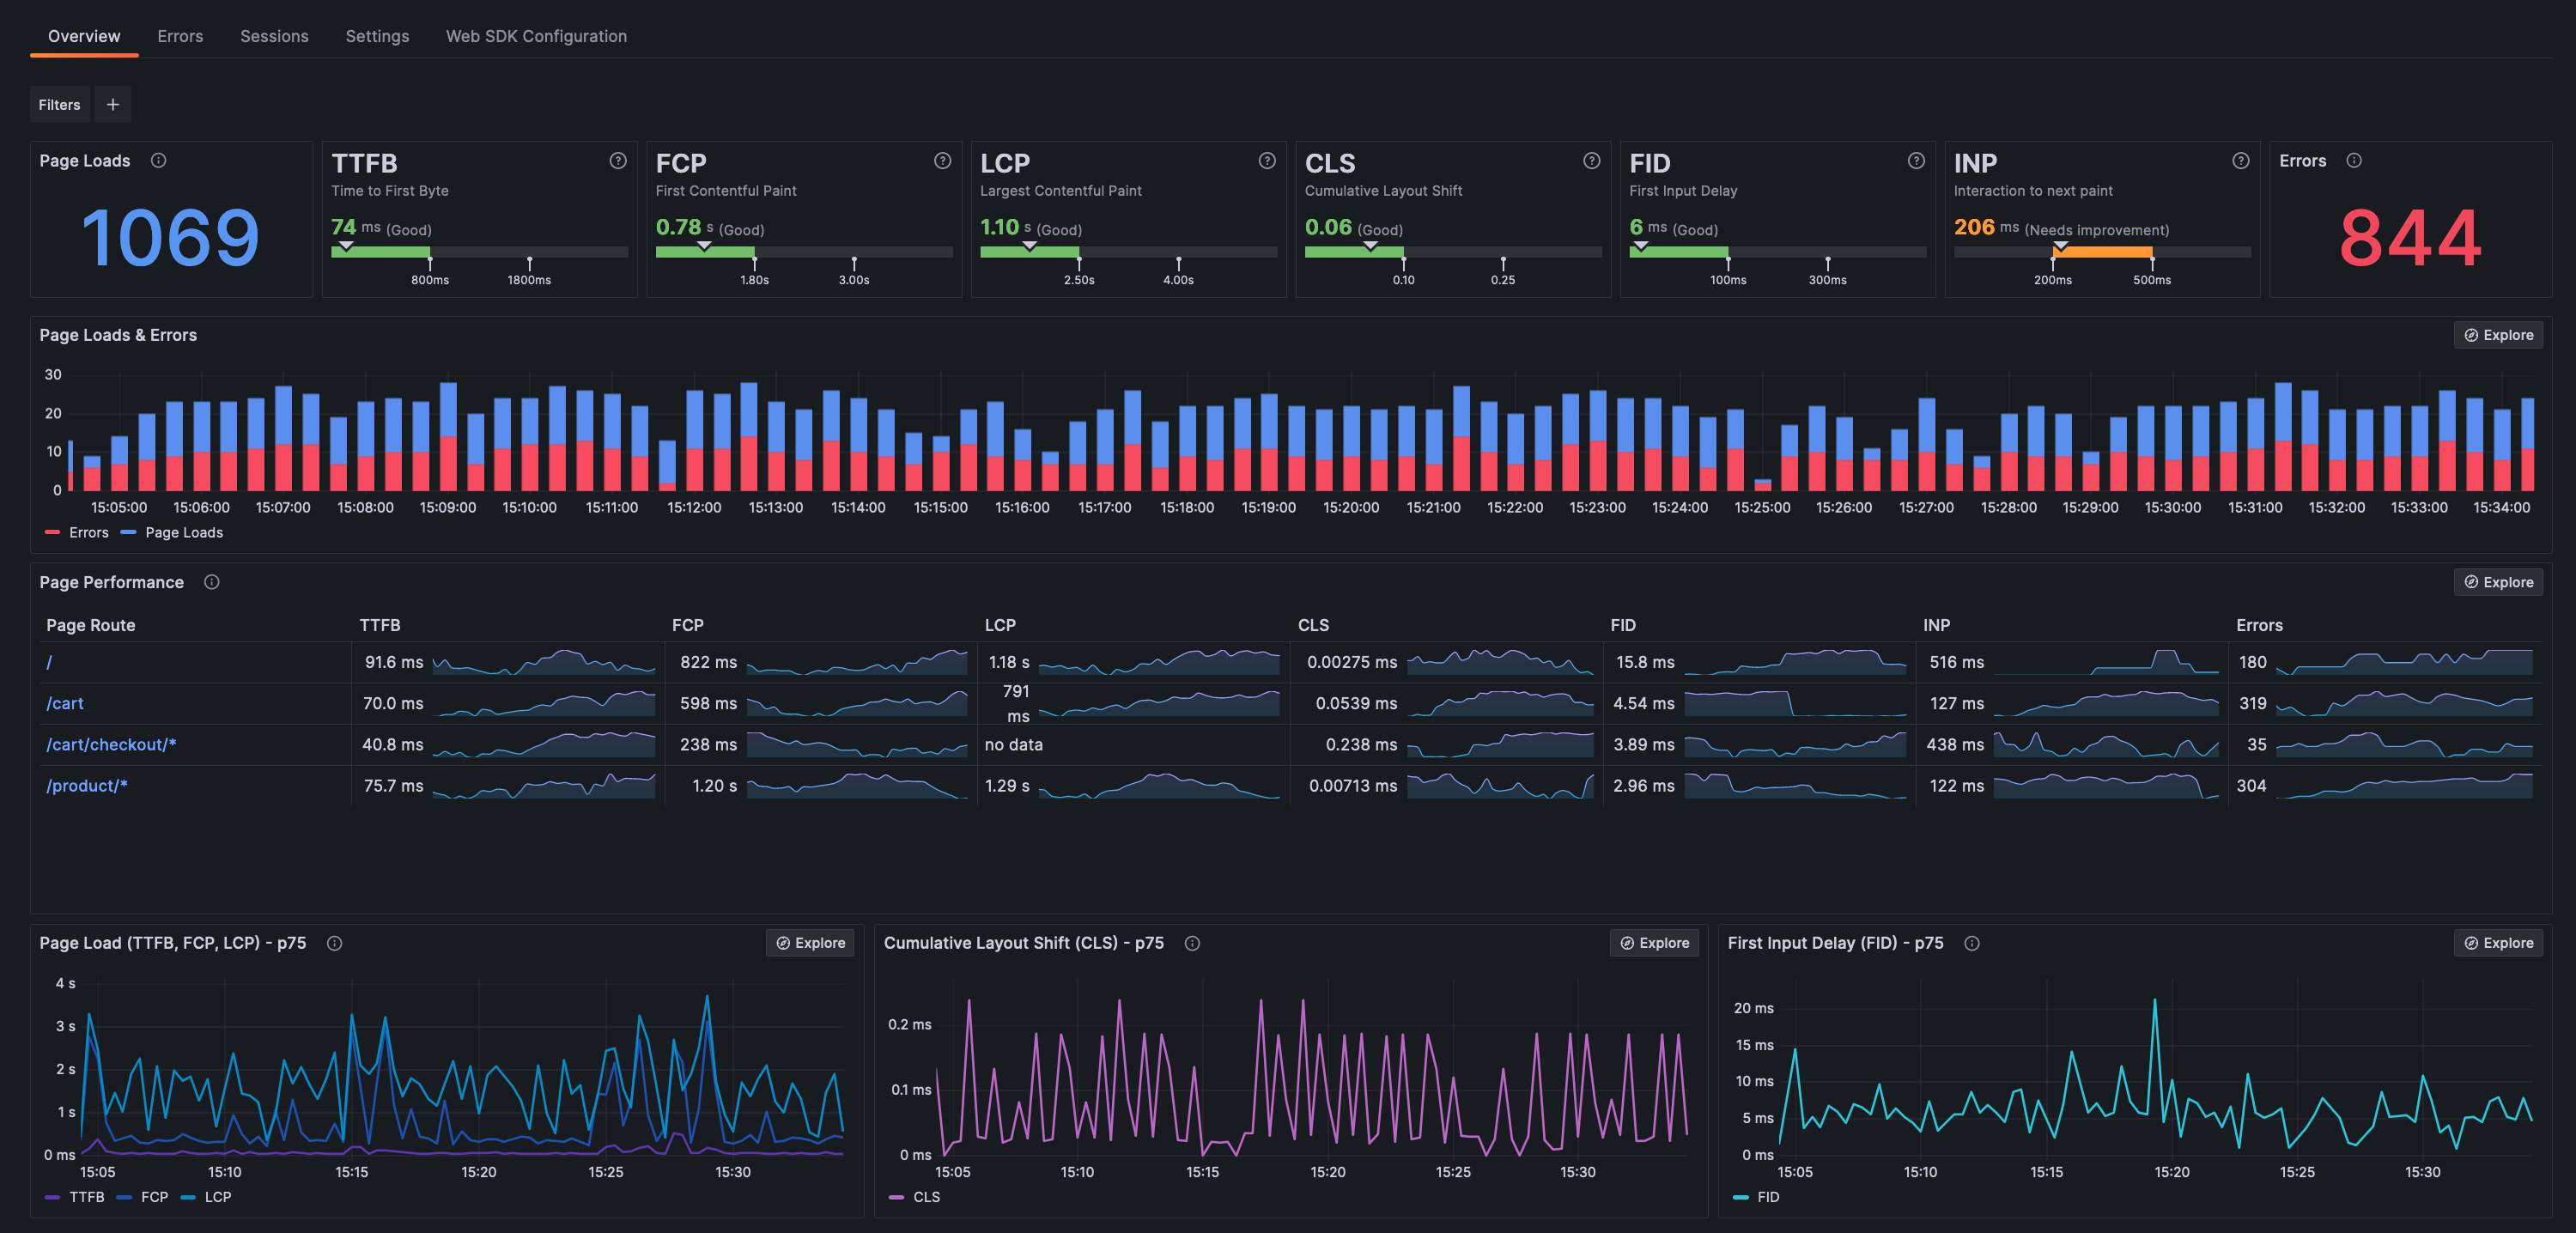
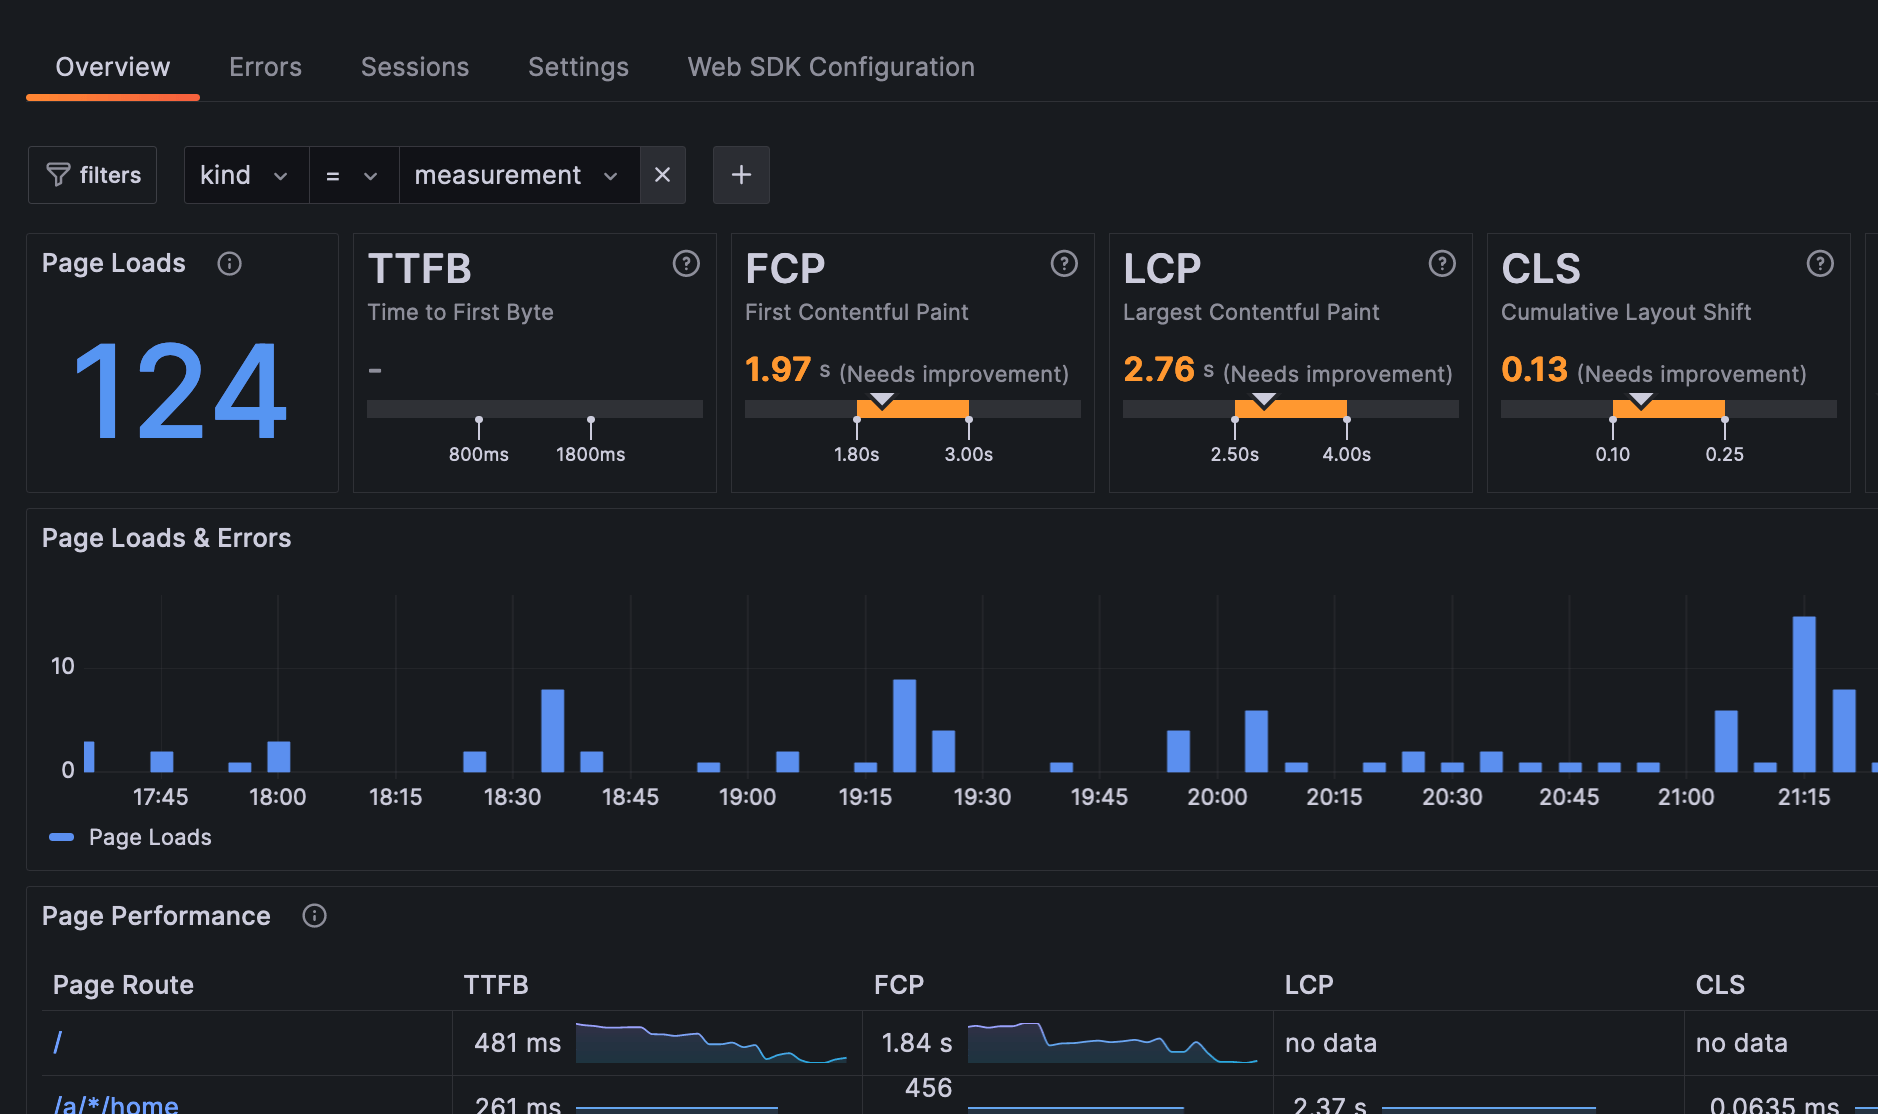
The Application Performance Overview page is a very useful tool when you want to verify that your application is running smoothly and drill down to specific timeframes that you want to identify issues in.
When opening the page there a couple of things you should look for:
- Web Vitals have healthy values (Green)
- Page Loads do not have any spikes (low or high)
- Errors are 0 or below an expected threshold
- P75 graphs do not have any spikes
Filters
On the top right, there is a set filters you can use that allow you to:
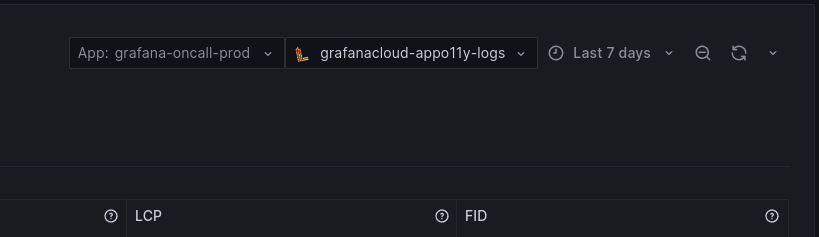
- Select a different app to view
- Change the datasource (useful for custom setups)
- Change time frame like you would normally in a Grafana dashboard
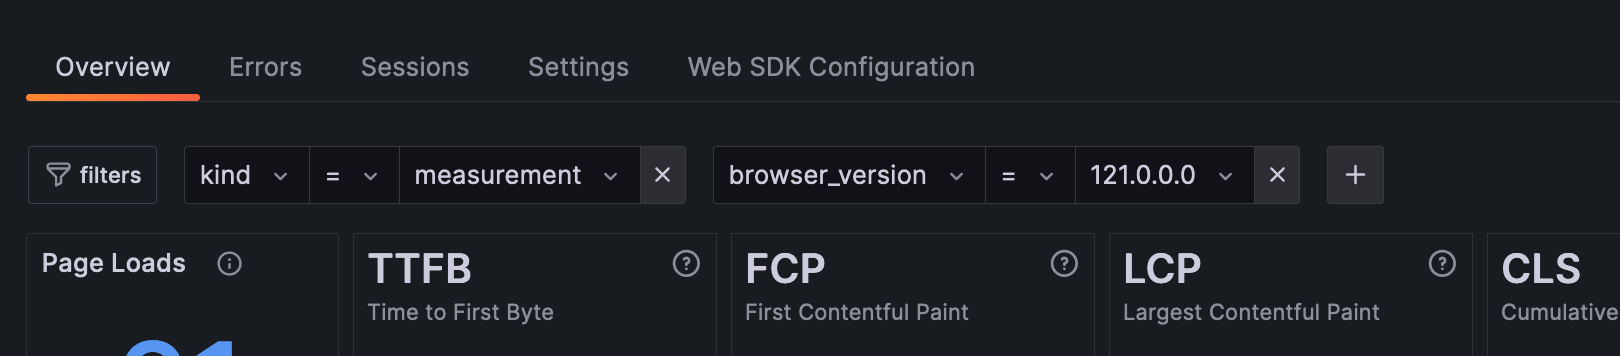
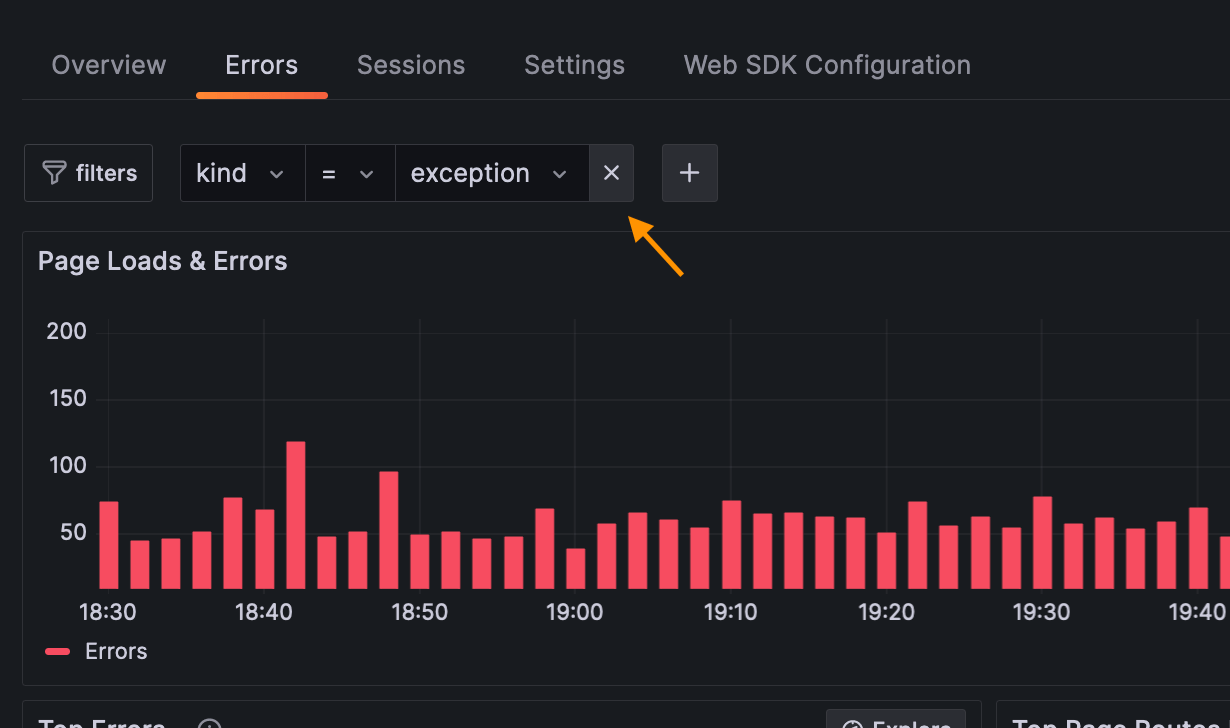
On the top left, there is a more complex filtering system that allows you to narrow down the information exposed. With it, you can slice and dice your data based on the meta-information, provided by the SDK.
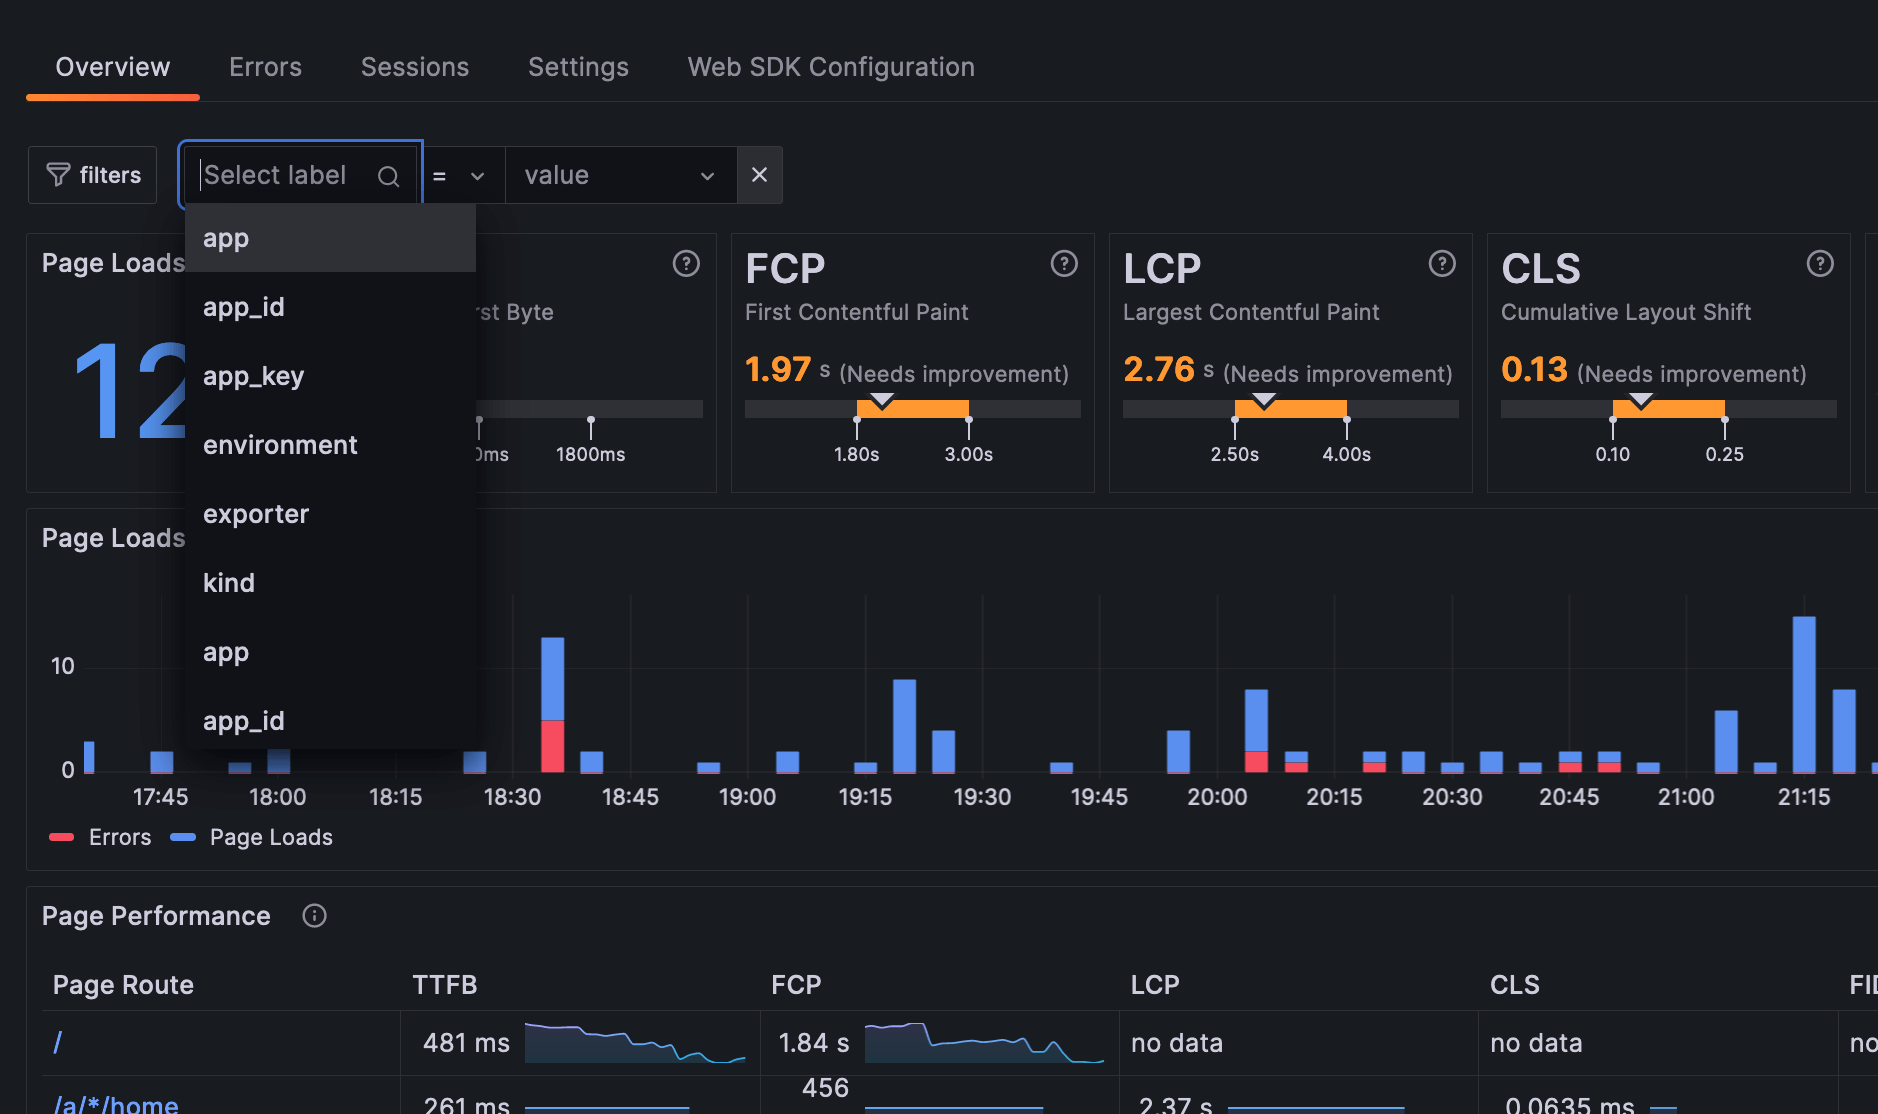
Adding a meta filter
To add a meta filter:
- Click the ‘+’ button
- Select the meta label that you want from the dropdown
- Select the value from the dropdown
To edit a meta filter value:
- Click the value of the filter you want to change
- Select the new value from the dropdown
To remove a meta filter
- Click the label of the filter you want to remove
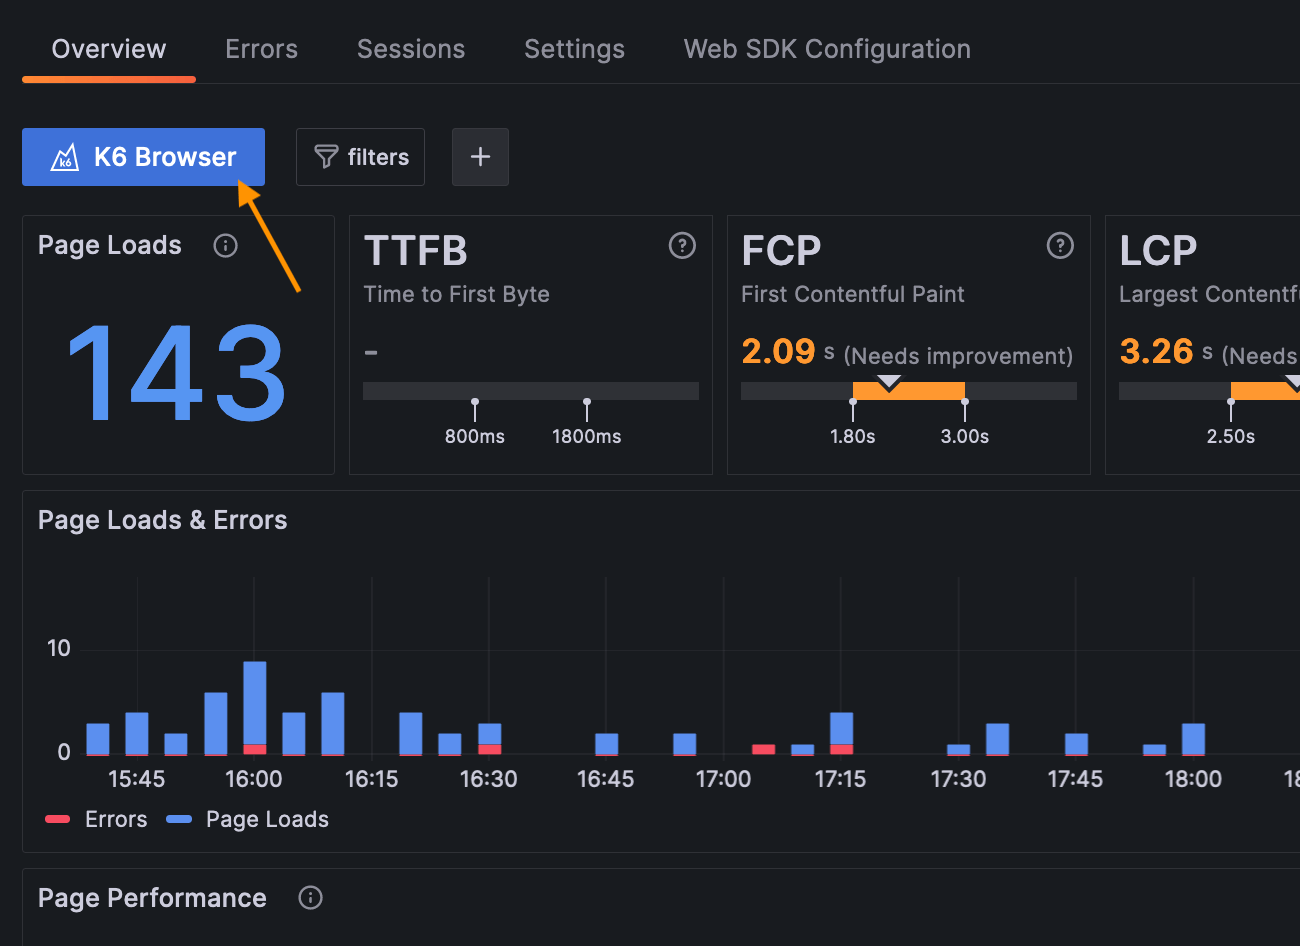
k6 browser performance overview
To enable the ability to review both lab and field data in web performance monitoring and testing, Frontend Observability offers a way to view your k6 browser generated telemetry isolated from the real user data.
If your web app is instrumented with the Faro Web SDK and you are running tests with k6 Browser, you automatically have this data tagged with a k6_isK6Browser flag attribute in your telemetry.
To view the k6 Browser generated data:
- Navigate to the Application Performance Overview page
- On the top left, click on the k6 Browser button
Was this page helpful?
Related resources from Grafana Labs


