
Metrics-generator in Grafana Cloud Traces
The Tempo metrics-generator can derive metrics from traces as they are ingested. When used in Grafana Cloud, the metrics-generator writes metrics directly to the hosted Prometheus instance in the same stack.

For more information about the metrics-generator and the metrics it creates, see Grafana Tempo | Metrics-generator. This document describes the Grafana Cloud-specific capabilities.
Note
Metrics generation is disabled by default. Contact Grafana Support to enable metrics generation for your organization!
Constraints and good to know
- The active series sent to the hosted Prometheus instance is billed like regular metrics.
- Metrics can only be sent to a hosted Prometheus instance in the same region.
- If traces are down-sampled before reaching Tempo, the metrics will be lower than reality.
- All generated metrics are aggregated by default.
Aggregated metrics
Grafana Cloud uses Adaptive Metrics to aggregate away operational labels added by the open source Tempo metrics generator. This reduces the number of time series produced by the metrics generator, and therefore reduces the cost of enabling metrics generation for Grafana Cloud users.
In most cases, this aggregation should be completely unnoticeable to users.
There are some notable points to take into account:
- Both the
trace_spanmetrics_*andtrace_service_graph_*metric families are aggregated. - The label that is aggregated away is the
__metrics_gen_instancelabel. The aggregation function used issum:counter. - PromQL queries to metrics generated from traces must follow the same rules as queries to any aggregated metric. For more information, see below.
- The metrics are produced at a resolution consistent with the resolution you’ve purchased. If you are on a 1 data-point-per-minute plan, the metrics-generator metrics have 1 data point per minute.
For PromQL, form queries that take into account the aggregation. For example, this query isn’t valid:
traces_spanmetrics_calls_totalIf you run this query, Grafana returns the following error message:
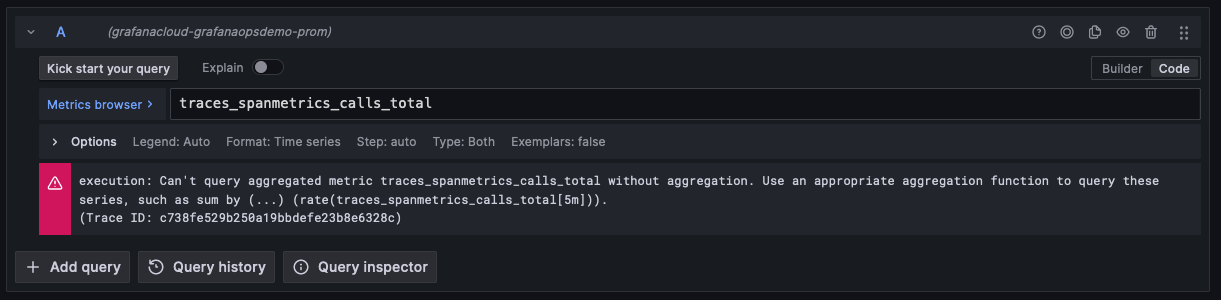
Instead, rewrite the query assuming aggregation, such as the sum of rate over time:
sum(rate(traces_spanmetrics_calls_total[4m]))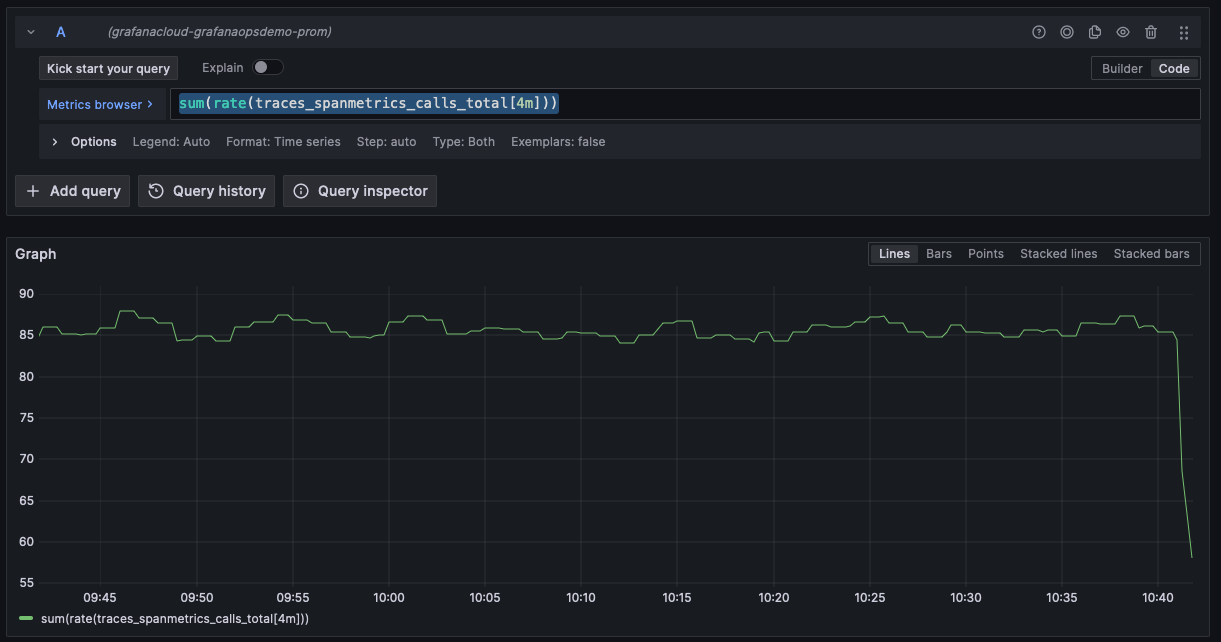
Queries such as the following are also invalid because they assume a return of two instance vectors prior to creating a range vector:
sum by (service, span_name)(rate(traces_spanmetrics_calls_total{status_code="STATUS_CODE_ERROR"}[4m]) / rate(rate(traces_spanmetrics_calls_total{status_code="STATUS_CODE_ERROR"}[4m])))However, you can modify these queries to explicitly use aggregated metrics by ensuring two range vectors are used instead:
(sum by (service, span_name)(rate(traces_spanmetrics_calls_total{status_code="STATUS_CODE_ERROR"}[4m])) / (sum by (service, span_name)(rate(traces_spanmetrics_calls_total{status_code!=""}[4m]))))Refer to Troubleshoot your aggregated metrics query for more help on how to query aggregated metrics.
Finally, if you require the unaggregated metrics generated by Grafana Cloud Traces, contact Grafana Support for help removing the aggregation rules from Adaptive Metrics.
Monitor the metrics-generator
The grafanacloud-usage data source exposes several metrics about the metrics-generator.
Amount of active series:
grafanacloud_traces_instance_metrics_generator_active_series{}Amount of active series being limited:
grafanacloud_traces_instance_metrics_generator_series_dropped_per_second{}Amount of spans that are discarded by the metrics-generator before the spans are processed:
grafanacloud_traces_instance_metrics_generator_discarded_spans_per_secondThis metric has a reason label:
outside_metrics_ingestion_slack: The time between the creation of the span and when it was ingested was too large and the span is deemed outdated. Processing this span and including it a current metrics sample would skew the data.
How this works
When the amount of active series in Tempo reaches a configurable limit, no new active series are added. Grafana Cloud Traces keeps updating the existing series. The series exceeding the limit are dropped.
Configuration options
You can configure the following settings for metrics-generator in Grafana Cloud Traces. Contact Grafana Support to modify any of these settings.
| Configuration | Description |
|---|---|
| Enabled processor | The metrics processors to enable; options include service graphs and/or span metrics. |
| Max active series | The maximum amount of active series. |
| Collection interval | How often samples are collected from the active series. Defaults to every 60s or 1 DPM. |
| Histogram buckets | The buckets used for the histograms generated by the metrics-generator. This can be configured per processor. |
| Dimensions | Additional dimensions to be added to the generated metrics. If this dimension is present in the span attributes, it’s included as a label in the metrics. This can be configured per processor. |
Note
Characters that aren’t valid Prometheus labels are sanitized. For example, the trace attributek8s.namespacebecomes the Prometheus labelk8s_namespace.
Was this page helpful?
Related resources from Grafana Labs


