
Graphite aggregation in Grafana Cloud
Aggregation is used to reduce the volume of datapoints across time, across series, or both. For example, you may use aggregations to smooth the lines being shown on a graph, improve query performance, or summarize data across hosts.
Points can be aggregated in two dimensions:
Horizontal aggregation - Aggregating points for a single series across time. Multiple successive points are reduced to single points, using a certain mathematical function. For example, for a series with a point emitted every second that needs to be aggregated to a
5sinterval, every five points will be aggregated together using a function such asaverage,min,max,count, orlast.Vertical aggregation - Aggregating points for multiple series. At each interval, the points for all the series are reduced into a single point.
Aggregation stages
When ingesting and querying Graphite metrics in Grafana Cloud, aggregation can happen at multiple stages. Most of these stages behave in a similar way to native Graphite.
The examples below query for the metrics that carbon-relay-ng emits by default. The configurations and queries in the examples are artificially made up to demonstrate aggregation behavior rather than recommended configurations and queries.
If you want to run the example queries, click here to download a dashboard JSON file that contains all of the queries. Import the file into your Grafana instance following the import a dashboard instructions.
carbon-relay-ng aggregators
Using carbon-relay-ng is the recommended way to ingest Graphite metrics into Grafana Cloud. carbon-relay-ng can aggregate points both horizontally and vertically before submitting them to Grafana Cloud.
Schema files and rollups
Schema files define how data is horizontally aggregated into “rollups” before the Graphite query functions process the aggregated data.
There are two files you can configure:
storage-schemas.conf- This controls the aggregation interval. You can specify multiple aggregation intervals, with larger intervals for older data.storage-aggregation.conf- This controls the aggregation method used to reduce the points in the interval to a single point.
Grafana Cloud stores the raw data ingested for the entire retention period. This is different from native Graphite which stores the aggregated data. If you change the schema files in Grafana Cloud, they will be applied retroactively to data ingested before the schema files were changed.
More information about these files and how to update them can be found in the Schemas and HTTP API documentation.
Rollup points budget
An additional configuration for the interval of a rollup is the max rollup points budget. If there are too many points when using a rollup with the original interval, the interval is increased to reduce the number of points. This configuration is set internally within Grafana Cloud.
How the points budget works is explained in the Graphite querier documentation.
Legacy instance upload restrictions
If your Graphite instance was created before July 2021, you may be restricted from changing your schema files. This is because your instance was migrated from an older version of Cloud Graphite (v4). Version 4 did not allow the schema files to be directly changed by users, so we preserved this legacy behavior for migrated v4 instances.
As part of the migration, data was copied over from the v4 instance to the newer instance. The newer version of Cloud Graphite stores all samples without downsampling for the entirety of the retention period. Version 4 did on-disk downsampling based on the intervals from the storage-schemas.conf and aggregated the samples in the interval based on storage-aggregation.conf. Anything backfilled from your v4 instance is only available in the downsampled form.
This means:
- If you are restricted from changing your schema files, the
storage-schemas.confcurrently applied to your instance has theintervalsfield set to prevent backfilled data from being queried with lower intervals than is possible. For more information about the intervals field, see the schemas documentation. If you want to start uploading your own schema files, it is recommended to keep thisintervalsfield setting. - Schema file changes are only applied retroactively without any loss of information to samples ingested after your instance was migrated from v4.
Examples
Intervals aggregated with sum
If you’re using carbon-relay-ng to send metrics, by default it will emit carbon-relay-ng.stats.*.stats.graphite.connected.gauge1 every 10 seconds with a constant value of 1.
Assuming the following storage-schemas.conf rule is used:
[carbon_relay_ng_connected_example]
pattern = carbon-relay-ng.stats.*.stats.graphite.connected.gauge1
retentions = 10s:10m,1m:1d
and the following storage-aggregation.conf rule is used:
[carbon_relay_ng_connected_example]
pattern = carbon-relay-ng.stats.*.stats.graphite.connected.gauge1
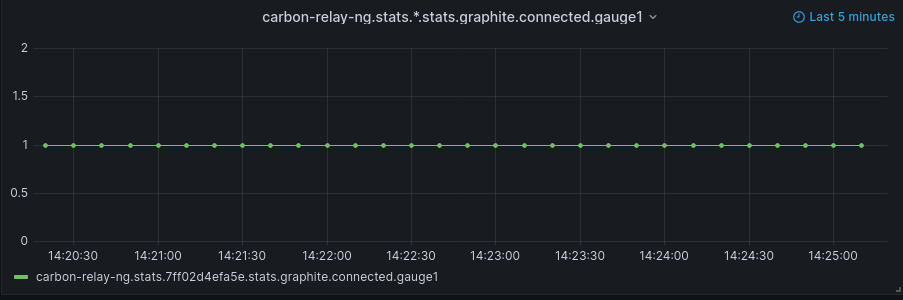
aggregationMethod = sumThe first retention is 10s:10m. This means queries for data within the last 10 minutes will be returned with an interval of 10 seconds. The graph below uses the query carbon-relay-ng.stats.*.stats.graphite.connected.gauge1 in the past five minutes, so each result series has 1 point every 10 seconds. The value of each point is 1, as the retention interval matches the ingestion interval, so no horizontal aggregation is done.
The second retention is 1m:1d. This means queries for data within the last day will be returned with an interval of 1 minute. The graph below uses the query carbon-relay-ng.stats.*.stats.graphite.connected.gauge1 in the past fifteen minutes, so each result series has 1 point every minute. The retention interval is 6 times larger than the ingestion interval. This means 6 points are horizontally aggregated into a single point. The value of each point is 6. aggregationMethod = sum for these series, so we sum the values of the 6 raw datapoints in every interval.

Only one rollup interval is used per metric for a query.
When querying for the last 15 minutes, the data from the last 10 minutes will use the 1m interval from the 1m:1d retention rather than the 10s interval from the 10s:10m retention because we are also querying for data older than 10 minutes.
Intervals aggregated with avg
If you’re using carbon-relay-ng to send metrics, by default it will emit carbon-relay-ng.stats.*.stats.graphite.write_queue.size.gauge32 every 10 seconds.
Assuming the following storage-schemas.conf rule is used:
[carbon_relay_ng_connected_example]
pattern = carbon-relay-ng.stats.*.stats.graphite.write_queue.size.gauge32
retentions = 10s:10m,1m:1d
and the following storage-aggregation.conf rule is used:
[carbon_relay_ng_connected_example]
pattern = carbon-relay-ng.stats.*.stats.graphite.write_queue.size.gauge32
aggregationMethod = average
The storage-schemas.conf rule is the same as for the metric in Intervals aggregated with sum, but storage-aggregation.conf is different. In this example, aggregationMethod = average.
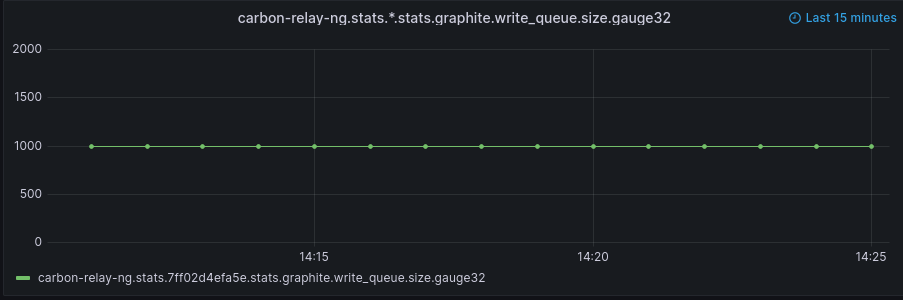
The graph below queries for carbon-relay-ng.stats.*.stats.graphite.write_queue.size.gauge32 in the past five minutes. Similar to the previous example, each result series has 1 point every 10 seconds. Because the retention interval matches the ingestion interval, no horizontal aggregation is done.

The graph below queries for carbon-relay-ng.stats.*.stats.graphite.write_queue.size.gauge32 in the past 15 minutes, so each result series has 1 point every minute. The 6 raw datapoints per interval are aggregated using average.
Short max retention
If you’re using carbon-relay-ng to send metrics, by default it will emit carbon-relay-ng.stats.*.stats.generate_message.duration.gauge32 every 10 seconds.
Assuming the following storage-schemas.conf rule is used:
[carbon_relay_ng_short_retention_example]
pattern = carbon-relay-ng.stats.*.stats.generate_message.duration.gauge32
retentions = 10s:10m
Unlike the previous examples, it doesn’t have the 1m:1d retention.
The last retention in this rule is 10m. This means only data from the past 10 minutes is returned.
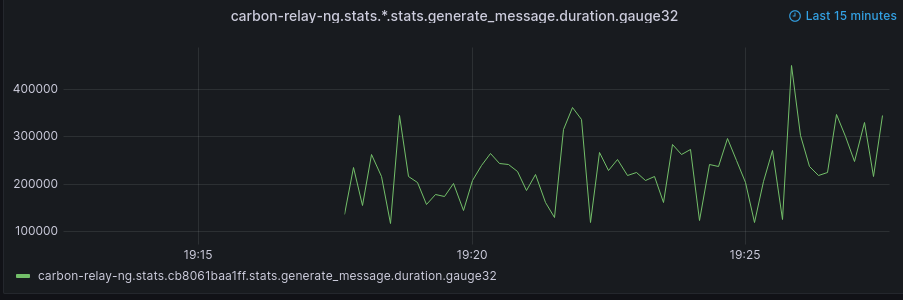
The graph queries carbon-relay-ng.stats.*.stats.generate_message.duration.gauge32 in the last 15 minutes. Due to the storage-schema.conf, no points are displayed for data older than 10 minutes.
Functions
Graphite functions are executed on the rollups, and can aggregate the points further. Depending on the function, data can be aggregated horizontally, vertically, or both ways.
For example:
summarize()horizontally aggregates points using the aggregation method and interval specified as function arguments.aggregate()and its aliases (e.g.,sumSeries(),maxSeries()) vertically aggregates points across series, though if the intervals for the series to aggregate are not the same, the series will first be aligned to the same interval. If the interval alignment means there are multiple points in an interval for a series, the points are horizontally aggregated. By default, the horizontal aggregation method will beavg, but you can useconsolidateBy()to change it.
Example
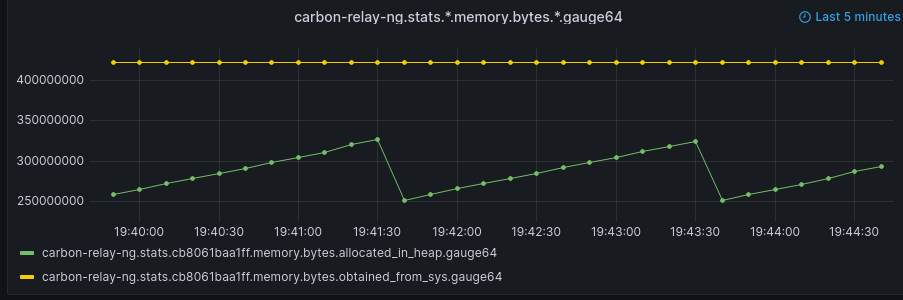
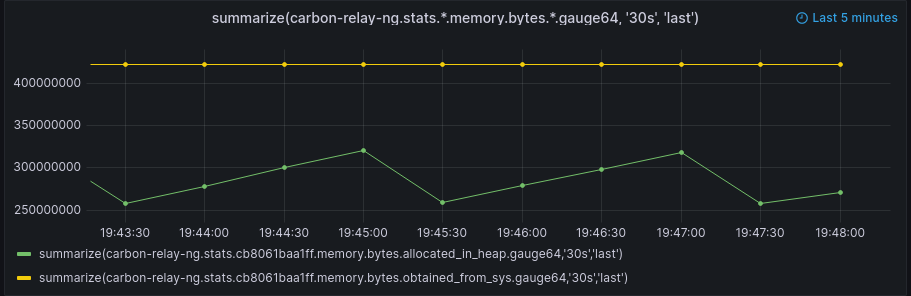
The graph below shows the result of querying the carbon-relay-ng.stats.*.memory.bytes.*.gauge64 series. Each carbon-relay-ng emits two metrics related to memory bytes (allocated_in_heap and obtained_from_sys).
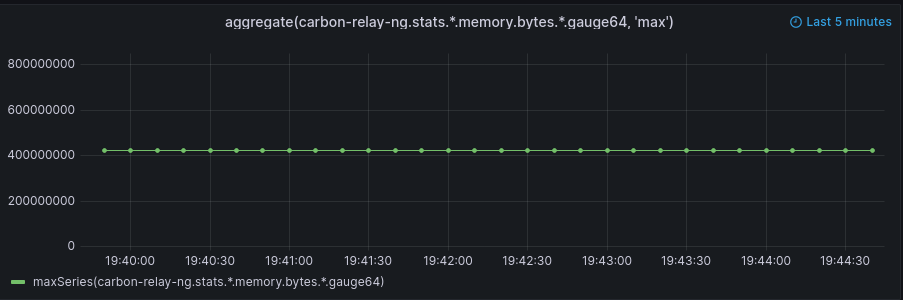
The graph below is querying aggregate(carbon-relay-ng.stats.*.memory.bytes.*.gauge64, 'max'). This vertically aggregates the points across series. In this case, the points are aggregated by choosing the maximum value at each interval.
The graph below is querying summarize(carbon-relay-ng.stats.*.memory.bytes.*.gauge64, '30s', 'last'). This horizontally aggregates the points in each series.
maxDataPoints
The render API has a maxDataPoints parameter. This is applied after Graphite function execution, limiting the number of points from each of the result series. If there are too many points for a series, the points are horizontally aggregated before being returned.
By default, the aggregation method will be avg, but you can use consolidateBy() to change it.
If you are querying Graphite metrics via Grafana, maxDataPoints is set automatically.
Example
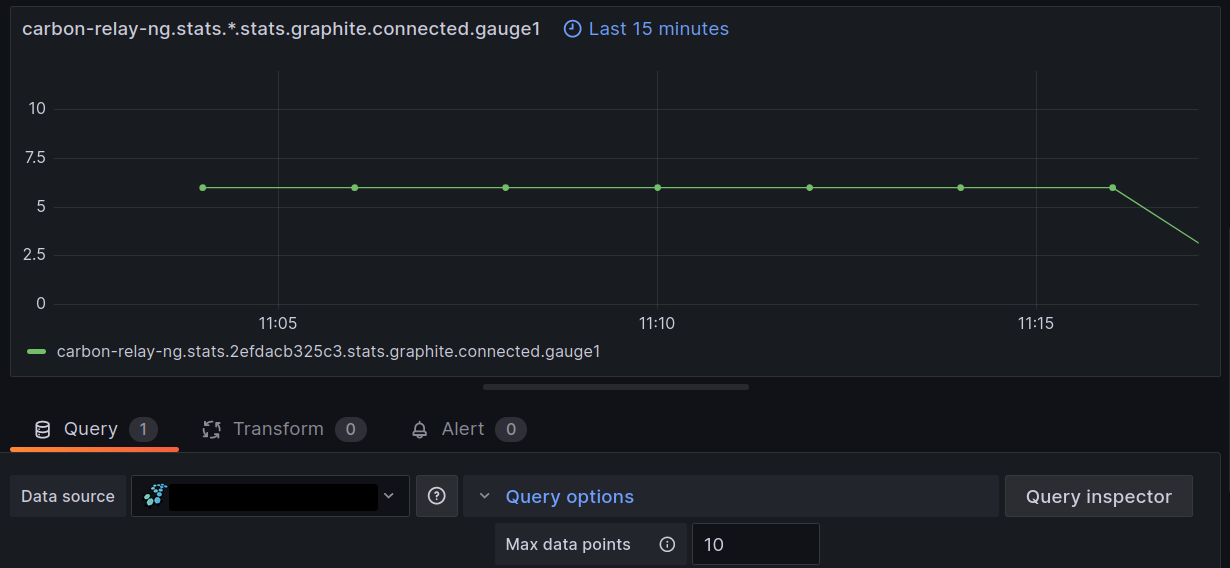
The graphs below use the same carbon-relay-ng.stats.*.stats.graphite.connected.gauge1 and schema files as Intervals aggregated with sum, As a reminder, these are emitted every 10 seconds with a constant value of 1 and aggregationMethod = sum in storage-aggregation.conf.
When maxDataPoints is greater than the number of points returned, the storage-schemas.conf intervals are used (1m intervals when querying for the last 15 minutes).
The graph below queries for the same metric, but maxDataPoints is restricted to 10, which causes the series to be horizontally aggregated further.
It just queries for carbon-relay-ng.stats.*.stats.graphite.connected.gauge1 with no additional functions. The schema file configurations are first applied to the raw datapoints, so the intermediate series have an interval of 1 minute, with the raw datapoints aggregated using sum. Each point in the intermediate series has a value of 6. maxDataPoints is then applied on the intermediate series. Due to the point limit, the interval is increase from 1 minute to 2 minutes. Therefore, the points in the intermediate series are aggregated using average as that is the default aggregation method for maxDataPoints. There are two intermediate points in each interval, so the averaged value is 6.
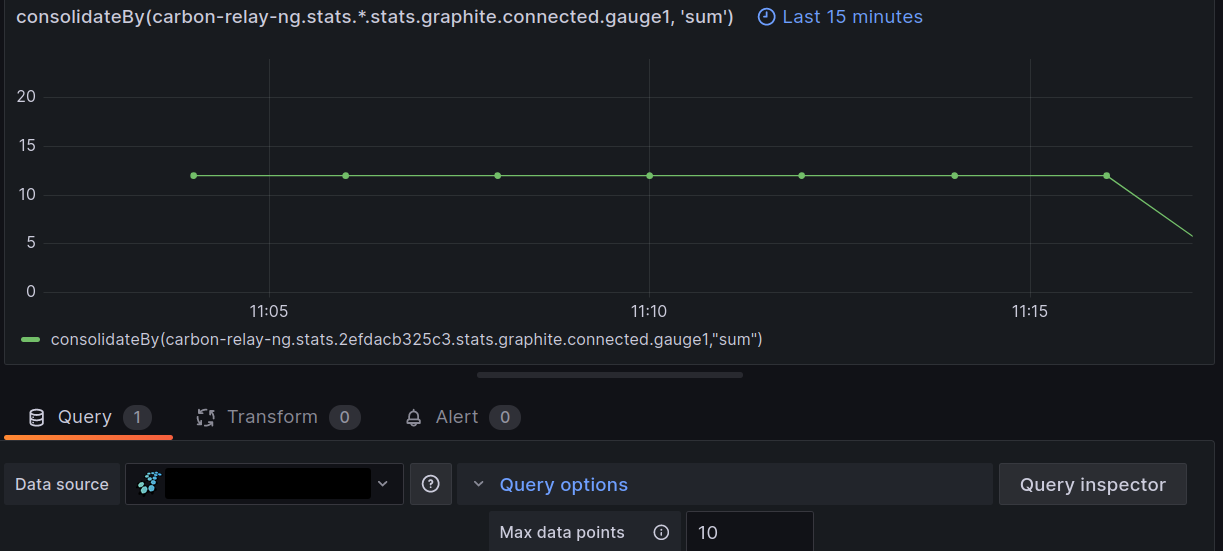
The graph below wraps the metric query with consolidateBy(sum). This updates the aggregation method used by maxDataPoints to sum. Therefore, the points in the intermediate series are aggregated using sum, so the final series have a value of 12 for each point.
Was this page helpful?
Related resources from Grafana Labs


