
Analyze metrics usage with cardinality management dashboards
Use the cardinality management dashboards to understand how metrics and labels are distributed across the time series data you send to Grafana Cloud Metrics. The dashboards also provide usage information about your metrics to help you understand which of the metrics you’re storing in Grafana Cloud are being utilized.
In addition, you can use the Adaptive Metrics cost optimization tooling to help reduce costs.
Limitations
- Cardinality management dashboards display data only for metrics and labels within a single stack.
- The cardinality dashboards only work with default Grafana Cloud Prometheus data sources (provisioned by Grafana Cloud at the creation of a stack or org).
- The cardinality management dashboards are focused on exploring your active time series for the last two hours, rather than the complete catalog of all historic time series stored in your Cloud Metrics database. For more information, refer to Active series and DPM.
Access cardinality management dashboards
Grafana Cloud provides several, provisioned-by-default dashboards that allow you to visualize and explore the data. To find the dashboards:
Click Dashboards in Grafana Cloud.
Filter by the
cardinality-managementtag and select a cardinality dashboard.![Cardinality management dashboards]()

Cardinality management - overview dashboard
The overview dashboard provides a summary of the highest cardinality metrics and labels in the selected data source.
Note
If you are trying to see usage data for a Grafana Cloud instance whose data source is in a different region than where you are searching from, you will not be able to see that usage data.
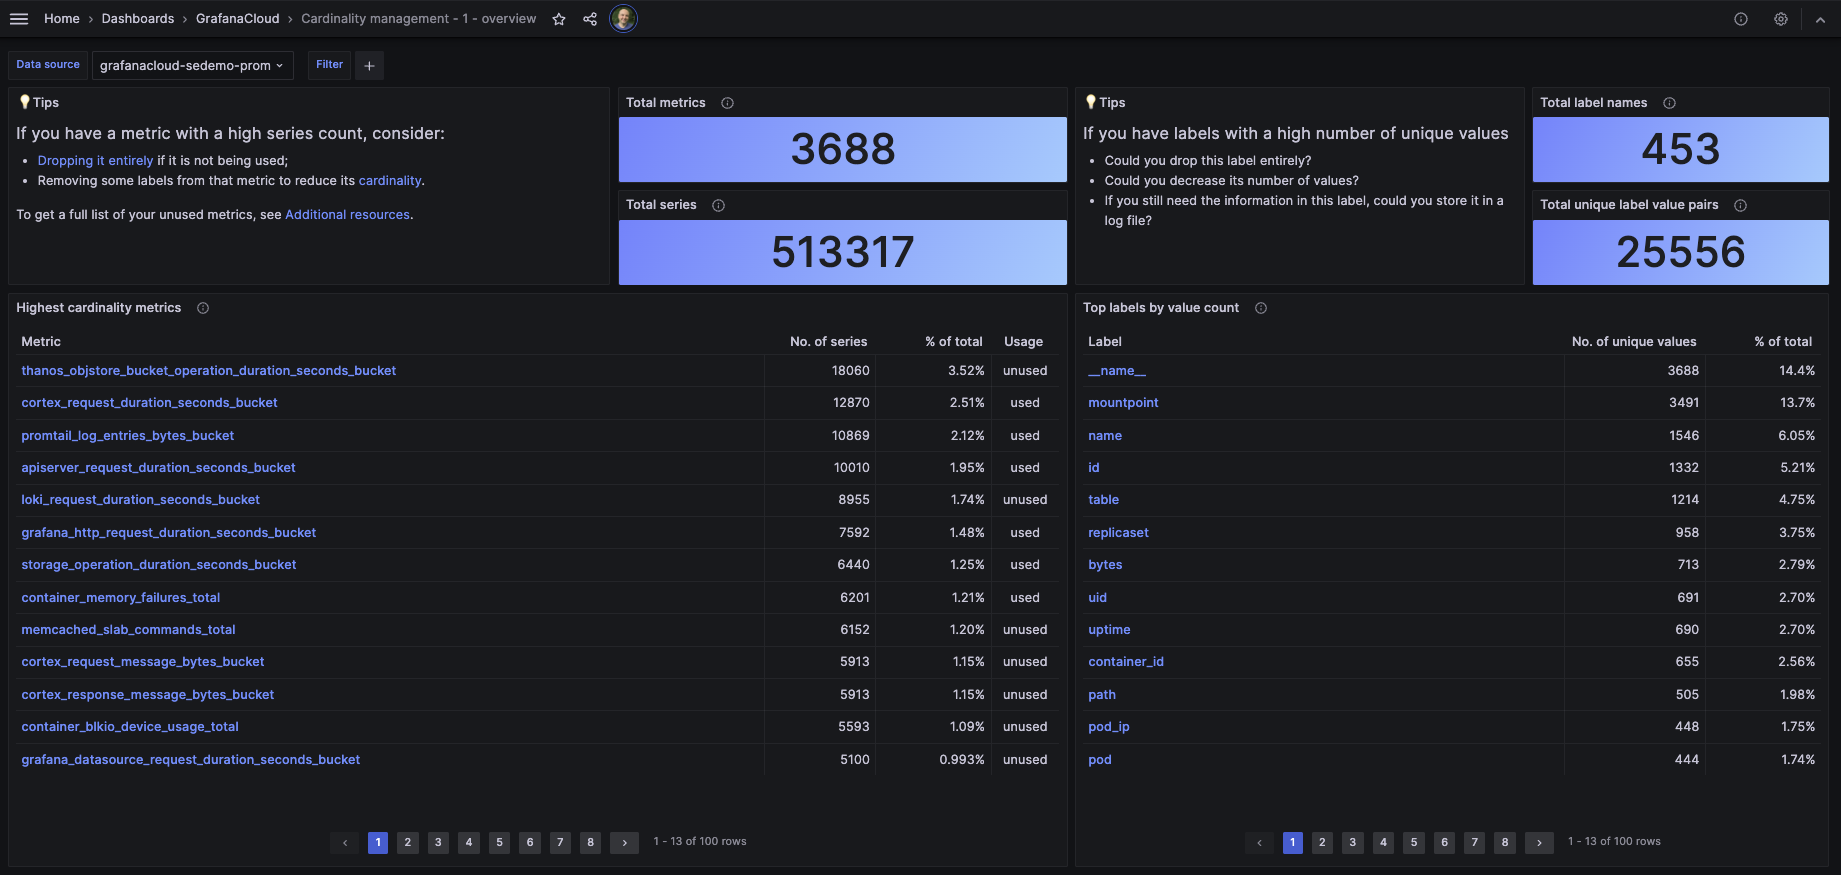
You can click a metric to view the cardinality management metrics dashboard or a label to view the cardinality management label dashboard.
In addition to surfacing high cardinality metrics and labels, the overview dashboard also shows usage information about your metrics. Users can see whether a metric is used or unused. They can use that information to decide whether or not they want to continue sending this metric to Grafana Cloud. To stop specific metrics from being sent to Grafana Cloud, refer to Reduce metrics costs via Adaptive Metrics.
Note
An unused metric is a metric that has not been queried in the last 30 days and is not used in an existing dashboard, recording rule, or alerting rule. A metric’s usage status is recomputed every 24 hours so that it reflects the most recent query history and most recent set of dashboards, alerting rules, and recording rules.
To download a full list of unused metrics, go to the Tips panel in the upper left, and click the Additional resources link. It will redirect you to the cardinality data source, where you can find the Download JSON button on the Additional resources tab.
Alternatively, you can also get that list via an API call. To find the API endpoint to call, go to the Tips panel, click the Additional resources link. Select the Additional resources tab, and find your API endpoint under section Access unused metrics via API.
Cardinality management - metrics dashboard
The metrics dashboard helps you understand the cardinality of an individual metric. At the top of the dashboard, you can select a metric to explore. The dashboard highlights the labels attached to that metric that have the most values.
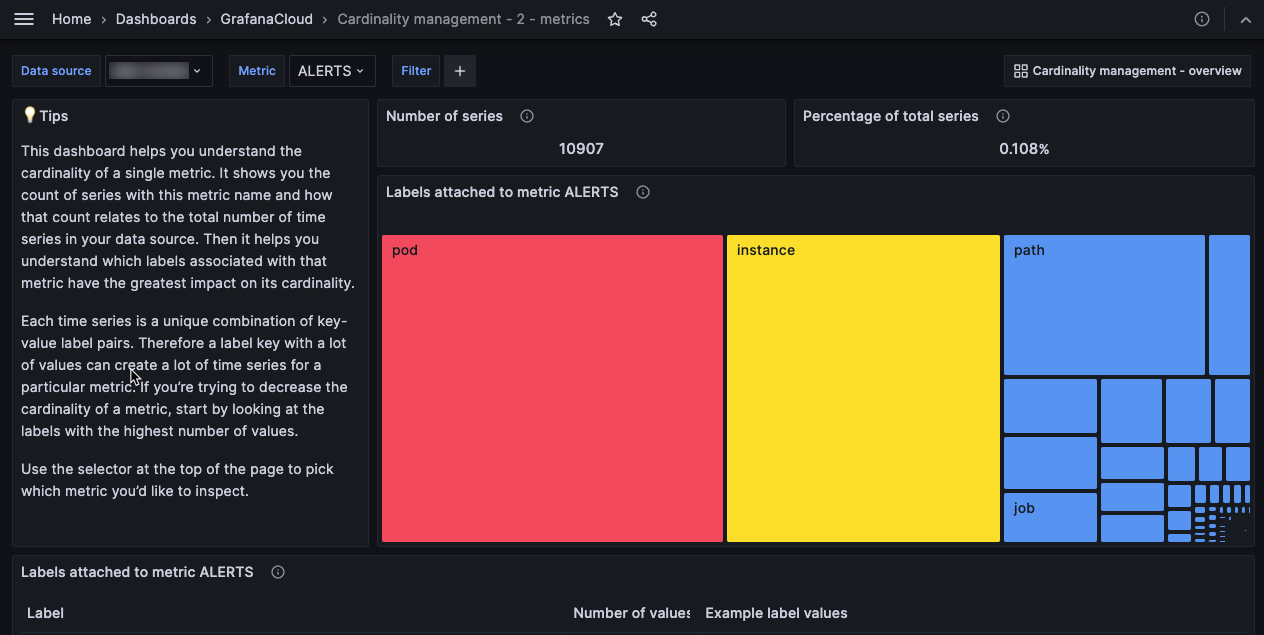
You can access the metrics dashboard by selecting the “Cardinality management - 2 - metrics” dashboard on the Dashboards page or by clicking a metric on the cardinality management overview dashboard.
Cardinality management - labels dashboard
The labels dashboard breaks down an individual label. For a given label name, it shows you which label values are attached to the most series. It also shows you the highest cardinality metrics for a given label<>value pair.
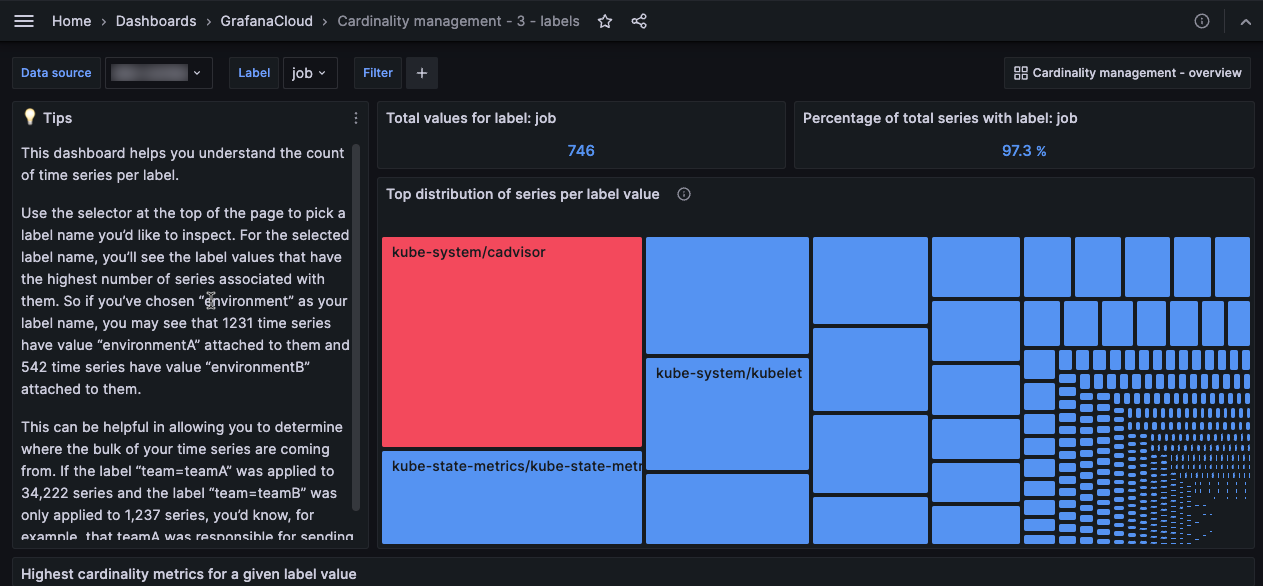
You can access the labels dashboard by selecting the “Cardinality management - 3 - labels” dashboard on the Dashboards page or by clicking a label on the Cardinality management overview dashboard.
Scope a cardinality management dashboard to specific label values
As a team lead or service owner, you can get a scoped view of the cardinality of the metrics you own, and use that to manage the costs for your team. As an administrator or operator of a Grafana instance, for each of your teams you can get a URL for the overview dashboard that is scoped to that team. You can then share it with the team lead, and ask them to take action.
To facilitate this and other use cases, the cardinality dashboards provide an ad hoc filter that lets you further specify and refine the cardinality results.
To use the ad hoc filter:
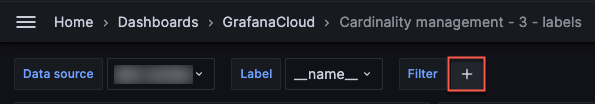
Access a cardinality management dashboard and click the plus (+) button next to Filter.
![Cardinality management - filter button]()
Select a label and a value.
![Cardinality management - filter label and value]()
The dashboard scopes to the label and value.
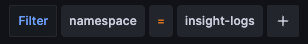
To further refine the dashboard, add labels, operators, and values to the ad hoc filter.
![Cardinality management - filter]()
- Filter expressions consist of a label, an operator such as
=(equals) or!=(does not equal), and a value. - You can combine multiple filters—when there are multiple filter expressions, they are separated by
AND. - The cardinality queries yield results when all of the filter expressions evaluate to
true, which allows you to define the subset of label values that you want to focus on.
- Filter expressions consist of a label, an operator such as

Note
The Cardinality filter does not support the<and>operators.
To remove a filter:
Select a label.
In the menu that appears, select
--remove filter--.
API access
The cardinality management dashboards are powered by Mimir’s label names cardinality and label values cardinality APIs.
You can access these APIs directly using your Remote Write Endpoint URL and username. To find these, click Details in the Prometheus card of the Cloud Portal. Your username is a string of numbers. Your Remote Write Endpoint URL looks similar to https://<SOME-STRING>/api/prom/push.
Build the URL that you’ll use to access the cardinality APIs: remove the /api/prom/push suffix from your Remote Write Endpoint URL, and add a /prometheus suffix.
Your $CARDINALITY_URL should look similar to https://<SOME-STRING>/prometheus. For example, https://prometheus-us-central1.grafana.net/prometheus/.
You also need a token for a Grafana Cloud Access Policy with metrics:read scope.
To call the label names cardinality and label values cardinality APIs, replace the <prometheus-http-prefix> field in the Mimir HTTP API documentation with your $CARDINALITY_URL. Provide your username and your token as your basic authentication credentials.
For example, a curl call to the cardinality label_names endpoint looks like this:
curl -u "<username>:<token>" "$CARDINALITY_URL/api/v1/cardinality/label_names"Was this page helpful?
Related resources from Grafana Labs


