
Wildfly integration for Grafana Cloud
Wildfly is a modular & lightweight application server that handles deploying and managing several Java applications. The Wildfly integration uses the Grafana Agent to collect metrics and logs for monitoring a Wildfly instance. Including metrics for monitoring sessions, deployments, network traffic, and datasource connections. This also includes monitoring server log files of a Wildfly instance which provides valuable information for usage and operations of the instance.
This integration supports Wildfly 27.X onwards.
This integration includes 2 useful alerts and 2 pre-built dashboards to help monitor and visualize Wildfly metrics and logs.
Grafana Alloy configuration
Before you begin
In order to collect metrics from Wildfly, ensure the metric subsystem is enabled by following the official documentation.
To enable session metrics, run the following command in the CLI:
/subsystem=undertow:write-attribute(name=statistics-enabled,value=true)To enable transaction metrics, run the following command in the CLI:
/subsystem=transactions:write-attribute(name=statistics-enabled, value=true)Wildfly has authentication enabled by default (for Wildfly management interfaces). This includes a simple username and password from an established user. To setup a user, simply run the add-user.sh script inside the Wildfly installation’s bin folder. Once script is complete, add your new <wildfly_user> and <wildfly_password> to the username and password fields underneath basic_auth. However, in the case that Wildlfly authentication is not enabled, basic_auth may need to be removed in your metrics config.
More info on user creation can be found here.
The CLI is launched using jboss-cli.sh or jboss-cli.bat located in the WildFly bin directory. For more information on default directory structure visit Getting Started Guide.
Next, connect to the WildFly instance. This is done by running connect command.
./bin/jboss-cli.sh
You are disconnected at the moment. Type 'connect' to connect to the server
or 'help' for the list of supported commands.
[disconnected /]

[disconnected /] connect
[domain@localhost:9990 /]

[domain@localhost:9990 /] quit
Closed connection to localhost:9990
To terminate the session type quit.
Install Wildfly integration for Grafana Cloud
- In your Grafana Cloud stack, click Connections in the left-hand menu.
- Find Wildfly and click its tile to open the integration.
- Review the prerequisites in the Configuration Details tab and set up Grafana Agent to send Wildfly metrics and logs to your Grafana Cloud instance.
- Click Install to add this integration’s pre-built dashboards and alerts to your Grafana Cloud instance, and you can start monitoring your Wildfly setup.
Configuration snippets for Grafana Alloy
Simple mode
These snippets are configured to scrape a single Wildfly instance running locally with default ports.
Copy and paste the following snippets into your Grafana Alloy configuration file.
Logs snippets
darwin
local.file_match "logs_integrations_integrations_wildfly" {
	path_targets = [{
		__address__ = "localhost",
		__path__    = "/opt/wildfly/standalone/log/server.log",
		instance    = constants.hostname,
		job         = "integrations/wildfly",
	}]
}

loki.process "logs_integrations_integrations_wildfly" {
	forward_to = [loki.write.grafana_cloud_loki.receiver]

	stage.multiline {
		firstline     = "\\d+-\\d+-\\d+ \\d+:\\d+:\\d+,\\d+"
		max_lines     = 0
		max_wait_time = "3s"
	}
}

loki.source.file "logs_integrations_integrations_wildfly" {
	targets    = local.file_match.logs_integrations_integrations_wildfly.targets
	forward_to = [loki.process.logs_integrations_integrations_wildfly.receiver]
}
linux
local.file_match "logs_integrations_integrations_wildfly" {
	path_targets = [{
		__address__ = "localhost",
		__path__    = "/opt/wildfly/standalone/log/server.log",
		instance    = constants.hostname,
		job         = "integrations/wildfly",
	}]
}

loki.process "logs_integrations_integrations_wildfly" {
	forward_to = [loki.write.grafana_cloud_loki.receiver]

	stage.multiline {
		firstline     = "\\d+-\\d+-\\d+ \\d+:\\d+:\\d+,\\d+"
		max_lines     = 0
		max_wait_time = "3s"
	}
}

loki.source.file "logs_integrations_integrations_wildfly" {
	targets    = local.file_match.logs_integrations_integrations_wildfly.targets
	forward_to = [loki.process.logs_integrations_integrations_wildfly.receiver]
}
windows
local.file_match "logs_integrations_integrations_wildfly" {
	path_targets = [{
		__address__ = "localhost",
		__path__    = "/opt/wildfly/standalone/log/server.log",
		instance    = constants.hostname,
		job         = "integrations/wildfly",
	}]
}

loki.process "logs_integrations_integrations_wildfly" {
	forward_to = [loki.write.grafana_cloud_loki.receiver]

	stage.multiline {
		firstline     = "\\d+-\\d+-\\d+ \\d+:\\d+:\\d+,\\d+"
		max_lines     = 0
		max_wait_time = "3s"
	}
}

loki.source.file "logs_integrations_integrations_wildfly" {
	targets    = local.file_match.logs_integrations_integrations_wildfly.targets
	forward_to = [loki.process.logs_integrations_integrations_wildfly.receiver]
}
Advanced mode
The following snippets provide examples to guide you through the configuration process.
To instruct Grafana Alloy to scrape your Wildfly instances, copy and paste the snippets to your configuration file and follow subsequent instructions.
Advanced metrics snippets
discovery.relabel "metrics_integrations_integrations_wildfly" {
	targets = [{
		__address__ = "localhost:9990",
	}]

	rule {
		target_label = "instance"
		replacement  = constants.hostname
	}
}

prometheus.scrape "metrics_integrations_integrations_wildfly" {
	targets    = discovery.relabel.metrics_integrations_integrations_wildfly.output
	forward_to = [prometheus.remote_write.metrics_service.receiver]
	job_name   = "integrations/wildfly"

	basic_auth {
		username = "<wildfly_user>"
		password = "<wildfly_password>"
	}
}
To monitor your Wildfly instance, you must use a discovery.relabel component to discover your Wildfly Prometheus endpoint and apply appropriate labels, followed by a prometheus.scrape component to scrape it.
Configure the following properties within each discovery.relabel component:
__address__: The address to your Wildfly Prometheus metrics endpoint.instancelabel:constants.hostnamesets theinstancelabel to your Grafana Alloy server hostname. If that is not suitable, change it to a value uniquely identifies this Wildfly instance. Make sure this label value is the same for all telemetry data collected for this instance.
If you have multiple Wildfly servers to scrape, configure one discovery.relabel for each and scrape them by including each under targets within the prometheus.scrape component.
Advanced logs snippets
darwin
local.file_match "logs_integrations_integrations_wildfly" {
	path_targets = [{
		__address__ = "localhost",
		__path__    = "/opt/wildfly/standalone/log/server.log",
		instance    = constants.hostname,
		job         = "integrations/wildfly",
	}]
}

loki.process "logs_integrations_integrations_wildfly" {
	forward_to = [loki.write.grafana_cloud_loki.receiver]

	stage.multiline {
		firstline     = "\\d+-\\d+-\\d+ \\d+:\\d+:\\d+,\\d+"
		max_lines     = 0
		max_wait_time = "3s"
	}
}

loki.source.file "logs_integrations_integrations_wildfly" {
	targets    = local.file_match.logs_integrations_integrations_wildfly.targets
	forward_to = [loki.process.logs_integrations_integrations_wildfly.receiver]
}
To monitor your Wildfly instance logs, you will use a combination of the following components:
local.file_match defines where to find the log file to be scraped. Change the following properties according to your environment:
__address__: The Wildfly instance address__path__: The path to the log file.instancelabel:constants.hostnamesets theinstancelabel to your Grafana Alloy server hostname. If that is not suitable, change it to a value uniquely identifies this Wildfly instance. Make sure this label value is the same for all telemetry data collected for this instance.
loki.process defines how to process logs before sending it to Loki.
loki.source.file sends logs to Loki.
linux
local.file_match "logs_integrations_integrations_wildfly" {
	path_targets = [{
		__address__ = "localhost",
		__path__    = "/opt/wildfly/standalone/log/server.log",
		instance    = constants.hostname,
		job         = "integrations/wildfly",
	}]
}

loki.process "logs_integrations_integrations_wildfly" {
	forward_to = [loki.write.grafana_cloud_loki.receiver]

	stage.multiline {
		firstline     = "\\d+-\\d+-\\d+ \\d+:\\d+:\\d+,\\d+"
		max_lines     = 0
		max_wait_time = "3s"
	}
}

loki.source.file "logs_integrations_integrations_wildfly" {
	targets    = local.file_match.logs_integrations_integrations_wildfly.targets
	forward_to = [loki.process.logs_integrations_integrations_wildfly.receiver]
}
To monitor your Wildfly instance logs, you will use a combination of the following components:
local.file_match defines where to find the log file to be scraped. Change the following properties according to your environment:
__address__: The Wildfly instance address__path__: The path to the log file.instancelabel:constants.hostnamesets theinstancelabel to your Grafana Alloy server hostname. If that is not suitable, change it to a value uniquely identifies this Wildfly instance. Make sure this label value is the same for all telemetry data collected for this instance.
loki.process defines how to process logs before sending it to Loki.
loki.source.file sends logs to Loki.
windows
local.file_match "logs_integrations_integrations_wildfly" {
	path_targets = [{
		__address__ = "localhost",
		__path__    = "/opt/wildfly/standalone/log/server.log",
		instance    = constants.hostname,
		job         = "integrations/wildfly",
	}]
}

loki.process "logs_integrations_integrations_wildfly" {
	forward_to = [loki.write.grafana_cloud_loki.receiver]

	stage.multiline {
		firstline     = "\\d+-\\d+-\\d+ \\d+:\\d+:\\d+,\\d+"
		max_lines     = 0
		max_wait_time = "3s"
	}
}

loki.source.file "logs_integrations_integrations_wildfly" {
	targets    = local.file_match.logs_integrations_integrations_wildfly.targets
	forward_to = [loki.process.logs_integrations_integrations_wildfly.receiver]
}
To monitor your Wildfly instance logs, you will use a combination of the following components:
local.file_match defines where to find the log file to be scraped. Change the following properties according to your environment:
__address__: The Wildfly instance address__path__: The path to the log file.instancelabel:constants.hostnamesets theinstancelabel to your Grafana Alloy server hostname. If that is not suitable, change it to a value uniquely identifies this Wildfly instance. Make sure this label value is the same for all telemetry data collected for this instance.
loki.process defines how to process logs before sending it to Loki.
loki.source.file sends logs to Loki.
Grafana Agent configuration
Before you begin
In order to collect metrics from Wildfly, ensure the metric subsystem is enabled by following the official documentation.
To enable session metrics, run the following command in the CLI:
/subsystem=undertow:write-attribute(name=statistics-enabled,value=true)To enable transaction metrics, run the following command in the CLI:
/subsystem=transactions:write-attribute(name=statistics-enabled, value=true)Wildfly has authentication enabled by default (for Wildfly management interfaces). This includes a simple username and password from an established user. To setup a user, simply run the add-user.sh script inside the Wildfly installation’s bin folder. Once script is complete, add your new <wildfly_user> and <wildfly_password> to the username and password fields underneath basic_auth. However, in the case that Wildlfly authentication is not enabled, basic_auth may need to be removed in your metrics config.
More info on user creation can be found here.
The CLI is launched using jboss-cli.sh or jboss-cli.bat located in the WildFly bin directory. For more information on default directory structure visit Getting Started Guide.
Next, connect to the WildFly instance. This is done by running connect command.
./bin/jboss-cli.sh
You are disconnected at the moment. Type 'connect' to connect to the server
or 'help' for the list of supported commands.
[disconnected /]

[disconnected /] connect
[domain@localhost:9990 /]

[domain@localhost:9990 /] quit
Closed connection to localhost:9990
To terminate the session type quit.
Install Wildfly integration for Grafana Cloud
- In your Grafana Cloud stack, click Connections in the left-hand menu.
- Find Wildfly and click its tile to open the integration.
- Review the prerequisites in the Configuration Details tab and set up Grafana Agent to send Wildfly metrics and logs to your Grafana Cloud instance.
- Click Install to add this integration’s pre-built dashboards and alerts to your Grafana Cloud instance, and you can start monitoring your Wildfly setup.
Post-install configuration for the Wildfly integration
After ensuring subsystem metrics are enabled, instruct the Grafana Agent to scrape Metrics from a WildFly instance.
Make sure to change targets in the snippet according to your environment.
If you want to show logs and metrics signals in your dashboards, ensure the following:
instancelabel must be set to a value that uniquely identifies your Wildfly Instance. Please replace the default hostname value according to your environment - it should be set manually.jobmust be set tointegrations/wildfly
In the case that Wildlfly authentication is not enabled, basic_auth may need to be removed in your metrics config.
Configuration snippets for Grafana Agent
Below metrics.configs.scrape_configs, insert the following lines and change the URLs according to your environment:
    - job_name: integrations/wildfly
      metrics_path: /metrics
      basic_auth:
        username: '<wildfly_user>'
        password: '<wildfly_password>'
      relabel_configs:
        - replacement: '<your-instance-name>'
          target_label: instance
      static_configs:
        - targets: ["localhost:9990"]
Below logs.configs.scrape_configs, insert the following lines according to your environment.
    - job_name: integrations/wildfly
      static_configs:
        - targets: [localhost]
          labels:
            instance: '<your-instance-name>'
            job: integrations/wildfly
            __path__: /opt/wildfly/standalone/log/server.log
      pipeline_stages:
        - multiline:
        # match on timestamp. Format should be like '2023-01-20 09:38:23,454'
        # but feel free to modify to match your logs
          firstline: '\d+-\d+-\d+ \d+:\d+:\d+,\d+'
Full example configuration for Grafana Agent
Refer to the following Grafana Agent configuration for a complete example that contains all the snippets used for the Wildfly integration. This example also includes metrics that are sent to monitor your Grafana Agent instance.
integrations:
  prometheus_remote_write:
  - basic_auth:
      password: <your_prom_pass>
      username: <your_prom_user>
    url: <your_prom_url>
  agent:
    enabled: true
    relabel_configs:
    - action: replace
      source_labels:
      - agent_hostname
      target_label: instance
    - action: replace
      target_label: job
      replacement: "integrations/agent-check"
    metric_relabel_configs:
    - action: keep
      regex: (prometheus_target_sync_length_seconds_sum|prometheus_target_scrapes_.*|prometheus_target_interval.*|prometheus_sd_discovered_targets|agent_build.*|agent_wal_samples_appended_total|process_start_time_seconds)
      source_labels:
      - __name__
  # Add here any snippet that belongs to the `integrations` section.
  # For a correct indentation, paste snippets copied from Grafana Cloud at the beginning of the line.
logs:
  configs:
  - clients:
    - basic_auth:
        password: <your_loki_pass>
        username: <your_loki_user>
      url: <your_loki_url>
    name: integrations
    positions:
      filename: /tmp/positions.yaml
    scrape_configs:
      # Add here any snippet that belongs to the `logs.configs.scrape_configs` section.
      # For a correct indentation, paste snippets copied from Grafana Cloud at the beginning of the line.
    - job_name: integrations/wildfly
      static_configs:
        - targets: [localhost]
          labels:
            instance: '<your-instance-name>'
            job: integrations/wildfly
            __path__: /opt/wildfly/standalone/log/server.log
      pipeline_stages:
        - multiline:
        # match on timestamp. Format should be like '2023-01-20 09:38:23,454'
        # but feel free to modify to match your logs
          firstline: '\d+-\d+-\d+ \d+:\d+:\d+,\d+'
metrics:
  configs:
  - name: integrations
    remote_write:
    - basic_auth:
        password: <your_prom_pass>
        username: <your_prom_user>
      url: <your_prom_url>
    scrape_configs:
      # Add here any snippet that belongs to the `metrics.configs.scrape_configs` section.
      # For a correct indentation, paste snippets copied from Grafana Cloud at the beginning of the line.
    - job_name: integrations/wildfly
      metrics_path: /metrics
      basic_auth:
        username: '<wildfly_user>'
        password: '<wildfly_password>'
      relabel_configs:
        - replacement: '<your-instance-name>'
          target_label: instance
      static_configs:
        - targets: ["localhost:9990"]
  global:
    scrape_interval: 60s
  wal_directory: /tmp/grafana-agent-wal
Dashboards
The Wildfly integration installs the following dashboards in your Grafana Cloud instance to help monitor your system.
- Wildfly datasource
- Wildfly overview
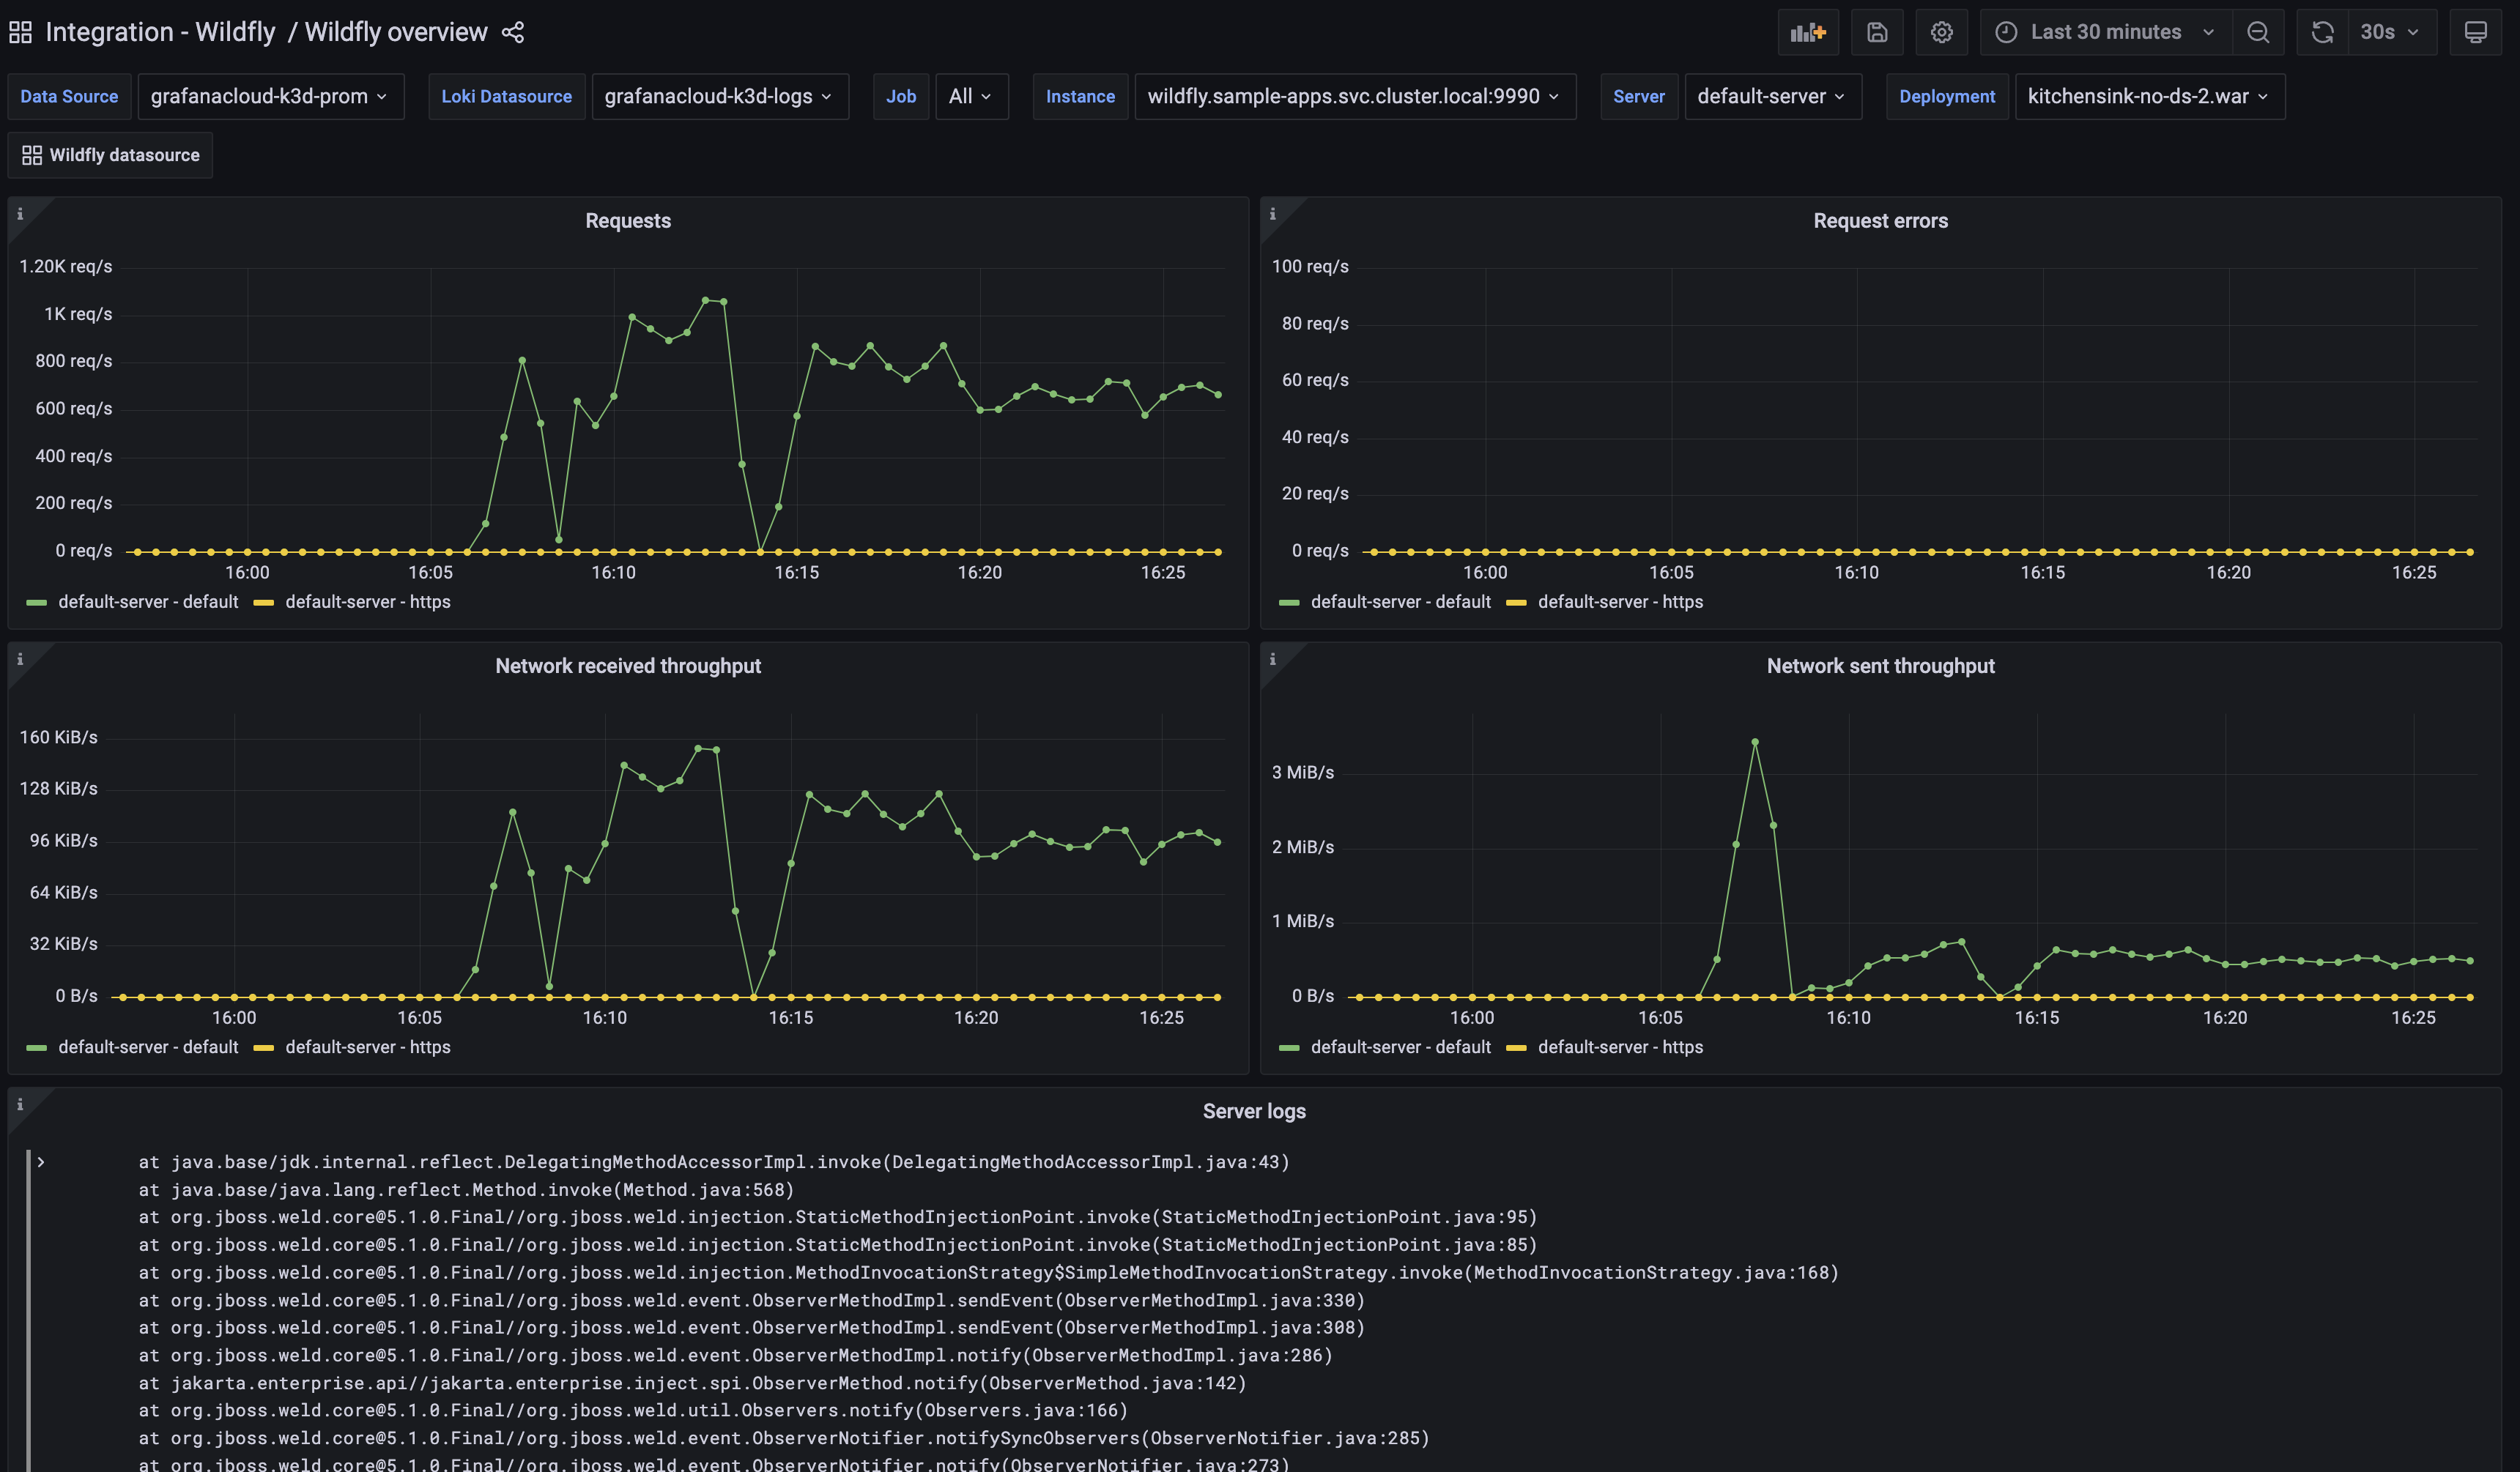
Wildfly overview
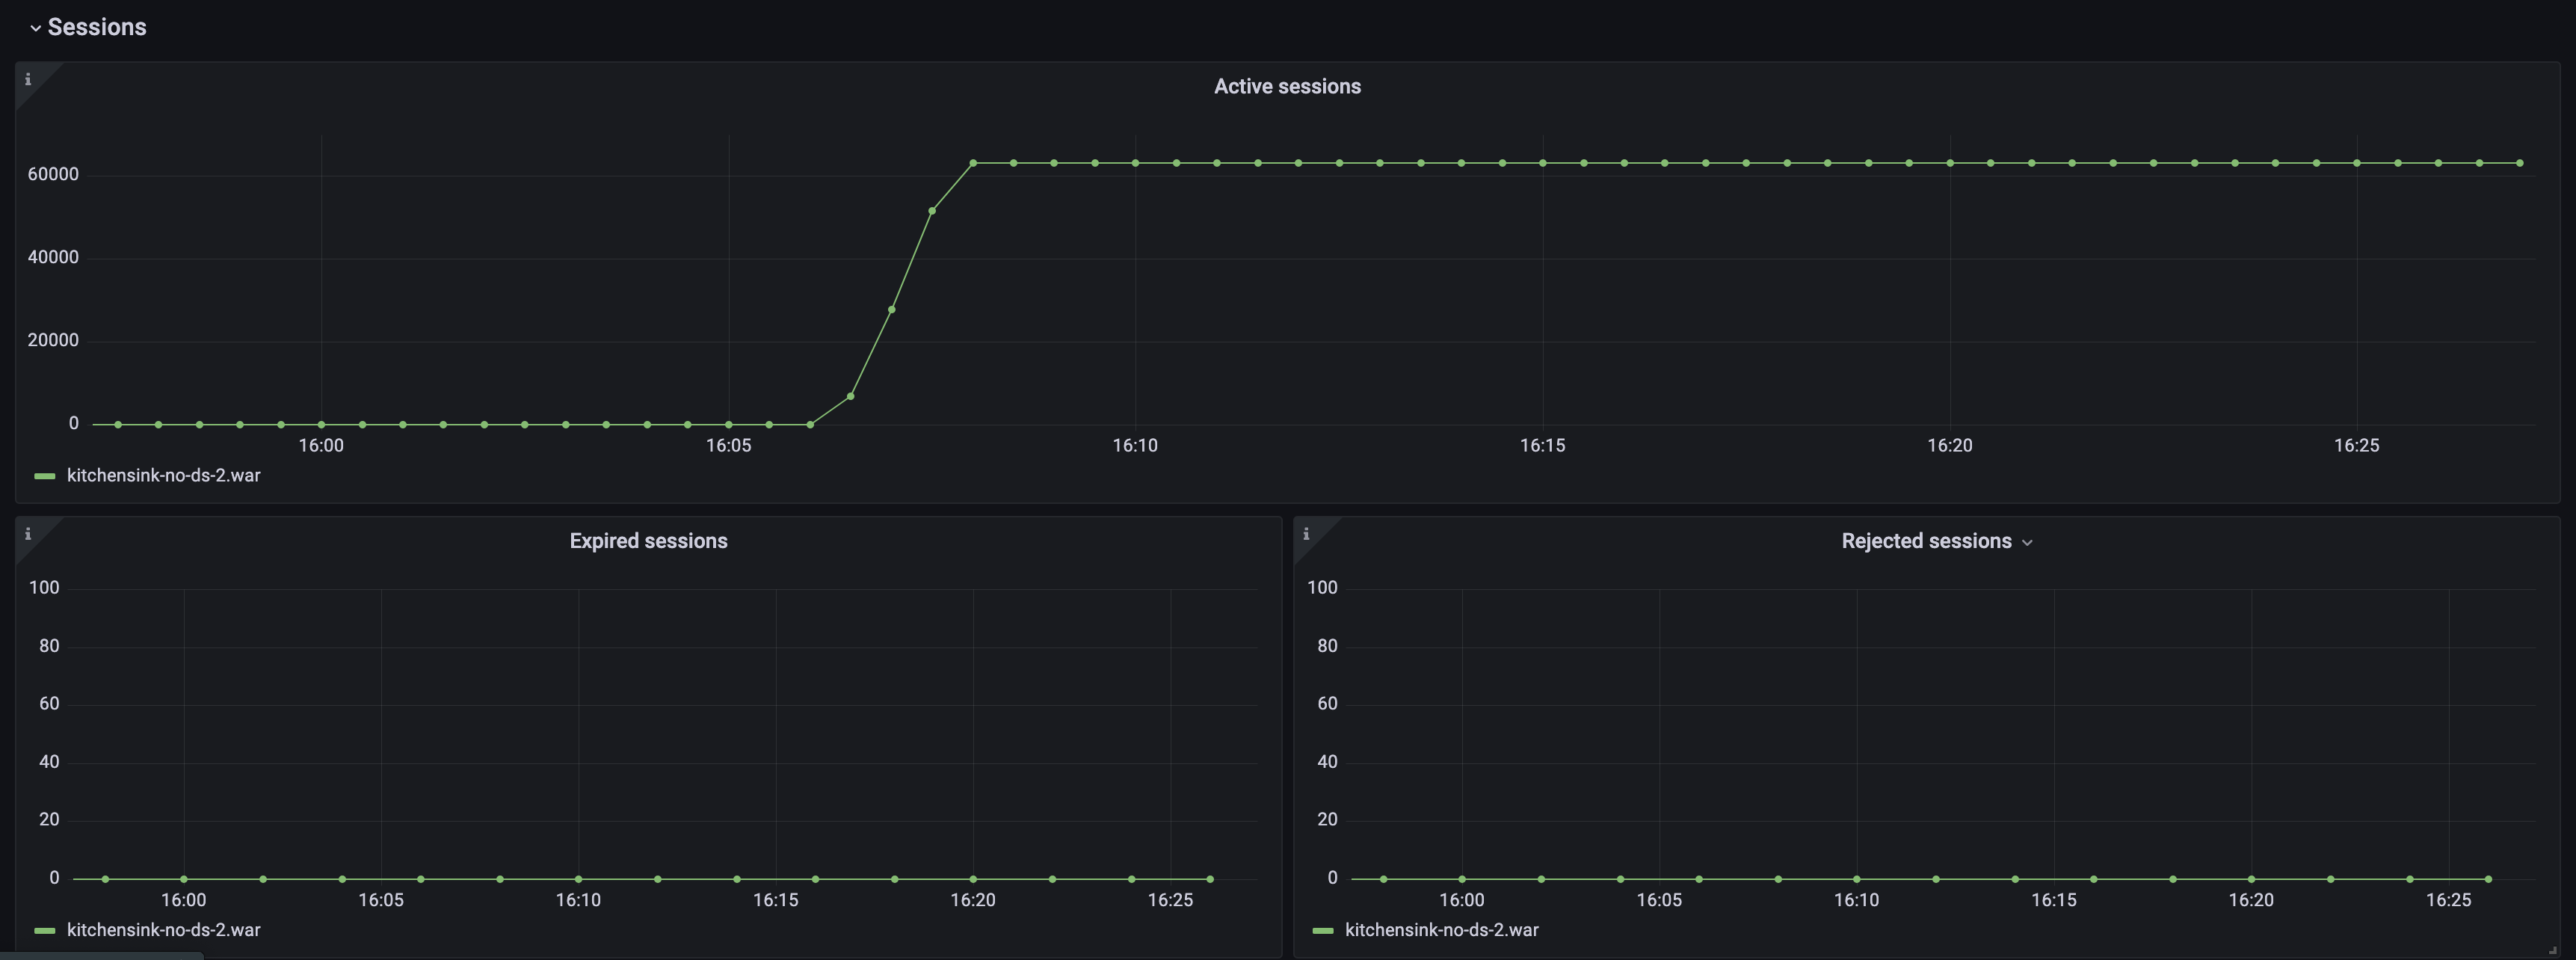
Wildfly overview (Sessions)
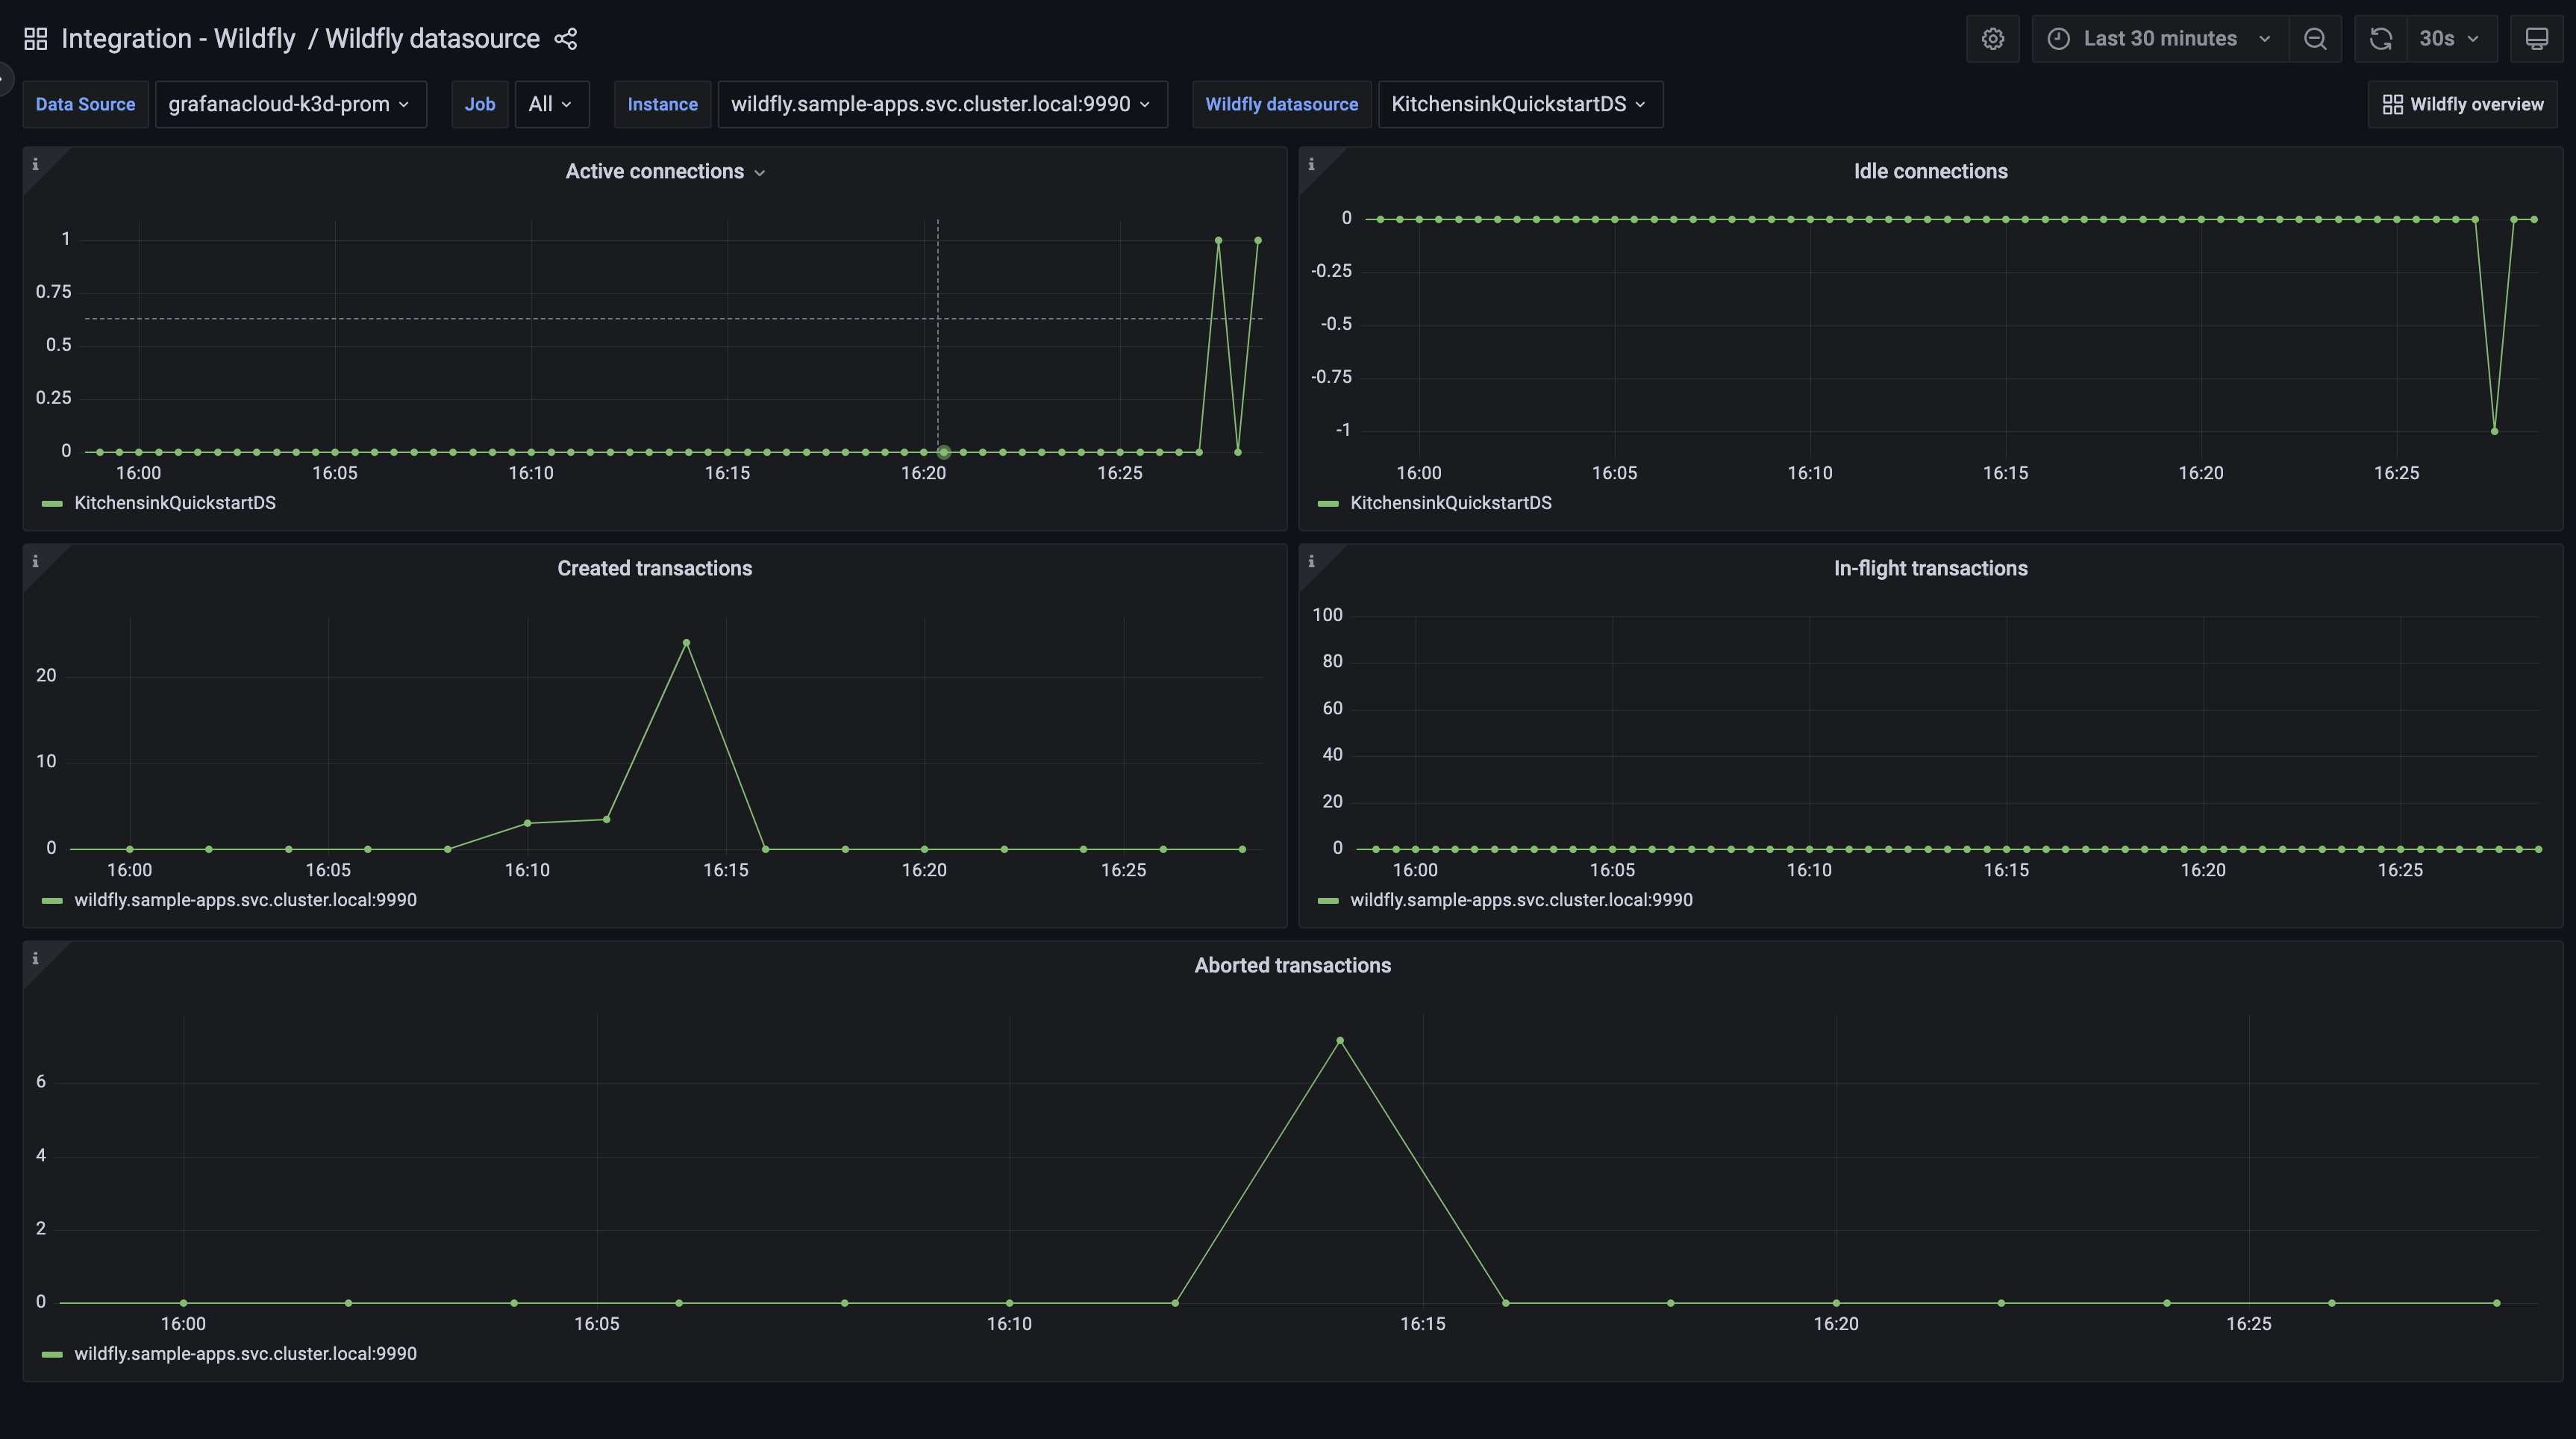
Wildfly datasource dashboard
Alerts
The Wildfly integration includes the following useful alerts:
| Alert | Description |
|---|---|
| HighPercentageOfErrorResponses | Critical: Large percentage of requests are resulting in 5XX responses. |
| HighNumberOfRejectedSessionsForDeployment | Critical: Large number of sessions are being rejected for a deployment. |
Metrics
The most important metrics provided by the Wildfly integration, which are used on the pre-built dashboards and Prometheus alerts, are as follows:
- up
- wildfly_batch_jberet_active_count
- wildfly_datasources_pool_idle_count
- wildfly_datasources_pool_in_use_count
- wildfly_transactions_number_of_aborted_transactions_total
- wildfly_transactions_number_of_inflight_transactions
- wildfly_transactions_number_of_transactions_total
- wildfly_undertow_active_sessions
- wildfly_undertow_bytes_received_total_bytes
- wildfly_undertow_bytes_sent_total_bytes
- wildfly_undertow_error_count_total
- wildfly_undertow_expired_sessions_total
- wildfly_undertow_rejected_sessions_total
- wildfly_undertow_request_count_total
Changelog
# 0.0.3 - September 2023

* New Filter Metrics option for configuring the Grafana Agent, which saves on metrics cost by dropping any metric not used by this integration. Beware that anything custom built using metrics that are not on the snippet will stop working.
* New hostname relabel option, which applies the instance name you write on the text box to the Grafana Agent configuration snippets, making it easier and less error prone to configure this mandatory label.

# 0.0.2 - August 2023

* Add regex filter for logs datasource

# 0.0.1 - April 2023

- Initial release
Cost
By connecting your Wildfly instance to Grafana Cloud, you might incur charges. To view information on the number of active series that your Grafana Cloud account uses for metrics included in each Cloud tier, see Active series and dpm usage and Cloud tier pricing.
Was this page helpful?
Related resources from Grafana Labs


