
NSQ integration for Grafana Cloud
NSQ is a realtime distributed messaging platform designed to operate at scale, handling billions of messages per day.
This integration uses NSQ statsd integration to gather metrics.
This integration includes 2 useful alerts and 2 pre-built dashboards to help monitor and visualize NSQ metrics.
Before you begin
In order for the integration to work, point nsqd to Grafana Alloy statsd exporter with -statsd-address, using nsqd command line flags, like this:
nsqd -statsd-address=agent.default.svc.cluster.local:9125To enable e2e metrics with extra flags:
nsqd -e2e-processing-latency-percentile=1.0,0.99,0.95 -e2e-processing-latency-window-time=1m0sTo learn more, see end-to-end processing latency in nsq.
Install NSQ integration for Grafana Cloud
- In your Grafana Cloud stack, click Connections in the left-hand menu.
- Find NSQ and click its tile to open the integration.
- Review the prerequisites in the Configuration Details tab and set up Grafana Agent to send NSQ metrics to your Grafana Cloud instance.
- Click Install to add this integration’s pre-built dashboards and alerts to your Grafana Cloud instance, and you can start monitoring your NSQ setup.
Configuration snippets for Grafana Alloy
Advanced mode
The following snippets provide examples to guide you through the configuration process.
To instruct Grafana Alloy to scrape your NSQ instances, manually copy and append the snippets to your alloy configuration file, then follow subsequent instructions.
Advanced integrations snippets
prometheus.exporter.statsd "integrations_statsd_exporter" {
  mapping_config_path = "statsd_mapping.yaml"
}

discovery.relabel "integrations_statsd_exporter" {
	targets = prometheus.exporter.statsd.integrations_statsd_exporter.targets

	rule {
		target_label = "job"
		replacement  = "integrations/statsd_exporter"
	}
}

prometheus.scrape "integrations_statsd_exporter" {
	targets    = discovery.relabel.integrations_statsd_exporter.output
	forward_to = [prometheus.relabel.integrations_statsd_exporter.receiver]
	job_name   = "integrations/statsd_exporter"
}

prometheus.relabel "integrations_statsd_exporter" {
	forward_to = [prometheus.remote_write.metrics_service.receiver]

	rule {
		source_labels = ["exported_job"]
		target_label  = "job"
		replacement   = "integrations/$1"
	}

	rule {
		source_labels = ["exported_instance"]
		target_label  = "instance"
	}

	rule {
		regex  = "(exported_instance|exported_job)"
		action = "labeldrop"
	}
}
This integrations uses the prometheus.exporter.statsd component to generate metrics from a NSQ instance.
The statsd exporter component requires an external mapping configuration file. You can download the correct mapping file for this integration here.
For the full array of configuration options, refer to the prometheus.exporter.statsd component reference documentation.
This exporter must be linked with a discovery.relabel component to apply the necessary relabelings.
For each NSQ instance to be monitored you must create a pair of these components.
Configure the following properties within each discovery.relabel component:
instancelabel:constants.hostnamesets theinstancelabel to your Grafana Alloy server hostname. If that is not suitable, change it to a value uniquely identifies this NSQ instance.
You can then scrape them by including each discovery.relabel under targets within the prometheus.scrape component.
Grafana Agent static configuration (deprecated)
The following section shows configuration for running Grafana Agent in static mode which is deprecated. You should use Grafana Alloy for all new deployments.
Before you begin
In order for the integration to work, point nsqd to Grafana Agent statsd exporter with -statsd-address, using nsqd command line flags, like this:
nsqd -statsd-address=agent.default.svc.cluster.local:9125To enable e2e metrics with extra flags:
nsqd -e2e-processing-latency-percentile=1.0,0.99,0.95 -e2e-processing-latency-window-time=1m0sTo learn more, see end-to-end processing latency in nsq.
Install NSQ integration for Grafana Cloud
- In your Grafana Cloud stack, click Connections in the left-hand menu.
- Find NSQ and click its tile to open the integration.
- Review the prerequisites in the Configuration Details tab and set up Grafana Agent to send NSQ metrics to your Grafana Cloud instance.
- Click Install to add this integration’s pre-built dashboards and alerts to your Grafana Cloud instance, and you can start monitoring your NSQ setup.
Post-install configuration for the NSQ integration
This integration is configured to work with the statsd_exporter, which is embedded in Grafana Agent.
Enable the integration by adding the provided snippets to your agent configuration file.
For a full description of configuration options see how to configure the statsd_exporter_config block in the agent documentation.
Configuration snippets for Grafana Agent
Below integrations, insert the following lines and change the URLs according to your environment:
  statsd_exporter:
    enabled: true
    metric_relabel_configs:
      - source_labels: [exported_job]
        target_label: job
        replacement: 'integrations/$1'
      - source_labels: [exported_instance]
        target_label: instance
      - regex: (exported_instance|exported_job)
        action: labeldrop
    mapping_config:
      defaults:
        match_type: glob
        glob_disable_ordering: false
        ttl: 1m30s
      mappings:
      - match: "nsq.*.topic.*.channel.*.message_count"
        name: "nsq_topic_channel_message_count"
        match_metric_type: counter
        labels:
          instance: "$1"
          job: "nsq"
          topic: "$2"
          channel: "$3"

      - match: "nsq.*.topic.*.channel.*.requeue_count"
        name: "nsq_topic_channel_requeue_count"
        match_metric_type: counter
        labels:
          instance: "$1"
          job: "nsq"
          topic: "$2"
          channel: "$3"

      - match: "nsq.*.topic.*.channel.*.timeout_count"
        name: "nsq_topic_channel_timeout_count"
        match_metric_type: counter
        labels:
          instance: "$1"
          job: "nsq"
          topic: "$2"
          channel: "$3"

      - match: "nsq.*.topic.*.channel.*.*"
        name: "nsq_topic_channel_${4}"
        match_metric_type: gauge
        labels:
          instance: "$1"
          job: "nsq"
          topic: "$2"
          channel: "$3"

      #nsq.<nsq_host>_<nsq_port>.topic.<topic_name>.backend_depth [gauge]
      - match: "nsq.*.topic.*.message_count"
        name: "nsq_topic_message_count"
        help: Total number of messages for the topic
        match_metric_type: counter
        labels:
          instance: "$1"
          job: "nsq"
          topic: "$2"

      - match: "nsq.*.topic.*.message_bytes"
        name: "nsq_topic_message_bytes"
        help: Total number of bytes of all messages
        match_metric_type: counter
        labels:
          instance: "$1"
          job: "nsq"
          topic: "$2"

      - match: "nsq.*.topic.*.*" #depth or backend_depth
        name: "nsq_topic_${3}"
        match_metric_type: gauge
        labels:
          instance: "$1"
          job: "nsq"
          topic: "$2"
      # mem
      # nsq.<nsq_host>_<nsq_port>.mem.gc_runs
      - match: "nsq.*.mem.gc_runs"
        name: "nsq_mem_gc_runs"
        match_metric_type: counter
        labels:
          instance: "$1"
          job: "nsq"

      - match: "nsq.*.mem.*"
        name: "nsq_mem_${2}"
        match_metric_type: gauge
        labels:
          instance: "$1"
          job: "nsq"
Full example configuration for Grafana Agent
Refer to the following Grafana Agent configuration for a complete example that contains all the snippets used for the NSQ integration. This example also includes metrics that are sent to monitor your Grafana Agent instance.
integrations:
  prometheus_remote_write:
  - basic_auth:
      password: <your_prom_pass>
      username: <your_prom_user>
    url: <your_prom_url>
  agent:
    enabled: true
    relabel_configs:
    - action: replace
      source_labels:
      - agent_hostname
      target_label: instance
    - action: replace
      target_label: job
      replacement: "integrations/agent-check"
    metric_relabel_configs:
    - action: keep
      regex: (prometheus_target_sync_length_seconds_sum|prometheus_target_scrapes_.*|prometheus_target_interval.*|prometheus_sd_discovered_targets|agent_build.*|agent_wal_samples_appended_total|process_start_time_seconds)
      source_labels:
      - __name__
  # Add here any snippet that belongs to the `integrations` section.
  # For a correct indentation, paste snippets copied from Grafana Cloud at the beginning of the line.
  statsd_exporter:
    enabled: true
    metric_relabel_configs:
      - source_labels: [exported_job]
        target_label: job
        replacement: 'integrations/$1'
      - source_labels: [exported_instance]
        target_label: instance
      - regex: (exported_instance|exported_job)
        action: labeldrop
    mapping_config:
      defaults:
        match_type: glob
        glob_disable_ordering: false
        ttl: 1m30s
      mappings:
      - match: "nsq.*.topic.*.channel.*.message_count"
        name: "nsq_topic_channel_message_count"
        match_metric_type: counter
        labels:
          instance: "$1"
          job: "nsq"
          topic: "$2"
          channel: "$3"

      - match: "nsq.*.topic.*.channel.*.requeue_count"
        name: "nsq_topic_channel_requeue_count"
        match_metric_type: counter
        labels:
          instance: "$1"
          job: "nsq"
          topic: "$2"
          channel: "$3"

      - match: "nsq.*.topic.*.channel.*.timeout_count"
        name: "nsq_topic_channel_timeout_count"
        match_metric_type: counter
        labels:
          instance: "$1"
          job: "nsq"
          topic: "$2"
          channel: "$3"

      - match: "nsq.*.topic.*.channel.*.*"
        name: "nsq_topic_channel_${4}"
        match_metric_type: gauge
        labels:
          instance: "$1"
          job: "nsq"
          topic: "$2"
          channel: "$3"

      #nsq.<nsq_host>_<nsq_port>.topic.<topic_name>.backend_depth [gauge]
      - match: "nsq.*.topic.*.message_count"
        name: "nsq_topic_message_count"
        help: Total number of messages for the topic
        match_metric_type: counter
        labels:
          instance: "$1"
          job: "nsq"
          topic: "$2"

      - match: "nsq.*.topic.*.message_bytes"
        name: "nsq_topic_message_bytes"
        help: Total number of bytes of all messages
        match_metric_type: counter
        labels:
          instance: "$1"
          job: "nsq"
          topic: "$2"

      - match: "nsq.*.topic.*.*" #depth or backend_depth
        name: "nsq_topic_${3}"
        match_metric_type: gauge
        labels:
          instance: "$1"
          job: "nsq"
          topic: "$2"
      # mem
      # nsq.<nsq_host>_<nsq_port>.mem.gc_runs
      - match: "nsq.*.mem.gc_runs"
        name: "nsq_mem_gc_runs"
        match_metric_type: counter
        labels:
          instance: "$1"
          job: "nsq"

      - match: "nsq.*.mem.*"
        name: "nsq_mem_${2}"
        match_metric_type: gauge
        labels:
          instance: "$1"
          job: "nsq"
logs:
  configs:
  - clients:
    - basic_auth:
        password: <your_loki_pass>
        username: <your_loki_user>
      url: <your_loki_url>
    name: integrations
    positions:
      filename: /tmp/positions.yaml
    scrape_configs:
      # Add here any snippet that belongs to the `logs.configs.scrape_configs` section.
      # For a correct indentation, paste snippets copied from Grafana Cloud at the beginning of the line.
metrics:
  configs:
  - name: integrations
    remote_write:
    - basic_auth:
        password: <your_prom_pass>
        username: <your_prom_user>
      url: <your_prom_url>
    scrape_configs:
      # Add here any snippet that belongs to the `metrics.configs.scrape_configs` section.
      # For a correct indentation, paste snippets copied from Grafana Cloud at the beginning of the line.
  global:
    scrape_interval: 60s
  wal_directory: /tmp/grafana-agent-wal
Dashboards
The NSQ integration installs the following dashboards in your Grafana Cloud instance to help monitor your system.
- NSQ Instances
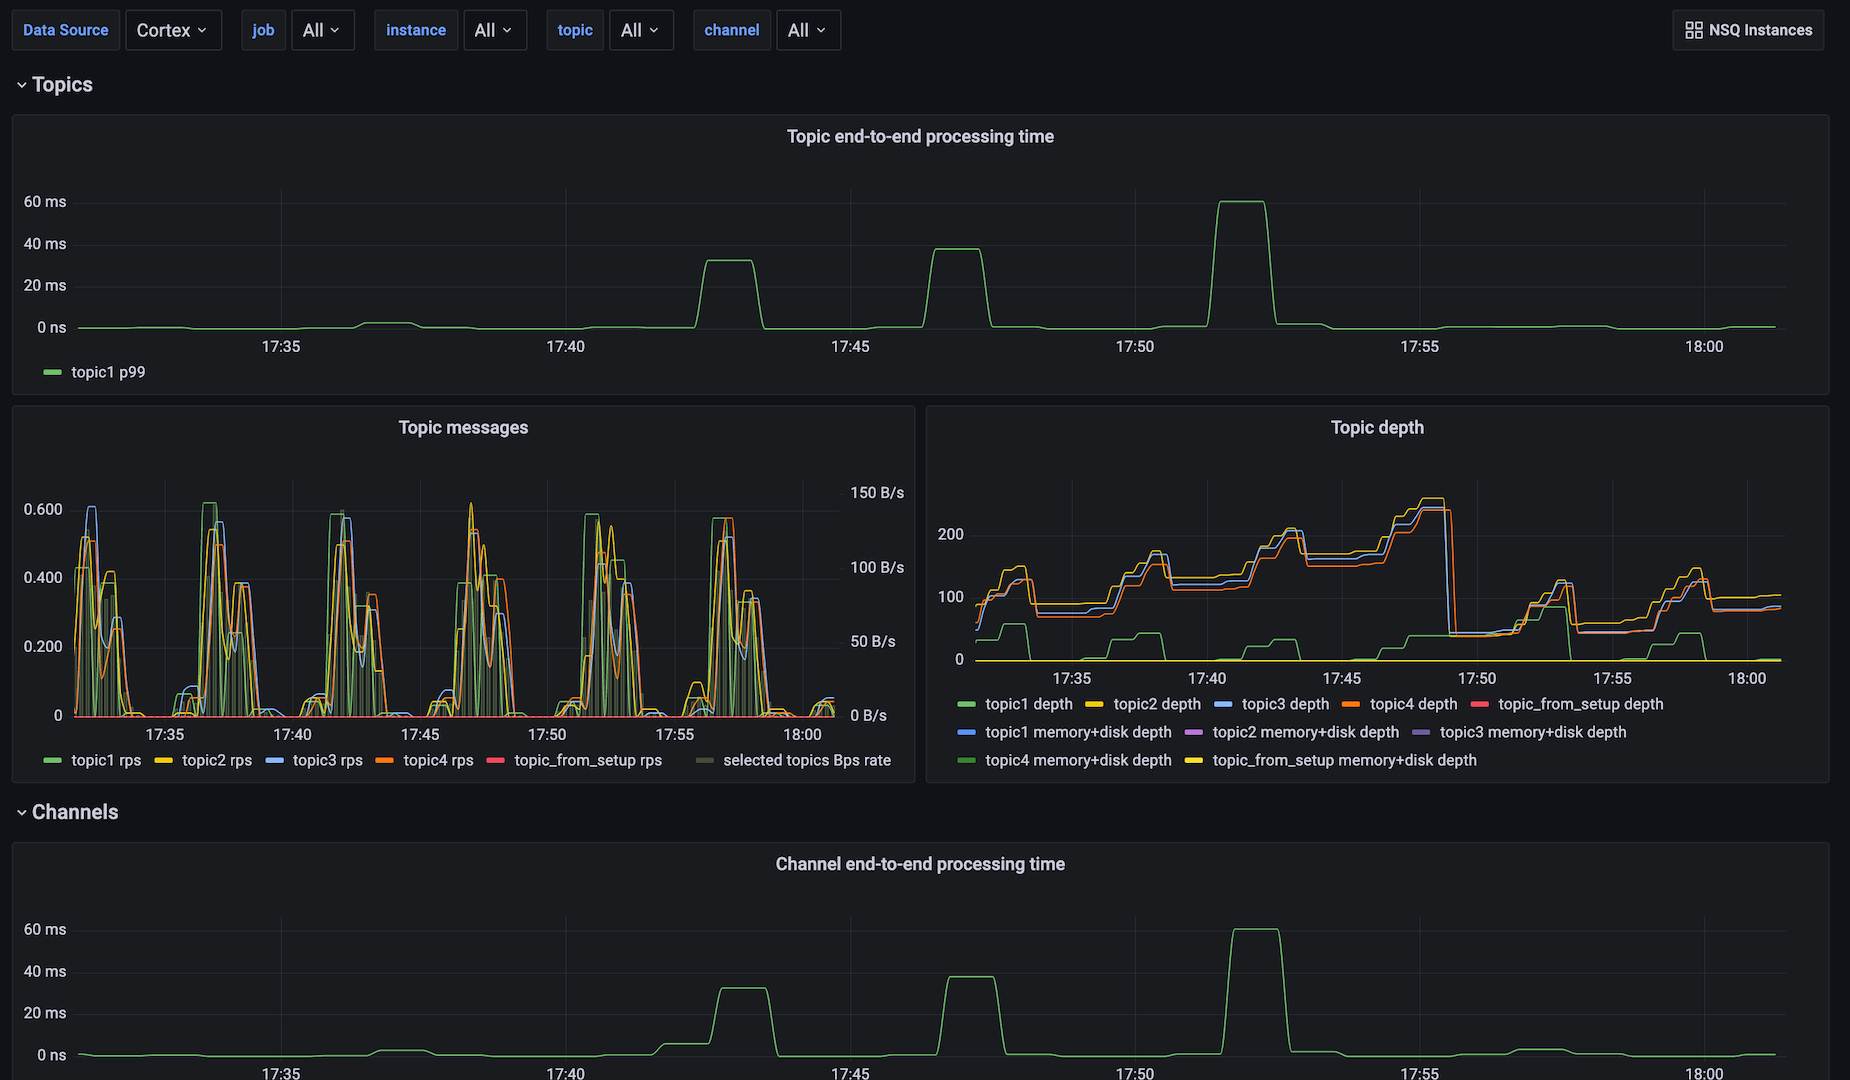
- NSQ Topics
NSQ topics dashboard
NSQ instances dashboard

Alerts
The NSQ integration includes the following useful alerts:
| Alert | Description |
|---|---|
| NsqTopicDepthIncreasing | Critical: Topic depth is increasing. |
| NsqChannelDepthIncreasing | Critical: Topic channel depth is increasing. |
Metrics
The most important metrics provided by the NSQ integration, which are used on the pre-built dashboards and Prometheus alerts, are as follows:
- nsq_mem_gc_pause_usec_100
- nsq_mem_gc_pause_usec_95
- nsq_mem_gc_pause_usec_99
- nsq_mem_heap_idle_bytes
- nsq_mem_heap_in_use_bytes
- nsq_mem_heap_objects
- nsq_mem_heap_released_bytes
- nsq_mem_next_gc_bytes
- nsq_topic_backend_depth
- nsq_topic_channel_backend_depth
- nsq_topic_channel_clients
- nsq_topic_channel_deferred_count
- nsq_topic_channel_depth
- nsq_topic_channel_e2e_processing_latency_99
- nsq_topic_channel_in_flight_count
- nsq_topic_channel_message_count
- nsq_topic_channel_requeue_count
- nsq_topic_channel_timeout_count
- nsq_topic_depth
- nsq_topic_e2e_processing_latency_99
- nsq_topic_message_bytes
- nsq_topic_message_count
- up
Changelog
# 0.0.2 - September 2023

* New Filter Metrics option for configuring the Grafana Agent, which saves on metrics cost by dropping any metric not used by this integration. Beware that anything custom built using metrics that are not on the snippet will stop working.

# 0.0.1 - January 2022

* Initial release
Cost
By connecting your NSQ instance to Grafana Cloud, you might incur charges. To view information on the number of active series that your Grafana Cloud account uses for metrics included in each Cloud tier, see Active series and dpm usage and Cloud tier pricing.
Was this page helpful?
Related resources from Grafana Labs


