Service center view
The Service center provides a centralized operational view of a service. It brings together ownership information, incidents, alerts, SLOs, synthetic monitoring, dashboards, and IRM data into a single page.
By correlating Grafana Cloud resources to a service, Service center helps teams answer questions such as:
- Who owns this service? Who is currently on call?
- Are there active incidents affecting the service?
- Are alerts firing?
- Where can operational dashboards be found?
- Is the service meeting its reliability objectives?
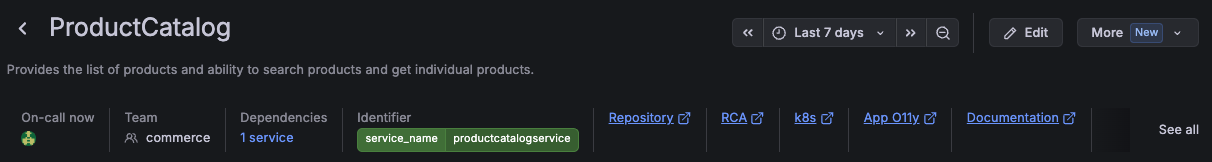
Service overview
The header section provides key service information and operational context:
- Service name, description, and identifiers
- Team ownership
- Current on-call information
- Service dependencies
- Links to operational resources such as repositories, runbooks, dashboards, and documentation
You can also manage service settings, and declare incidents or escalate issues through IRM.
Incidents
The Incidents section displays incidents associated with the service:
- Incident title and current status
- Severity
- Declaration time
- Report status
- Assigned roles
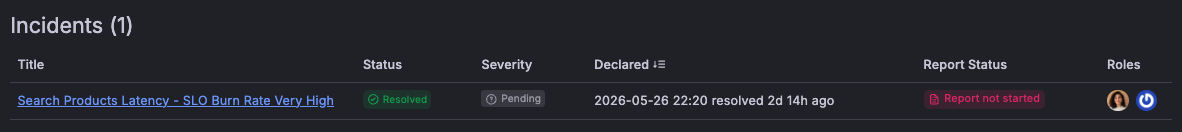
This section helps teams understand whether there are ongoing or recent incidents affecting the service.
Service level objectives (SLOs)
The SLOs section displays SLOs associated with the service.
For each SLO, Service center provides a summary of key SLO performance metrics, including:
- Error budget remaining
- Burn rate
- Current SLI value
- SLO target
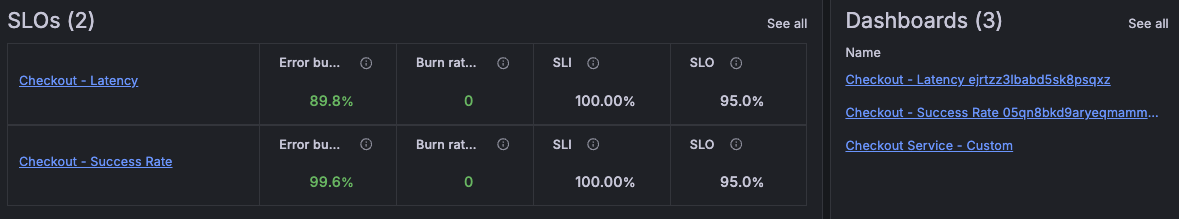
Use this section to quickly assess whether the service is meeting its reliability objectives and identify SLOs that require attention.
Dashboards
The Dashboards section lists dashboards associated with the service.
Use this section to quickly navigate to operational dashboards relevant to the service.
Alerting
The Alerting section provides a summary of alert activity associated with the service.
Depending on the selected view, you can:
- Review active and recent alert activity
- Identify frequently firing alert rules
- Identify long-running alerts
- Navigate directly to alert rules and alert instances
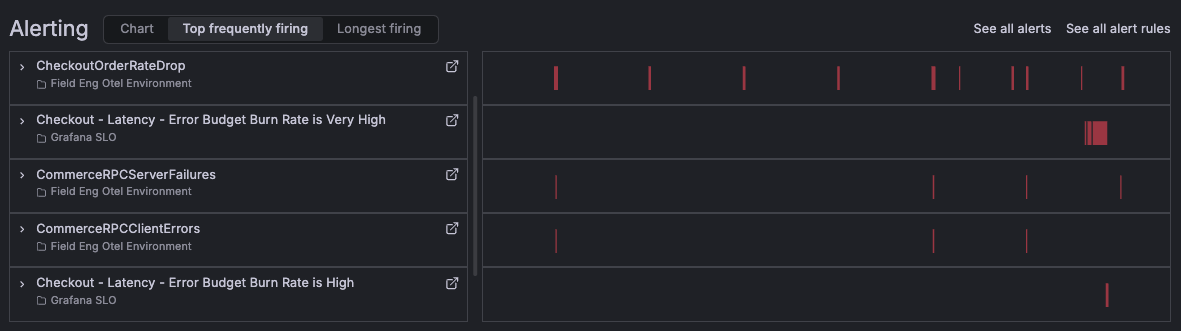
This section helps teams understand the current operational health of the service and identify recurring reliability issues.
IRM insights
The IRM section provides operational metrics from Grafana IRM.
Depending on your IRM configuration, this section can include metrics such as:
- New alert groups
- Mean time to acknowledge (MTTA)
- Mean time to resolve (MTTR)
- Alert distribution across teams and users
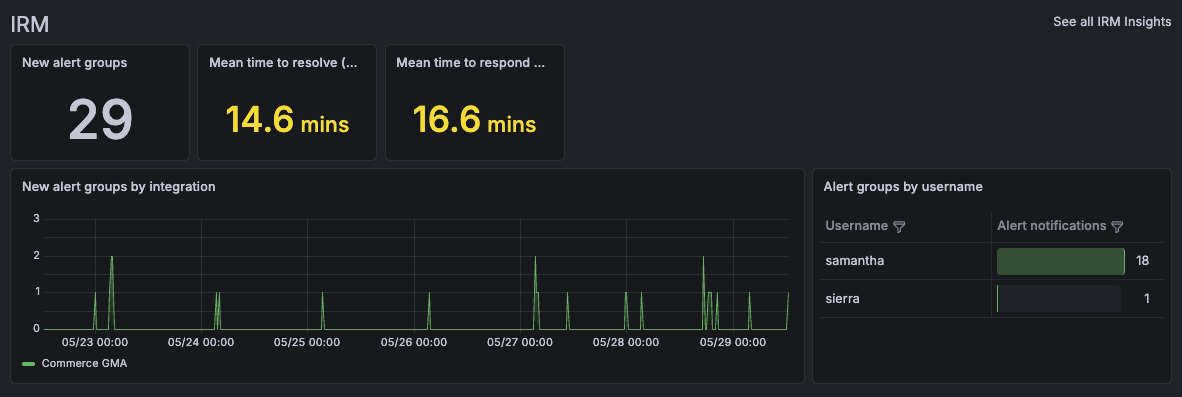
These metrics help teams understand incident response performance and operational workload.
Synthetic checks
The Synthetic checks section displays the results of the synthetic monitoring checks associated with the service, including the summary of:
- Uptime
- Reachability
- Latency
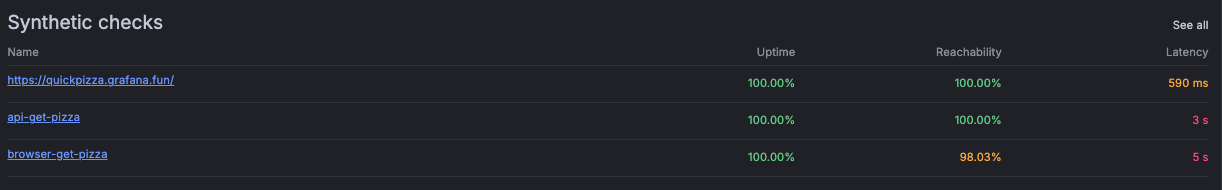
Synthetic monitoring helps validate service availability and user-facing performance from an external perspective.
Respond to service issues
If a service requires attention, you can take action directly from the header section:
- Escalate issues to responsible teams or responders
- Declare incidents
- Contact the current on-call responder
For more information, refer to Respond to service issues from Service center.


