Menu
Grafana Cloud
Service center
Service center in Grafana Cloud provides a centralized operational view for your services, bringing together service health, SLOs, alerts, incidents, on-call information, and dashboards in a single view.
As systems grow, operational context often becomes fragmented across dashboards, alerting tools, and IRM workflows.
In this environment, the service ownership model helps organizations establish accountability and manage operations at scale. Service center in Grafana Cloud supports this model by providing a centralized operational view of your services.
Service center helps teams quickly assess service reliability and ongoing operational issues from a single place, helping answer questions such as:
- How is our service performing this week?
- Who owns it, and who’s on call?
- What’s broken, and what’s improving?
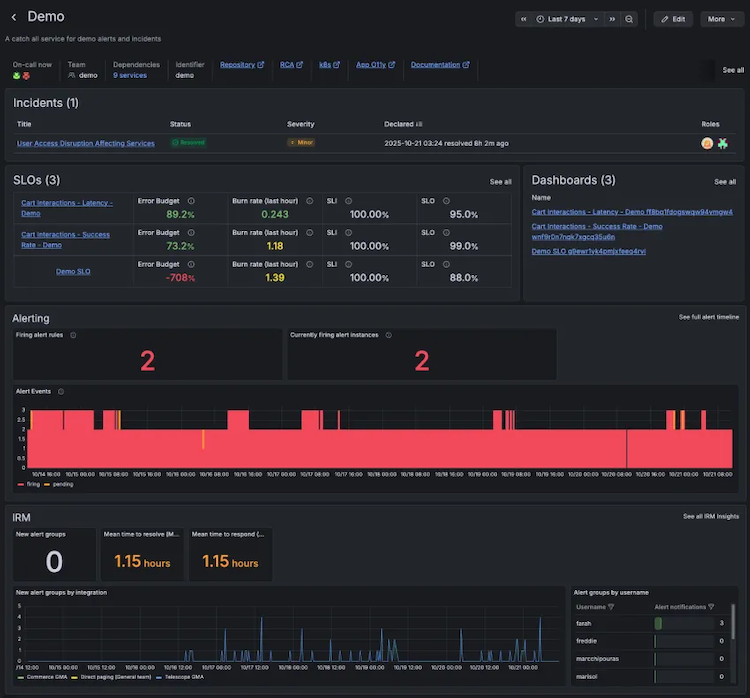
Each service view provides operational context for your services, including:
- SLOs with summary data to understand how reliability is trending
- Alerts with quick insight into current or recurring issues
- Incidents for context on recent or ongoing disruptions
- On-call and paging information to identify responders and understand activity
- Synthetic checks to verify service uptime and availability


