Menu
Grafana Cloud

Template labels and annotations

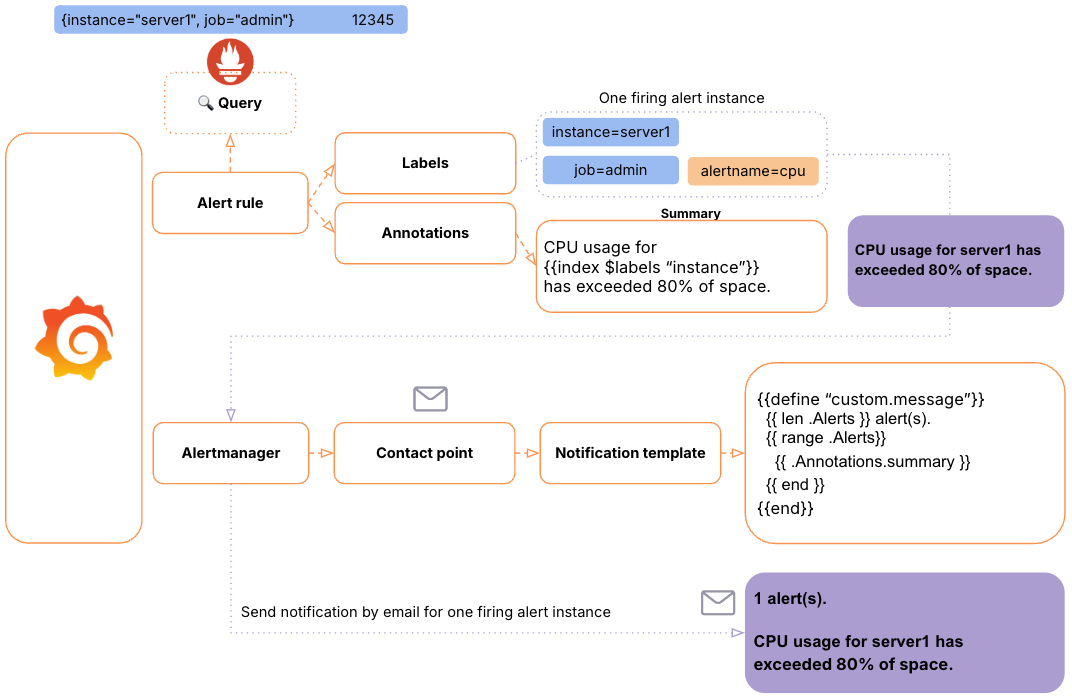
You can use templates to include data from queries and expressions in labels and annotations. For example, you might want to set the severity label for an alert based on the value of the query, or use the instance label from the query in a summary annotation so you know which server is experiencing high CPU usage.

When using custom labels with templates it is important to make sure that the label value does not change between consecutive evaluations of the alert rule as this will end up creating large numbers of distinct alerts. However, it is OK for the template to produce different label values for different alerts. For example, do not put the value of the query in a custom label as this will end up creating a new set of alerts each time the value changes. Instead use annotations.

All templates should be written in text/template. Regardless of whether you are templating a label or an annotation, you should write each template inline inside the label or annotation that you are templating. This means you cannot share templates between labels and annotations, and instead you will need to copy templates wherever you want to use them.

Each template is evaluated whenever the alert rule is evaluated, and is evaluated for every alert separately. For example, if your alert rule has a templated summary annotation, and the alert rule has 10 firing alerts, then the template will be executed 10 times, once for each alert. You should try to avoid doing expensive computations in your templates as much as possible.

Caution

Extra whitespace in label templates can break matches with notification policies.

Variables

In Grafana templating, the $ and . symbols are used to reference variables and their properties. You can reference variables directly in your alert rule definitions using the $ symbol followed by the variable name. Similarly, you can access properties of variables using the dot (.) notation within alert rule definitions.

The following variables are available to you when templating labels and annotations:

The labels variable

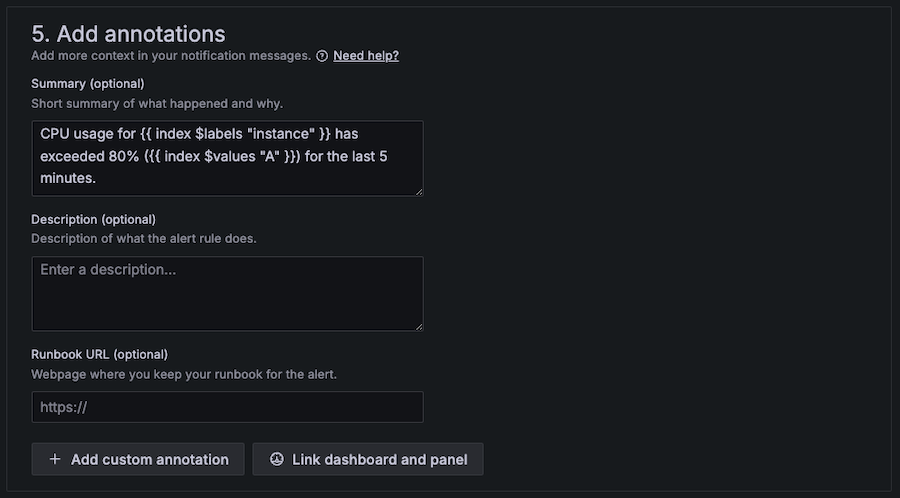
The $labels variable contains all labels from the query. For example, suppose you have a query that returns CPU usage for all of your servers, and you have an alert rule that fires when any of your servers have exceeded 80% CPU usage for the last 5 minutes. You want to add a summary annotation to the alert that tells you which server is experiencing high CPU usage. With the $labels variable you can write a template that prints a human-readable sentence such as:

CPU usage for {{ index $labels "instance" }} has exceeded 80% for the last 5 minutes

If you are using a classic condition then $labels will not contain any labels from the query. Classic conditions discard these labels in order to enforce uni-dimensional behavior (at most one alert per alert rule). If you want to use labels from the query in your template then use the example here.

The value variable

The $value variable is a string containing the labels and values of all instant queries; threshold, reduce and math expressions, and classic conditions in the alert rule. It does not contain the results of range queries, as these can return anywhere from 10s to 10,000s of rows or metrics. If it did, for especially large queries a single alert could use 10s of MBs of memory and Grafana would run out of memory very quickly.

To print the $value variable in the summary you would write something like this:

CPU usage for {{ index $labels "instance" }} has exceeded 80% for the last 5 minutes: {{ $value }}

And would look something like this:

CPU usage for instance1 has exceeded 80% for the last 5 minutes: [ var='A' labels={instance=instance1} value=81.234 ]

Here var='A' refers to the instant query with Ref ID A, labels={instance=instance1} refers to the labels, and value=81.234 refers to the average CPU usage over the last 5 minutes.

If you want to print just some of the string instead of the full string then use the $values variable. It contains the same information as $value, but in a structured table, and is much easier to use then writing a regular expression to match just the text you want.

The values variable

The $values variable is a table containing the labels and floating point values of all instant queries and expressions, indexed by their Ref IDs.

To print the value of the instant query with Ref ID A:

CPU usage for {{ index $labels "instance" }} has exceeded 80% for the last 5 minutes: {{ index $values "A" }}

For example, given an alert with the labels instance=server1 and an instant query with the value 81.2345, this would print:

CPU usage for instance1 has exceeded 80% for the last 5 minutes: 81.2345

If the query in Ref ID A is a range query rather than an instant query then add a reduce expression with Ref ID B and replace (index $values "A") with (index $values "B"):

CPU usage for {{ index $labels "instance" }} has exceeded 80% for the last 5 minutes: {{ index $values "B" }}

Examples

The following examples attempt to show the most common use-cases we have seen for templates. You can use these examples verbatim, or adapt them as necessary for your use case. For more information on how to write text/template refer see the beginner’s guide to alert notification templates in Grafana.

To print all labels, comma separated, print the $labels variable:

{{ $labels }}

For example, given an alert with the labels alertname=High CPU usage, grafana_folder=CPU alerts and instance=server1, this would print:

alertname=High CPU usage, grafana_folder=CPU alerts, instance=server1

If you are using classic conditions then $labels will not contain any labels from the query. Refer to the $labels variable for more information.

To print all labels, one per line, use a range to iterate over each key/value pair and print them individually. Here $k refers to the name and $v refers to the value of the current label:

{{ range $k, $v := $labels -}}
{{ $k }}={{ $v }}
{{ end }}

For example, given an alert with the labels alertname=High CPU usage, grafana_folder=CPU alerts and instance=server1, this would print:

alertname=High CPU usage
grafana_folder=CPU alerts
instance=server1

If you are using classic conditions then $labels will not contain any labels from the query. Refer to the $labels variable for more information.

To print an individual label use the index function with the $labels variable:

The host {{ index $labels "instance" }} has exceeded 80% CPU usage for the last 5 minutes

For example, given an alert with the labels instance=server1, this would print:

The host server1 has exceeded 80% CPU usage for the last 5 minutes

If you are using classic conditions then $labels will not contain any labels from the query. Refer to the $labels variable for more information.

To print the value of an instant query you can print its Ref ID using the index function and the $values variable:

{{ index $values "A" }}

For example, given an instant query that returns the value 81.2345, this will print:

81.2345

To print the value of a range query you must first reduce it from a time series to an instant vector with a reduce expression. You can then print the result of the reduce expression by using its Ref ID instead. For example, if the reduce expression takes the average of A and has the Ref ID B you would write:

{{ index $values "B" }}

To print the humanized value of an instant query use the humanize function:

{{ humanize (index $values "A").Value }}

For example, given an instant query that returns the value 81.2345, this will print:

81.234

To print the humanized value of a range query you must first reduce it from a time series to an instant vector with a reduce expression. You can then print the result of the reduce expression by using its Ref ID instead. For example, if the reduce expression takes the average of A and has the Ref ID B you would write:

{{ humanize (index $values "B").Value }}

To print the value of an instant query as a percentage use the humanizePercentage function:

{{ humanizePercentage (index $values "A").Value }}

This function expects the value to be a decimal number between 0 and 1. If the value is instead a decimal number between 0 and 100 you can either divide it by 100 in your query or using a math expression. If the query is a range query you must first reduce it from a time series to an instant vector with a reduce expression.

Set a severity from the value of a query

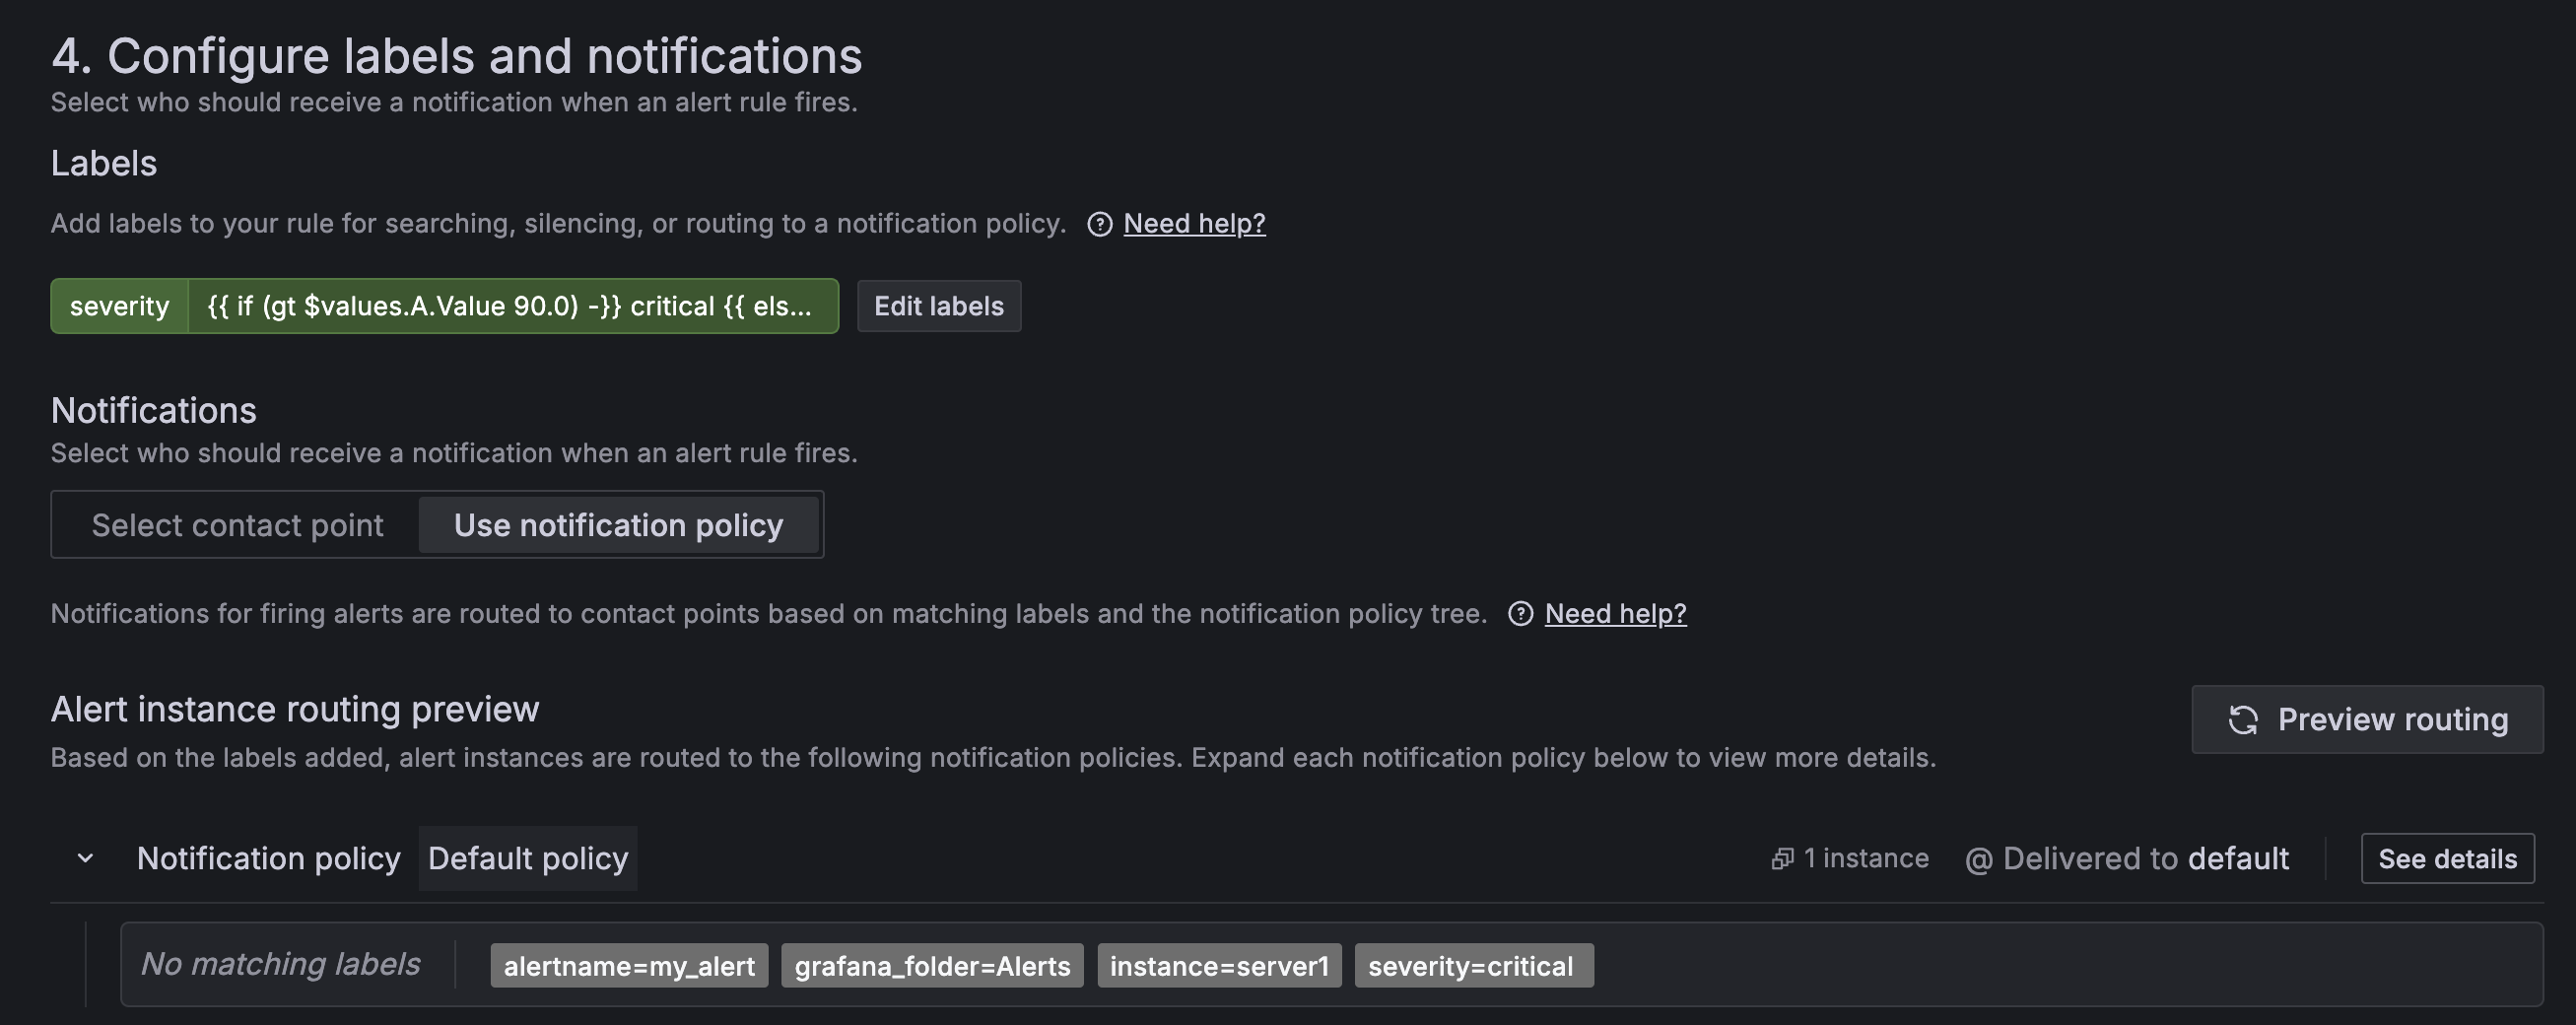
To set a severity label from the value of a query use an if statement and the greater than comparison function. Make sure to use decimals (80.0, 50.0, 0.0, etc) when doing comparisons against $values as text/template does not support type coercion. You can find a list of all the supported comparison functions here.

{{ if (gt $values.A.Value 80.0) -}}
high
{{ else if (gt $values.A.Value 50.0) -}}
medium
{{ else -}}
low
{{- end }}

You cannot use $labels to print labels from the query if you are using classic conditions, and must use $values instead. The reason for this is classic conditions discard these labels to enforce uni-dimensional behavior (at most one alert per alert rule). If classic conditions didn’t discard these labels, then queries that returned many time series would cause alerts to flap between firing and resolved constantly as the labels would change every time the alert rule was evaluated.

Instead, the $values variable contains the reduced values of all time series for all conditions that are firing. For example, if you have an alert rule with a query A that returns two time series, and a classic condition B with two conditions, then $values would contain B0, B1, B2 and B3. If the classic condition B had just one condition, then $values would contain just B0 and B1.

To print all labels of all firing time series use the following template (make sure to replace B in the regular expression with the Ref ID of the classic condition if it’s different):

{{ range $k, $v := $values -}}
{{ if (match "B[0-9]+" $k) -}}
{{ $k }}: {{ $v.Labels }}{{ end }}
{{ end }}

For example, a classic condition for two time series exceeding a single condition would print:

B0: instance=server1
B1: instance=server2

If the classic condition has two or more conditions, and a time series exceeds multiple conditions at the same time, then its labels will be duplicated for each condition that is exceeded:

B0: instance=server1
B1: instance=server2
B2: instance=server1
B3: instance=server2

If you need to print unique labels you should consider changing your alert rules from uni-dimensional to multi-dimensional instead. You can do this by replacing your classic condition with reduce and math expressions.

To print all values from a classic condition take the previous example and replace $v.Labels with $v.Value:

{{ range $k, $v := $values -}}
{{ if (match "B[0-9]+" $k) -}}
{{ $k }}: {{ $v.Value }}{{ end }}
{{ end }}

For example, a classic condition for two time series exceeding a single condition would print:

B0: 81.2345
B1: 84.5678

If the classic condition has two or more conditions, and a time series exceeds multiple conditions at the same time, then $values will contain the values of all conditions:

B0: 81.2345
B1: 92.3456
B2: 84.5678
B3: 95.6789

Functions

The following functions are available to you when templating labels and annotations:

args

The args function translates a list of objects to a map with keys arg0, arg1 etc. This is intended to allow multiple arguments to be passed to templates:

{{define "x"}}{{.arg0}} {{.arg1}}{{end}}{{template "x" (args 1 "2")}}
1 2

externalURL

The externalURL function returns the external URL of the Grafana server as configured in the ini file(s):

{{ externalURL }}
https://example.com/grafana

The graphLink function returns the path to the graphical view in Explore for the given expression and data source:

{{ graphLink "{\"expr\": \"up\", \"datasource\": \"gdev-prometheus\"}" }}
/explore?left=["now-1h","now","gdev-prometheus",{"datasource":"gdev-prometheus","expr":"up","instant":false,"range":true}]

humanize

The humanize function humanizes decimal numbers:

{{ humanize 1000.0 }}
1k

humanize1024

The humanize1024 works similar to humanize but but uses 1024 as the base rather than 1000:

{{ humanize1024 1024.0 }}
1ki

humanizeDuration

The humanizeDuration function humanizes a duration in seconds:

{{ humanizeDuration 60.0 }}
1m 0s

humanizePercentage

The humanizePercentage function humanizes a ratio value to a percentage:

{{ humanizePercentage 0.2 }}
20%

humanizeTimestamp

The humanizeTimestamp function humanizes a Unix timestamp:

{{ humanizeTimestamp 1577836800.0 }}
2020-01-01 00:00:00 +0000 UTC

match

The match function matches the text against a regular expression pattern:

{{ match "a.*" "abc" }}
true

pathPrefix

The pathPrefix function returns the path of the Grafana server as configured in the ini file(s):

{{ pathPrefix }}
/grafana

The tableLink function returns the path to the tabular view in Explore for the given expression and data source:

{{ tableLink "{\"expr\": \"up\", \"datasource\": \"gdev-prometheus\"}" }}
/explore?left=["now-1h","now","gdev-prometheus",{"datasource":"gdev-prometheus","expr":"up","instant":true,"range":false}]

title

The title function capitalizes the first character of each word:

{{ title "hello, world!" }}
Hello, World!

toLower

The toLower function returns all text in lowercase:

{{ toLower "Hello, world!" }}
hello, world!

toUpper

The toUpper function returns all text in uppercase:

{{ toUpper "Hello, world!" }}
HELLO, WORLD!

reReplaceAll

The reReplaceAll function replaces text matching the regular expression:

{{ reReplaceAll "localhost:(.*)" "example.com:$1" "localhost:8080" }}
example.com:8080