

Features
Overview
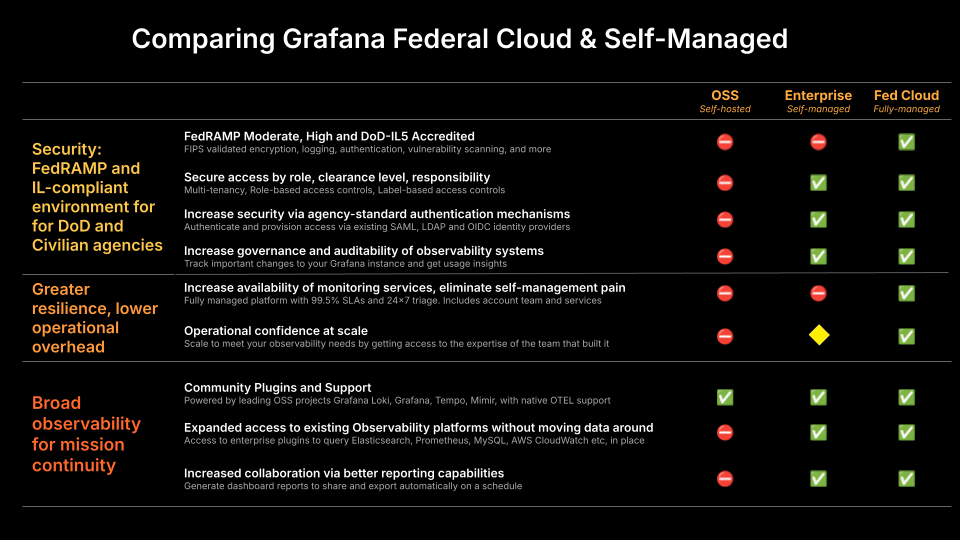
Grafana Federal Cloud is a fully managed observability offering that packages together metrics, logs, and traces with Grafana. It leverages the best open source observability software - including Grafana Mimir for Prometheus metrics, Grafana Loki for logs, Grafana Tempo for traces, and Grafana for data visualization.
Get started with Grafana Federal Cloud
With Grafana Federal Cloud, you can enable observability without the overhead of building and maintaining your own stack. This section covers the basics of observability concepts and terminology.
What is observability?
A basic overview of observability terms and concepts as well as an introduction to Prometheus. Also refer to a glossary list of terms.
Metrics and visualization
A brief introduction to visualizing metrics.
Store, query, and alert on data
How to send data to Grafana Federal Cloud from existing sources or start from scratch using Grafana Alloy.
Dashboard overview
A basic overview of how dashboards work.
Histograms and heatmaps
A brief introduction to visualization techniques such as histograms and heatmaps.
Find and use dashboards
How to import, export, create, and configure dashboards.
Alerting
Refer to Alerting Fundamentals.
In the context of FedRAMP, alert routing involves integrating with a provider that exists outside of the authorization boundary. For example, using a Grafana Cloud account, it is possible to configure a US-based tenant with IRM to manage on-call schedules and provide a platform for responding to alerts.
Note
IRM is not currently FedRAMP authorized and may require an exception from your 3PAO.
Data sources and plugins
Grafana Federal Cloud includes many data sources, specifically:
- All built-in core data sources, which are open source and ship with Grafana by default.
- All Enterprise data sources, which are maintained by Grafana Labs and connect to popular proprietary platforms like Splunk and Dynatrace.
To learn more about data sources and how they work, refer to the data sources documentation.
If you need other data sources, contact Grafana Customer Support to find out whether it can be added to Grafana Federal Cloud.
Each data source comes with a query editor, which formulates custom queries according to the source’s structure. After you add and configure a data source, you can use it as an input for many operations, including:
- Query the data with Explore.
- Visualize it in panels.
- Create rules for alerts.
How to connect your external data source
In order to access an external data source, a network allow list request must be created and approved. To begin this process, contact Grafana Customer Support with a request including:
- The type of data source. (For example, Prometheus.)
- The network CIDR ranges to be accessed. (For example,
203.0.113.15/30.)