Documentation for automated readers A curated documentation index is available at: https://grafana.com/llms.txt
A complete documentation index is available at: https://grafana.com/llms-full.txt These indexes can help with page discovery before fetching individual documents.
This page is also available in Markdown, which may be easier for automated readers
and AI tools to parse than HTML. The Markdown version is available at
https://grafana.com/docs/grafana/latest/visualizations/panels-visualizations/visualizations/text.md, or by sending
Accept: text/markdown to https://grafana.com/docs/grafana/latest/visualizations/panels-visualizations/visualizations/text/. For broader
documentation discovery, the curated index is available at https://grafana.com/llms.txt
and the complete index is available at https://grafana.com/llms-full.txt.
Text visualizations let you include text or HTML in your dashboards.
This can be used to add contextual information and descriptions or embed complex HTML.
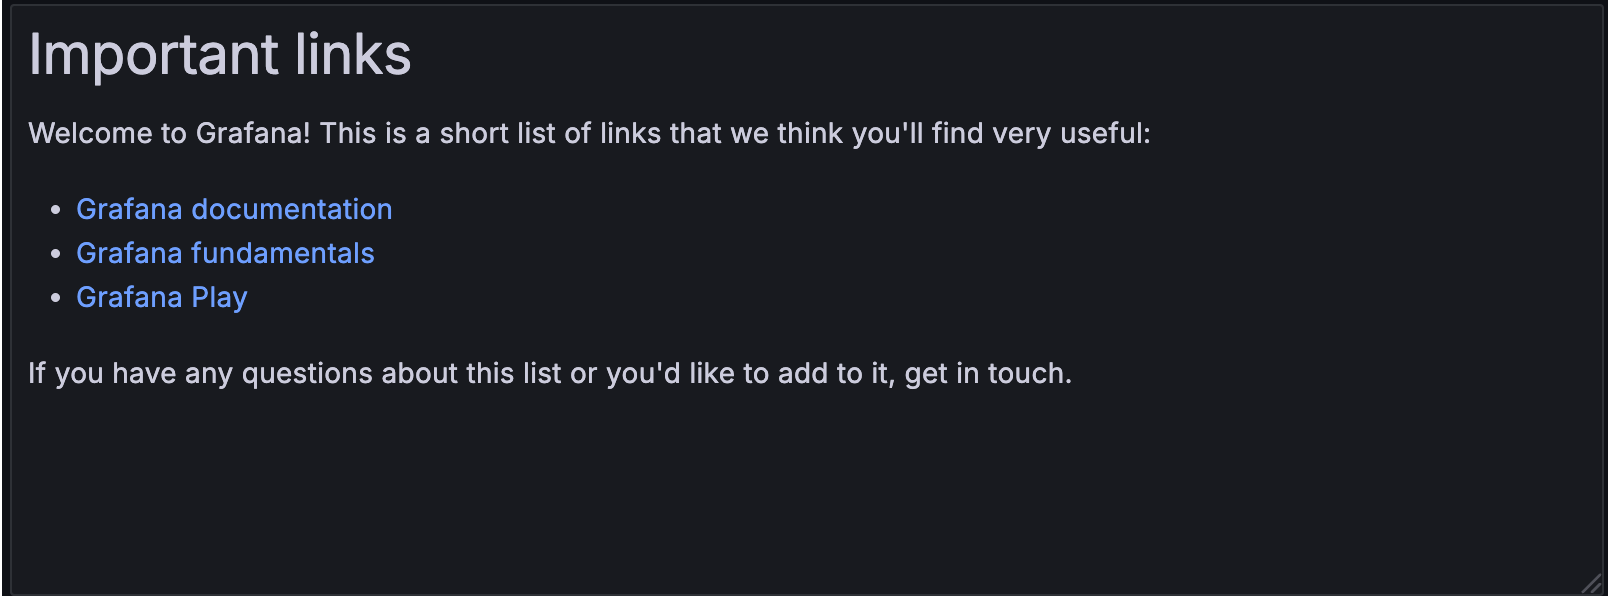
For example, if you want to display important links on your dashboard, you can use a text visualization to add these links:
Give it a try using Grafana Play
With Grafana Play, you can explore and see how it works, learning from practical examples to accelerate your development.
This feature can be seen on Text Panel.
Provide instructions or guidance on how to interpret different panels, configure settings, or take specific actions based on the displayed data.
Announce any scheduled maintenance or downtime that might impact your dashboards.
Configuration options
The following section describes the configuration options available in the panel editor pane for this visualization. These options are, as much as possible, ordered as they appear in Grafana.
Panel options
In the Panel options section of the panel editor pane, set options like the panel title, description, and show/hide rules.
To learn more, refer to
Configure panel options.
Add a description to a panel to share with users any important information about it, such as its purpose. Text entered in this field appears in a tooltip in the upper-left corner of the panel. Conversely, toggle on the Use as subtitle switch to display the description just below the panel title instead. You can use
variables you have defined or dashboard-scoped
global variables (such as $__from, $__to, $__dashboard, $__org, and $__user). Query-scoped global variables (such as $__interval and $__interval_ms) are not available in this field.
Transparent background
Toggle this switch on and off to control whether or not the panel has the same background color as the dashboard.
Panel links
Add
links to the panel to create shortcuts to other dashboards, panels, and external websites. Access panel links by clicking the icon next to the panel title.
Repeat options
Set whether to repeat the panel for each value in the selected variable.
Show/hide rules
Set whether to show or hide panels based on various rules.
Text options
Use the following options to refine your text visualization.
Option
Description
Mode
Determines how embedded content appears. Choose from:
HTML - Renders the content as sanitized HTML. If you require more direct control over the output, you can set the
disable_sanitize_html flag which enables you to directly enter HTML.
Code - Renders content inside a read-only code editor.
Variables in the content are expanded for display.
To allow embedding of iframes and other websites, you need set allow_embedding = true in your Grafana config.ini or environment variables, depending on your deployment.
Content
Enter the text to display. The content supports Markdown, HTML, or code, depending on Mode. Dashboard variables are interpolated in the content.
Language
When you choose Code as your text mode, select an appropriate language to apply syntax highlighting to the embedded text. Choose from JSON, YAML, XML, TypeScript, SQL, Go, Markdown, HTML, or Plain text. The default is Plain text.
Show line numbers
Displays line numbers in the panel preview when you choose Code as your text mode.
Show mini map
Displays a small outline of the embedded text in the panel preview when you choose Code as your text mode.