Cross-cluster query federation
Cross-cluster query federation lets you gather data from multiple Grafana Enterprise Traces (GET) clusters and provide access controls for the tracing data. Each GET cluster has to have its own license. A team that is globally responsible for all observability can make a single query across the GET clusters for all regions to retrieve trace results.
Using cross-cluster query federation, you control who can access tracing data at a cluster-level. Consider an organization that separates observability data via region. Each region may have its own GET cluster. Engineering teams in that region may (or may not, refer to cross-tenant query federation) have access to the data for that region. Depending upon the configuration, developers probably won’t have access to other regions’ GET data.
Architecture
The diagram below shows the cross-cluster federation architecture.

Before you begin
The federation-frontend target itself requires a
configured GET installation installed using the tempo-distributed Helm chart.
No other GET components are required. You can run the federation-frontend service on its own. The service configuration examples used in these procedures target the GET cluster it is configured alongside and a Grafana Cloud Traces tenant.
You also need:
- The list of GET clusters and their gateway URLs. The clusters can be GET, Tempo open source, and Cloud Traces clusters.
- Authentication credentials for each cluster, including a tenant user and token for a GET cluster and Grafana Cloud Traces; refer to the Grafana Cloud Access Policies documentation
Configure authentication for cross-cluster query federation
The federation-frontend target itself requires a
configured GET installation.
No other GET components are required.
Set up the federation-frontend
A minimal configuration of the federation-frontend target has authentication disabled,
because it forwards the HTTP authentication header
(Authorization: Basic ...) that is supplied by its clients to the target clusters.
You need to configure a list of target clusters within the enterpriseFederationFrontend.proxy_targets block. Currently, there are no equivalent CLI flags available.
Each entry requires a URL that points to a Tempo-compatible API.
For GET clusters, use this URL pattern with your GET gateway, port, and HTTP API prefix: http://<get-gateway>:<get-port>/<http_api_prefix>.
Optionally, you can configure each proxy_target to have Basic auth credentials, which override the user-supplied ones.
When you configure Basic auth with the proxy_target configuration, these credentials take precedence over the ones supplied by the client.
Without enabling authentication on the federation-frontend, any client that can reach the federation-frontend can perform queries on the target clusters by using those credentials.
To set the target option, follow these steps:
Locate your
values.yamlfile used with your tempo-distributed Helm chart installation.Open the file and add the following section:
enterpriseFederationFrontend:
 enabled: true
 proxy_targets:
   - url: http://myinstall-get-cluster-tempo-enterprise-gateway.get.svc:3100
     tls_insecure_skip_verify: true
This configures the federation-frontend to use your GET cluster as the first target. This example uses a single GET cluster. Because of this, authentication details can pass from the Grafana data source straight through the federation-frontend to the GET cluster gateway, for it to authenticate the tenant and token.
Go to Grafana Cloud, and generate a read token for your Grafana Cloud Traces instance. Refer to the Cloud Access Policies documentation for instructions.
Retrieve the Grafana Cloud Traces user ID, the generated access token, and Grafana Cloud Traces endpoint. The user ID will be a number, the token a base64 encoded string, and the endpoint will look something like this:
https://tempo-us-central1.grafana.net/tempo.Add the following to the
proxy_targetssection to yourvalues.yamlfile:- url: https://<gctEndpoint>/tempo basic_auth: username: <userID> password: <token>This target includes basic authentication. The authentication details passed by the request from Grafana are for the GET instance and not the Grafana Cloud instance. The federation-frontend lets you specify authentication details that will override any that are passed to it in a query. In this case, for the appropriate Grafana Cloud user.
Warning
This gives any client that can reach the federation-frontend access to your traces data in Grafana Cloud Traces without further authentication.
Upgrade the GET cluster by running the following command. Before you execute the command, change the GET installation name (
MYINSTALL-GET-CLUSTER) and add the appropriate namespace (GET-NAMESPACE) and version number of the Helm chart (HELM-CHART-VERSION).helm upgrade -f values.yaml MYINSTALL-GET-CLUSTER grafana/tempo-distributed --namespace GET-NAMESPACE --version HELM-CHART-VERSION
Helm updates the GET installation to include the federation-frontend service, which allows any queries routed to it to be cross-cluster compatible.
Queries can be sent directly to the appropriate GET gateways, if required.
Set up an access policy with tenant federation and a token
For demonstration purposes, we’ll create a new tenant using the Grafana Enterprise Traces plugin for Grafana, create a shared access policy for them, and then query trace data using a single data source and query.
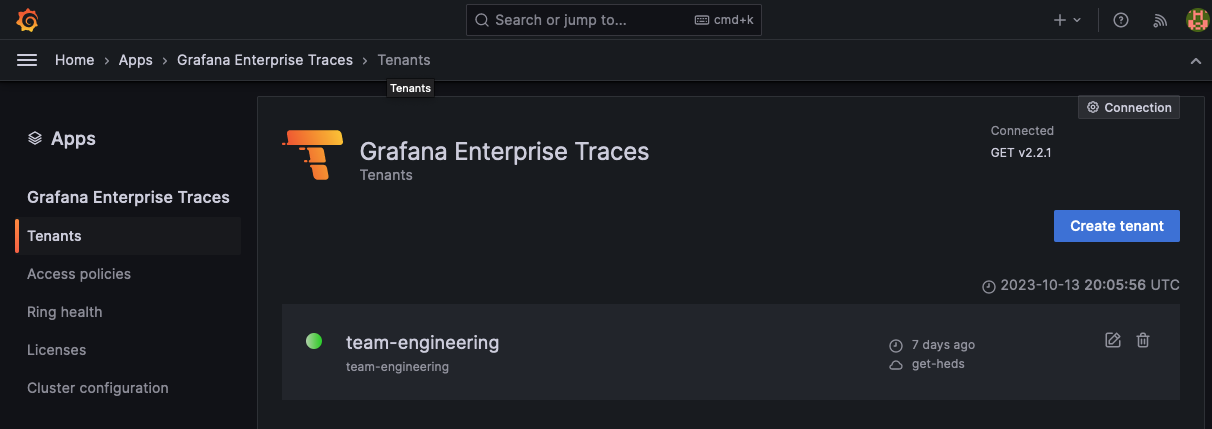
- Use the GET application plugin to create a new tenant called
team-engineering. - Select ‘Create tenant’ and create the new tenants.
- Create a new access policy called
engineering.
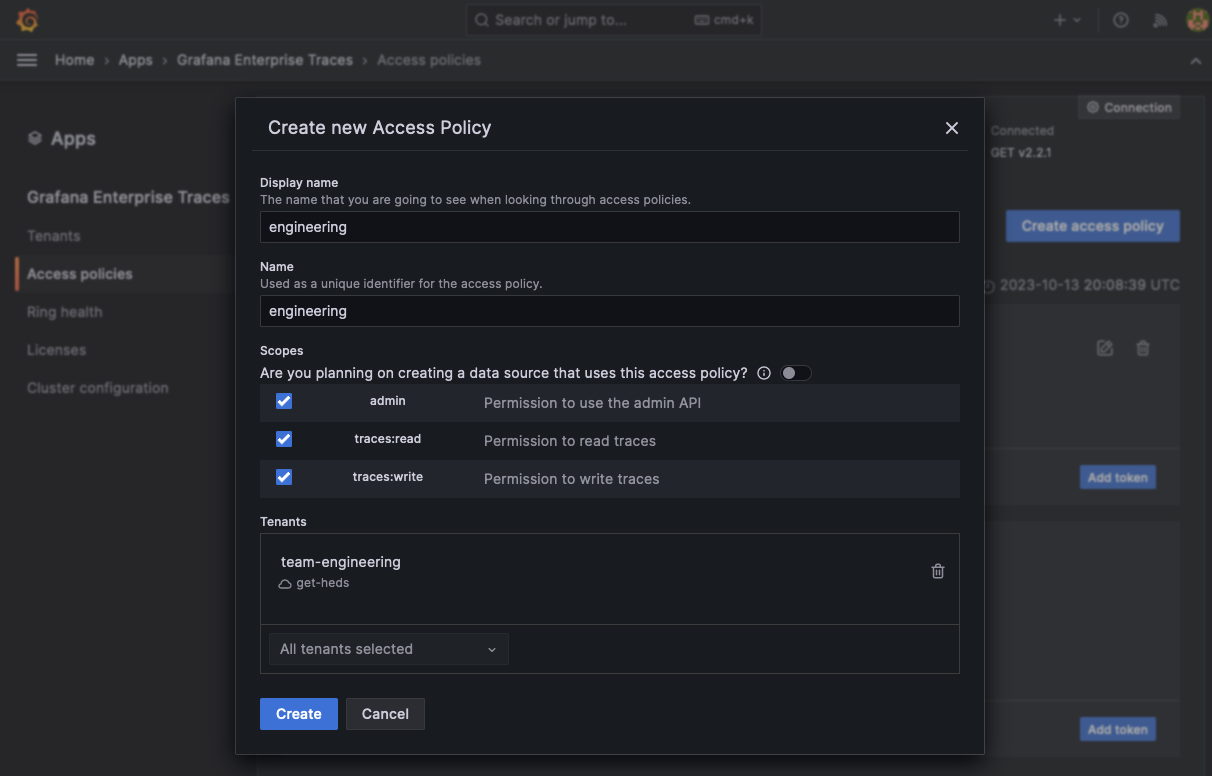
To create a raw access policy:
Create a new access policy called
engineering.Enable the
traces:readscope (or all scopes for admin and writing access as well).Under the Tenants section, add the
team-engineeringtenant.Select Create to create the new access policy.
![Create a new access policy for the tenant]()
Select Add token to create a new token for the access-policy. Click Copy to clipboard to store the token in your clipboard.
Set up a Grafana data source using the access policy
In the standard configuration, the GET plugin creates a data source for each tenant, which uses the GET gateway and configures it specifically for the single tenant specified. To use the cross-cluster capabilities, create a new Tempo data source that uses the federation-frontend service (not the default, which is the GET gateway) and specifies the tenant and generated token for basic auth.
To set up a data source using the access policy:
Create a new Tempo data source. From the Grafana Connections menu, select Data sources and then click Add new data source.
Search for Tempo and select Tempo data source.
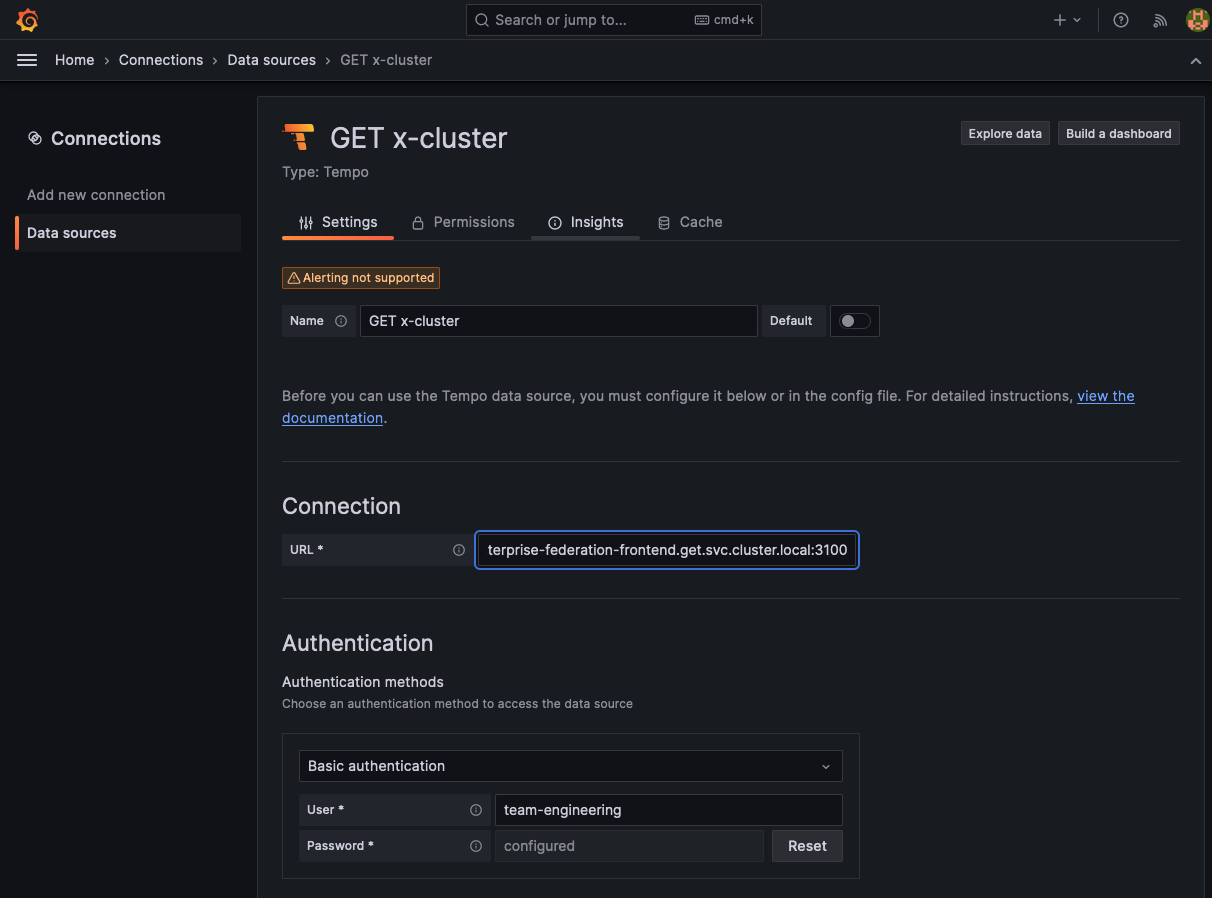
Under Connection field, select URL from the drop-down and enter the URL of the frontend-federation Kubernetes service in your GET cluster. For example (after replacing the appropriate
): http://mycluster-get-install-tempo-enterprise-federation-frontend.get.svc.cluster.local:3100.From the Authentication section, enable Basic authentication.
- In the User field, enter:
team-engineering. - In the Password field, paste the token created in the token creation process for the tenant policy.
![Set up connection and authentication for new data source]()
- In the User field, enter:
At the bottom of the page, select Save to preserve your changes and Test to validate the configuration. The test should respond with ‘Data source successfully connected’.
Generate tracing data with OpenTelemetry telemetrygen
Next, you can use OpenTelemetry telemetrygen to generate tracing data to test your configuration.
In the following instructions, the GET gateway is port-forwarded to a local development machine on port 3100 using the kubectl port-forward command. To use this example, replace the content in upper case with the information for your cluster.
kubectl port-forward --address 0.0.0.0 service/MYCLUSTER-GET-INSTALL-TEMPO-ENTERPRISE-GATEWAY 3100:3100 --namespace GET-NAMESPACETo generate data and send it to your GET cluster:
Install
telemetrygenusing the installation procedure. NOTE: You do not need to configure an OpenTelemetry Collector because you’re using Grafana Alloy.Create two new
base64token, one forteam-engineeringand the other for the Grafana Cloud Traces user tenants. For example:echo 'team-engineering:<generatedToken>' | base64 echo '<gctUser>:<gctToken>' | base64Run this command to generate a trace using
telemtrygenfor theteam-engineeringtenant. Replace thebase64Tokenwith the one generated for the tenant.telemetrygen traces --traces 1 --otlp-insecure --otlp-header 'Authorization="Basic <base64Token>"' --otlp-endpoint localhost:3100Run this command to generate a trace using
telemtrygenfor the Grafana Cloud Traces user. Replace thebase64Tokenwith the one generated for the Grafana Cloud Traces user. Replace<GCTendpoint>with the Grafana Cloud Traces endpoint.telemetrygen traces --traces 1 --otlp-header 'Authorization="Basic <token>"' --otlp-endpoint <GCTendpoint>:443
This configuration sends a single trace to the tenant. This means when GET performs a cross-cluster query, you should see two traces instead of a single trace for one cluster.
Use cross-cluster query federation
Queries run with the configured data source in either Explore or inside of dashboards are performed across all the clusters specified in federation-frontend proxy targets. These queries are processed as if all the data were from a single source.
- Go to your Grafana instance and select Explore.
- Select your cross-cluster data source.
- Selection Query type > Search and select Run query. You should see two traces returned, one from the GET cluster and the other from Grafana Cloud.
Aggregate traces from a local GET cluster and Grafana Cloud Traces instance
The federation-frontend provides an aggregated view of traces stored in a local GET cluster and a hosted Grafana Cloud Traces instance. With the following configuration, you can query both of the clusters as though they were one:
federation:
  proxy_targets:
    - name: own-data-center
      url: http://get/tempo
    - name: grafana-cloud
      url: https://tempo-us-central1.grafana.net/tempo
      basic_auth:
        username: <instance-id>
        password: <token>
This gives any client that can reach the federation-frontend access to your traces data in Grafana Cloud Traces without further authentication.
By using the authentication credentials of the local GET cluster in your query request, you can execute a query against both clusters. To do so, set the access policy’s token as a variable for subsequent commands:
export API_TOKEN="the long token string you copied"
curl -s -u "<tenant-id>:$API_TOKEN" http://federation-frontend/tempo/api/traces/4d65822107fcfd52 | jq
The federation-frontend passes the credentials from your query command to cluster="own-data-center".
Because the basic_auth block is configured to include credentials for the grafana-cloud cluster, the credentials supplied in the query command are overridden with those from the configuration file.
The credentials in the configuration file are used to authenticate with the grafana-cloud cluster.