Menu
Documentation Grafana Enterprise Metrics
Manage
Monitor
Monitor Mimir
Viewing dashboards
Writes resources
Grafana Enterprise Metrics
Manage
Monitor
Monitor Mimir
Viewing dashboards
Writes resources
Enterprise
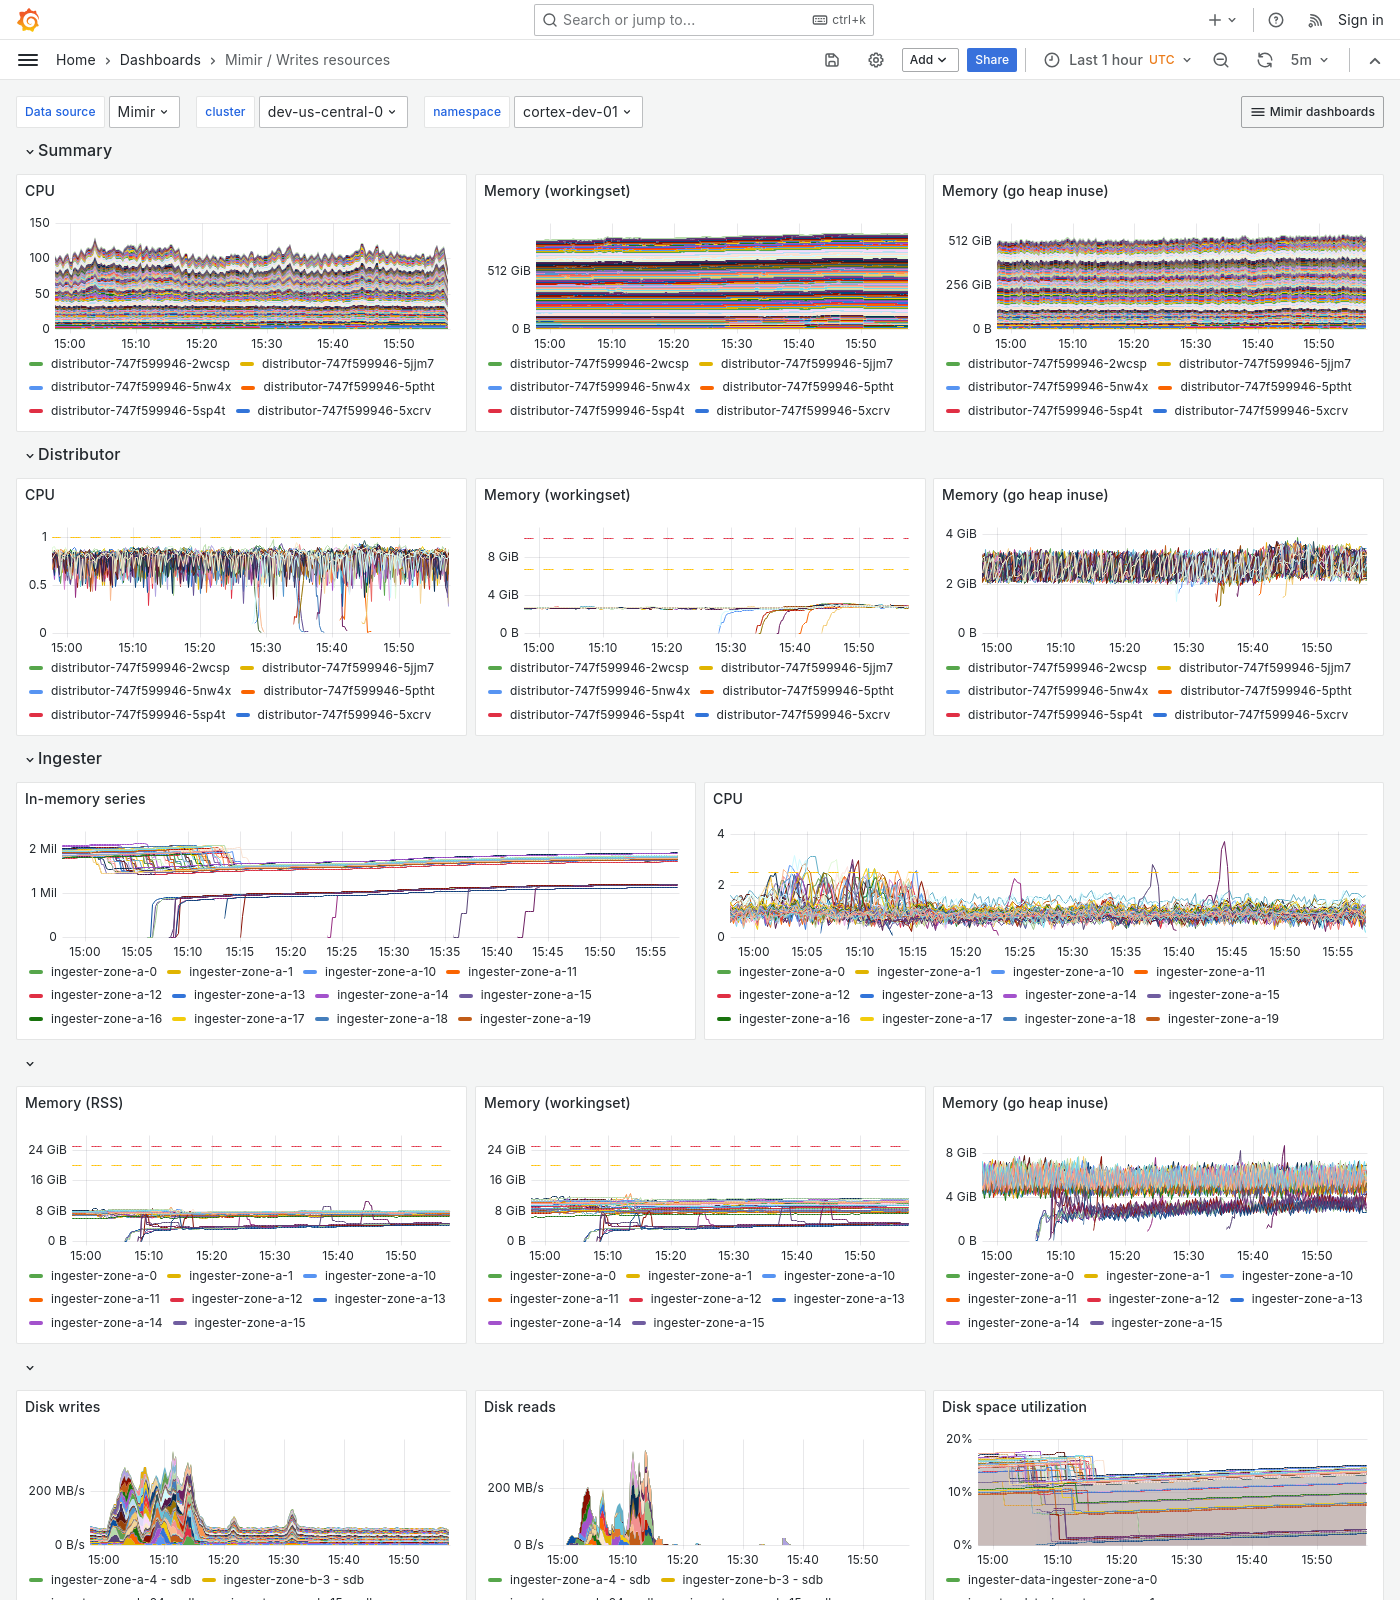
Grafana Mimir Writes resources dashboard
The Writes resources dashboard shows CPU, memory, disk, and other resource utilization metrics. The dashboard isolates each service on the write path into its own section and displays the order in which a write request flows.
This dashboard requires additional resources metrics.
Use this dashboard for the following use cases:
- Monitor the resource utilization of each component involved in the write path of a Mimir cluster.
- Identify which component is experiencing capacity issues.
Example
The following example shows a Writes resources dashboard from a demo cluster.